

Identification of candidate biomarkers and pathways associated with SCLC by bioinformatics analysis
- PMID: 29845250
- PMCID: PMC6072191
- DOI: 10.3892/mmr.2018.9095
Identification of candidate biomarkers and pathways associated with SCLC by bioinformatics analysis
Abstract
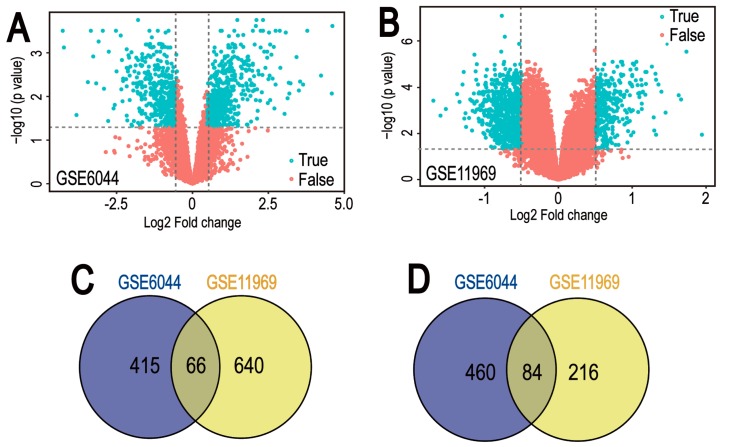
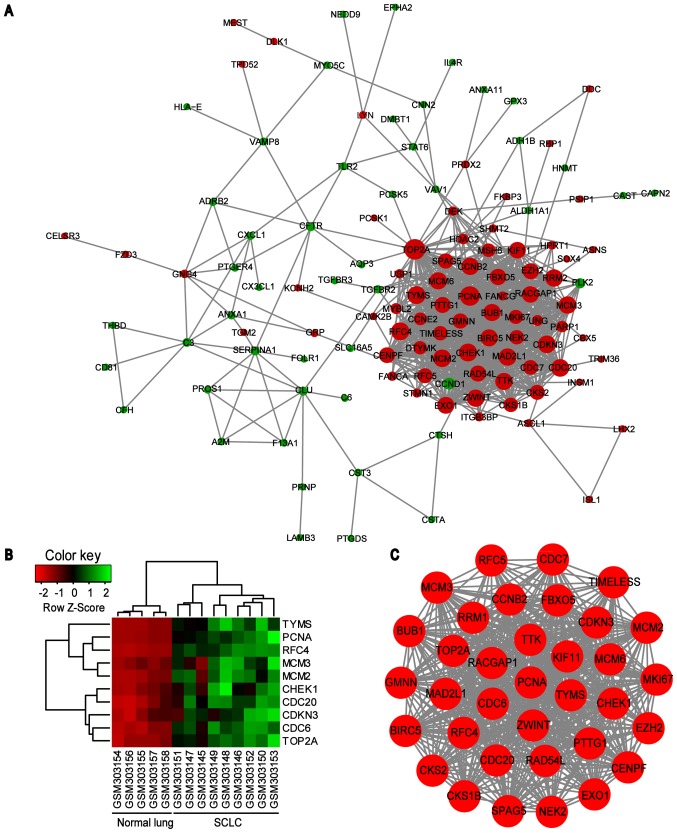
Small cell lung cancer (SCLC) is one of the highly malignant tumors and a serious threat to human health. The aim of the present study was to explore the underlying molecular mechanisms of SCLC. mRNA microarray datasets GSE6044 and GSE11969 were downloaded from Gene Expression Omnibus database, and the differentially expressed genes (DEGs) between normal lung and SCLC samples were screened using GEO2R tool. Functional and pathway enrichment analyses were performed for common DEGs using the DAVID database, and the protein‑protein interaction (PPI) network of common DEGs was constructed by the STRING database and visualized with Cytoscape software. In addition, the hub genes in the network and module analysis of the PPI network were performed using CentiScaPe and plugin Molecular Complex Detection. Finally, the mRNA expression levels of hub genes were validated in the Oncomine database. A total of 150 common DEGs with absolute fold‑change >0.5, including 66 significantly downregulated DEGs and 84 upregulated DEGs were obtained. The Gene Ontology term enrichment analysis suggested that common upregulated DEGs were primarily enriched in biological processes (BPs), including 'cell cycle', 'cell cycle phase', 'M phase', 'cell cycle process' and 'DNA metabolic process'. The common downregulated genes were significantly enriched in BPs, including 'response to wounding', 'positive regulation of immune system process', 'immune response', 'acute inflammatory response' and 'inflammatory response'. Kyoto Encyclopedia of Genes and Genomes pathway analysis identified that the common downregulated DEGs were primarily enriched in the 'complement and coagulation cascades' signaling pathway; the common upregulated DEGs were mainly enriched in 'cell cycle', 'DNA replication', 'oocyte meiosis' and the 'mismatch repair' signaling pathways. From the PPI network, the top 10 hub genes in SCLC were selected, including topoisomerase IIα, proliferating cell nuclear antigen, replication factor C subunit 4, checkpoint kinase 1, thymidylate synthase, minichromosome maintenance protein (MCM) 2, cell division cycle (CDC) 20, cyclin dependent kinase inhibitor 3, MCM3 and CDC6, the mRNA levels of which are upregulated in Oncomine SCLC datasets with the exception of MCM2. Furthermore, the genes in the significant module were enriched in 'cell cycle', 'DNA replication' and 'oocyte meiosis' signaling pathways. Therefore, the present study can shed new light on the understanding of molecular mechanisms of SCLC and may provide molecular targets and diagnostic biomarkers for the treatment and early diagnosis of SCLC.
Figures


Similar articles
-
Bioinformatics analysis of mRNA and miRNA microarray to identify the key miRNA‑gene pairs in small‑cell lung cancer.Mol Med Rep. 2019 Sep;20(3):2199-2208. doi: 10.3892/mmr.2019.10441. Epub 2019 Jun 28. Mol Med Rep. 2019. PMID: 31257520 Free PMC article.
-
Identification of lung adenocarcinoma biomarkers based on bioinformatic analysis and human samples.Oncol Rep. 2020 May;43(5):1437-1450. doi: 10.3892/or.2020.7526. Epub 2020 Feb 28. Oncol Rep. 2020. PMID: 32323809 Free PMC article.
-
Bioinformatics analyses of significant genes, related pathways and candidate prognostic biomarkers in glioblastoma.Mol Med Rep. 2018 Nov;18(5):4185-4196. doi: 10.3892/mmr.2018.9411. Epub 2018 Aug 21. Mol Med Rep. 2018. PMID: 30132538 Free PMC article.
-
Common gene signatures and key pathways in hypopharyngeal and esophageal squamous cell carcinoma: Evidence from bioinformatic analysis.Medicine (Baltimore). 2020 Oct 16;99(42):e22434. doi: 10.1097/MD.0000000000022434. Medicine (Baltimore). 2020. PMID: 33080677 Free PMC article.
-
Comprehensive analyses of potential key genes in active tuberculosis: A systematic review.Medicine (Baltimore). 2021 Jul 30;100(30):e26582. doi: 10.1097/MD.0000000000026582. Medicine (Baltimore). 2021. PMID: 34397688 Free PMC article.
Cited by
-
Identification of key biomarkers and potential molecular mechanisms in lung cancer by bioinformatics analysis.Oncol Lett. 2019 Nov;18(5):4429-4440. doi: 10.3892/ol.2019.10796. Epub 2019 Sep 4. Oncol Lett. 2019. PMID: 31611952 Free PMC article.
-
Identification of Key Biomarkers and Pathways in Small-Cell Lung Cancer Using Biological Analysis.Biomed Res Int. 2021 Oct 19;2021:5953386. doi: 10.1155/2021/5953386. eCollection 2021. Biomed Res Int. 2021. PMID: 34712733 Free PMC article.
-
Significant prognostic value of cell-cycle proteins in early-stage small cell carcinoma of cervix.Sci Rep. 2025 Jul 24;15(1):26860. doi: 10.1038/s41598-025-12112-5. Sci Rep. 2025. PMID: 40702150 Free PMC article.
-
A 15-Gene-Based Risk Signature for Predicting Overall Survival in SCLC Patients Who Have Undergone Surgical Resection.Cancers (Basel). 2023 Oct 30;15(21):5219. doi: 10.3390/cancers15215219. Cancers (Basel). 2023. PMID: 37958393 Free PMC article.
-
Bioinformatics analysis of mRNA and miRNA microarray to identify the key miRNA‑gene pairs in small‑cell lung cancer.Mol Med Rep. 2019 Sep;20(3):2199-2208. doi: 10.3892/mmr.2019.10441. Epub 2019 Jun 28. Mol Med Rep. 2019. PMID: 31257520 Free PMC article.
References
-
- Nicholson AG, Chansky K, Crowley J, Beyruti R, Kubota K, Turrisi A, Eberhardt WE, van Meerbeeck J, Rami-Porta R. Staging and Prognostic Factors Committee, Advisory Boards, and Participating Institutions; Staging and Prognostic Factors Committee Advisory Boards and Participating Institutions: The international association for the study of lung cancer lung cancer staging project: Proposals for the revision of the clinical and pathologic staging of small cell lung cancer in the forthcoming eighth edition of the TNM classification for lung cancer. J Thorac Oncol. 2016;11:300–311. doi: 10.1016/j.jtho.2015.10.008. - DOI - PubMed
MeSH terms
Substances
LinkOut - more resources
Full Text Sources
Other Literature Sources
Medical
Miscellaneous
