

Impact of Cost Display on Ordering Patterns for Hospital Laboratory and Imaging Services
- PMID: 29845468
- PMCID: PMC6082197
- DOI: 10.1007/s11606-018-4495-6
Impact of Cost Display on Ordering Patterns for Hospital Laboratory and Imaging Services
Abstract
Background: Physicians "purchase" many health care services on behalf of patients yet remain largely unaware of the costs of these services. Electronic health record (EHR) cost displays may facilitate cost-conscious ordering of health services.
Objective: To determine whether displaying hospital lab and imaging order costs is associated with changes in the number and costs of orders placed.
Design: Quasi-experimental study.
Participants: All patients with inpatient or observation encounters across a multi-site health system from April 2013 to October 2015.
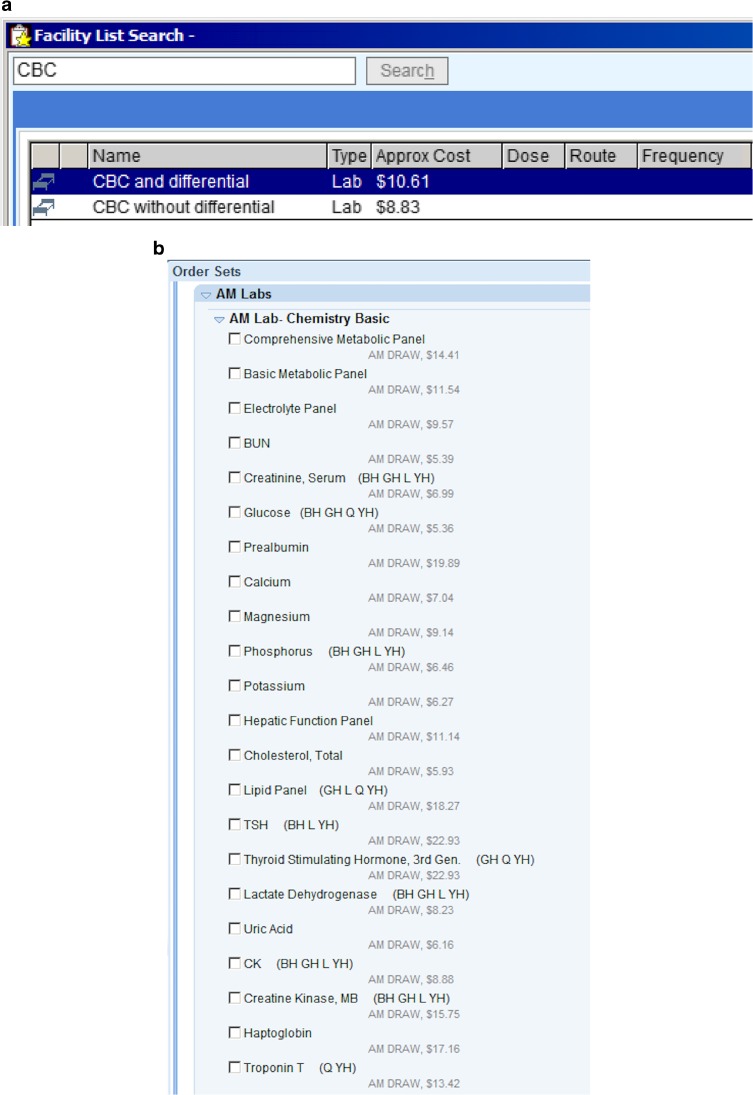
Intervention: Display of order costs, based on Medicare fee schedules, in the EHR for 1032 lab tests and 1329 imaging tests.
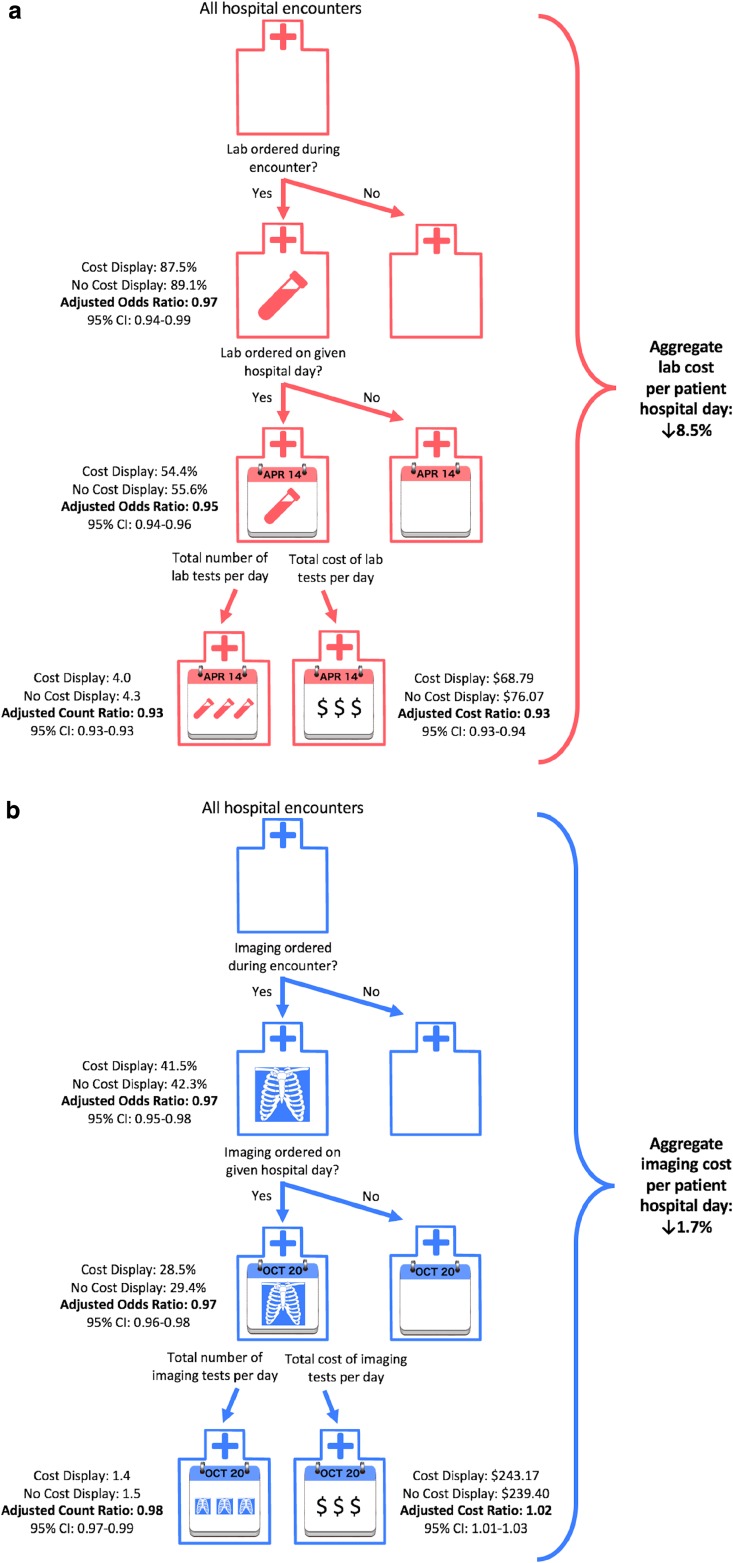
Main measures: Outcomes for both lab and imaging orders were (1) whether an order was placed during a hospital encounter, (2) whether an order was placed on a given patient-day, (3) number of orders placed per patient-day, and (4) cost of orders placed per patient-day.
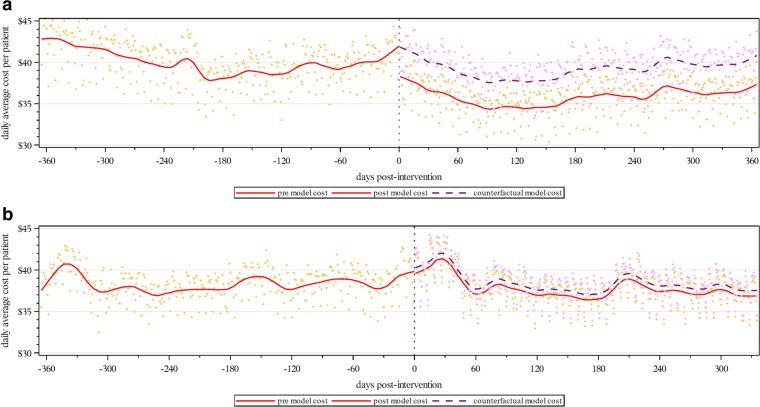
Key results: During the lab and imaging study periods, there were 248,214 and 258,267 encounters, respectively. Cost display implementation was associated with a decreased odds of any lab or imaging being ordered during the encounter (lab adjusted odds ratio [AOR] = 0.97, p = .01; imaging AOR = 0.97, p < .001), a decreased odds of any lab or imaging being ordered on a given patient-day (lab AOR = 0.95, p < .001; imaging AOR = 0.97, p < .001), a decreased number of lab or imaging orders on patient-days with orders (lab adjusted count ratio = 0.93, p < .001; imaging adjusted count ratio = 0.98, p < .001), and a decreased cost of lab orders and increased cost of imaging orders on patient-days with orders (lab adjusted cost ratio = 0.93, p < .001; imaging adjusted cost ratio = 1.02, p = .003). Overall, the intervention was associated with an 8.5 and 1.7% reduction in lab and imaging costs per patient-day, respectively.
Conclusions: Displaying costs within EHR ordering screens was associated with decreases in the number and costs of lab and imaging orders.
Keywords: cost display; electronic health record; physician ordering patterns.
Conflict of interest statement
The authors declare that they do not have conflicts of interest.
Figures
Comment in
-
Capsule Commentary on Silvestri et al., Impact of Cost Display on Ordering Patterns for Hospital Laboratory and Imaging Services.J Gen Intern Med. 2018 Aug;33(8):1383. doi: 10.1007/s11606-018-4516-5. J Gen Intern Med. 2018. PMID: 29869144 Free PMC article. No abstract available.
References
-
- Long T, Bongiovanni T, Dashevsky M, et al. Impact of laboratory cost display on resident attitudes and knowledge about costs. Postgraduate medical journal. 2016. - PubMed
-
- Hampers LC, Cha S, Gutglass DJ, Krug SE, Binns HJ. The effect of price information on test-ordering behavior and patient outcomes in a pediatric emergency department. Pediatrics. 1999;103(4 Pt 2):877–882. - PubMed
Publication types
MeSH terms
LinkOut - more resources
Full Text Sources
Other Literature Sources
Medical
Miscellaneous
