

Global seafood consumption footprint
- PMID: 29845576
- PMCID: PMC6346599
- DOI: 10.1007/s13280-018-1060-9
Global seafood consumption footprint
Abstract
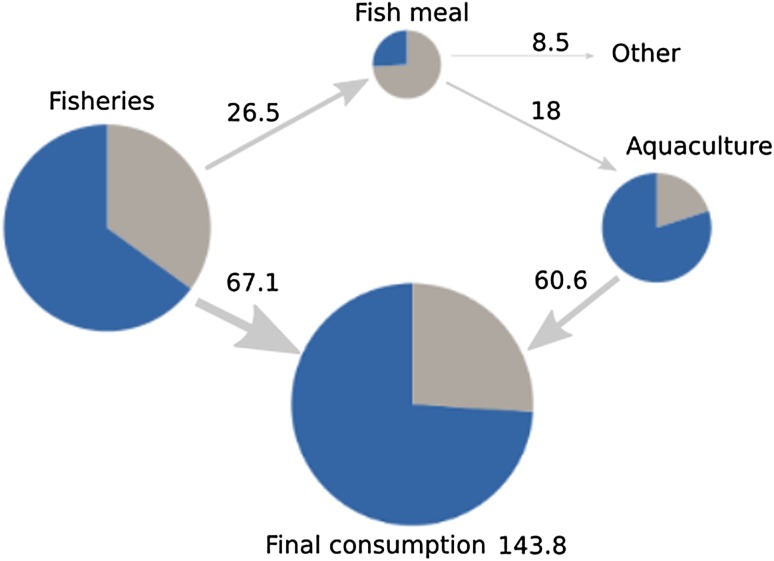
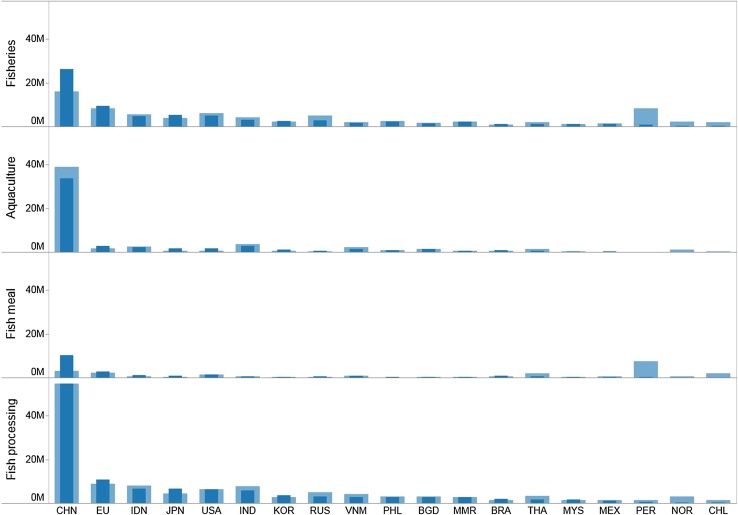
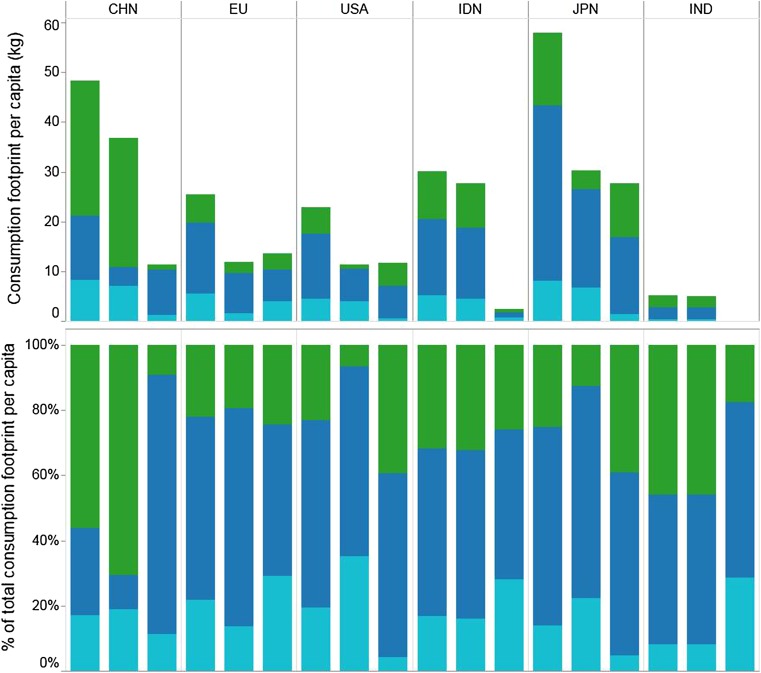
To ensure food security and nutritional quality for a growing world population in the face of climate change, stagnant capture fisheries production, increasing aquaculture production and competition for natural resources, countries must be accountable for what they consume rather than what they produce. To investigate the sustainability of seafood consumption, we propose a methodology to examine the impact of seafood supply chains across national boundaries: the seafood consumption footprint. The seafood consumption footprint is expressed as the biomass of domestic and imported seafood production required to satisfy national seafood consumption, and is estimated using a multi-regional input output model. Thus, we reconstruct for the first time the global fish biomass flows in national supply chains to estimate consumption footprints at the global, country and sector levels (capture fisheries, aquaculture, distribution and processing, and reduction into fishmeal and fish oil) taking into account the biomass supply from beyond national borders.
Keywords: Aquaculture; Consumption footprint; Fish meal and fish oil; Fisheries; Multi-region input–output model.
Figures
References
-
- Alder J, Campbell B, Karpouzi V, Kaschner K, Pauly D. Forage fish: From ecosystems to markets. Annual Review of Environment and Resources. 2008;33:153. doi: 10.1146/annurev.environ.33.020807.143204. - DOI
-
- Asche F. Farming the sea. Marine Resource Economics. 2008;23:527–547. doi: 10.1086/mre.23.4.42629678. - DOI
-
- Asche F, Bellemare MF, Roheim C, Smith MD, Tveteras S. Fair enough? Food security and the international trade of seafood. World Development. 2015;67:151–160. doi: 10.1016/j.worlddev.2014.10.013. - DOI
-
- Asche F, Guttormsen AG, Nielsen R. Future challenges for the maturing Norwegian salmon aquaculture industry: An analysis of total factor productivity change from 1996 to 2008. Aquaculture. 2013;396:43–50. doi: 10.1016/j.aquaculture.2013.02.015. - DOI
-
- Asche F, Oglend A, Tveterås S. Regime shifts in the fish meal/soybean meal price ratio. Journal of Agricultural Economics. 2013;64:97–111. doi: 10.1111/j.1477-9552.2012.00357.x. - DOI
MeSH terms
LinkOut - more resources
Full Text Sources
Other Literature Sources
