

Reliability of forearm oxygen uptake during handgrip exercise: assessment by ultrasonography and venous blood gas
- PMID: 29845765
- PMCID: PMC5974736
- DOI: 10.14814/phy2.13696
Reliability of forearm oxygen uptake during handgrip exercise: assessment by ultrasonography and venous blood gas
Abstract
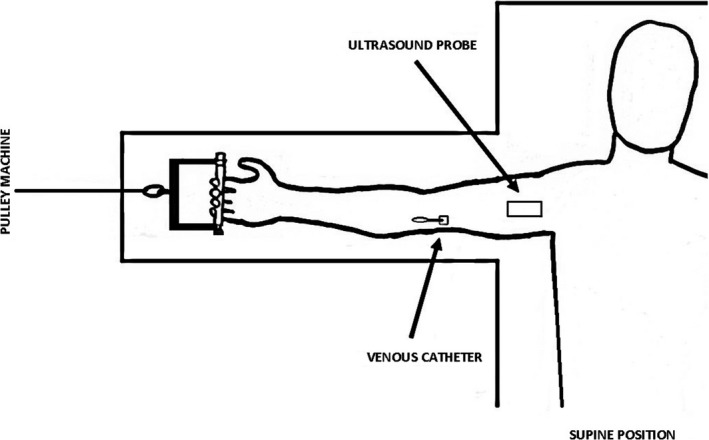
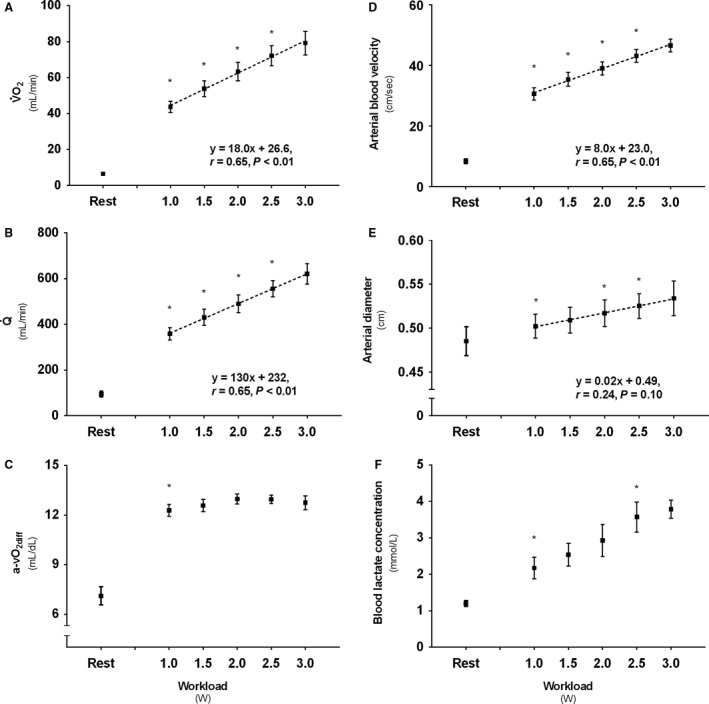
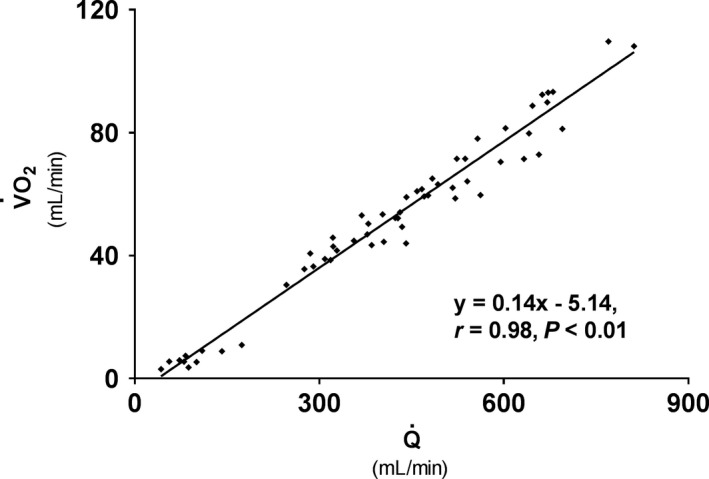
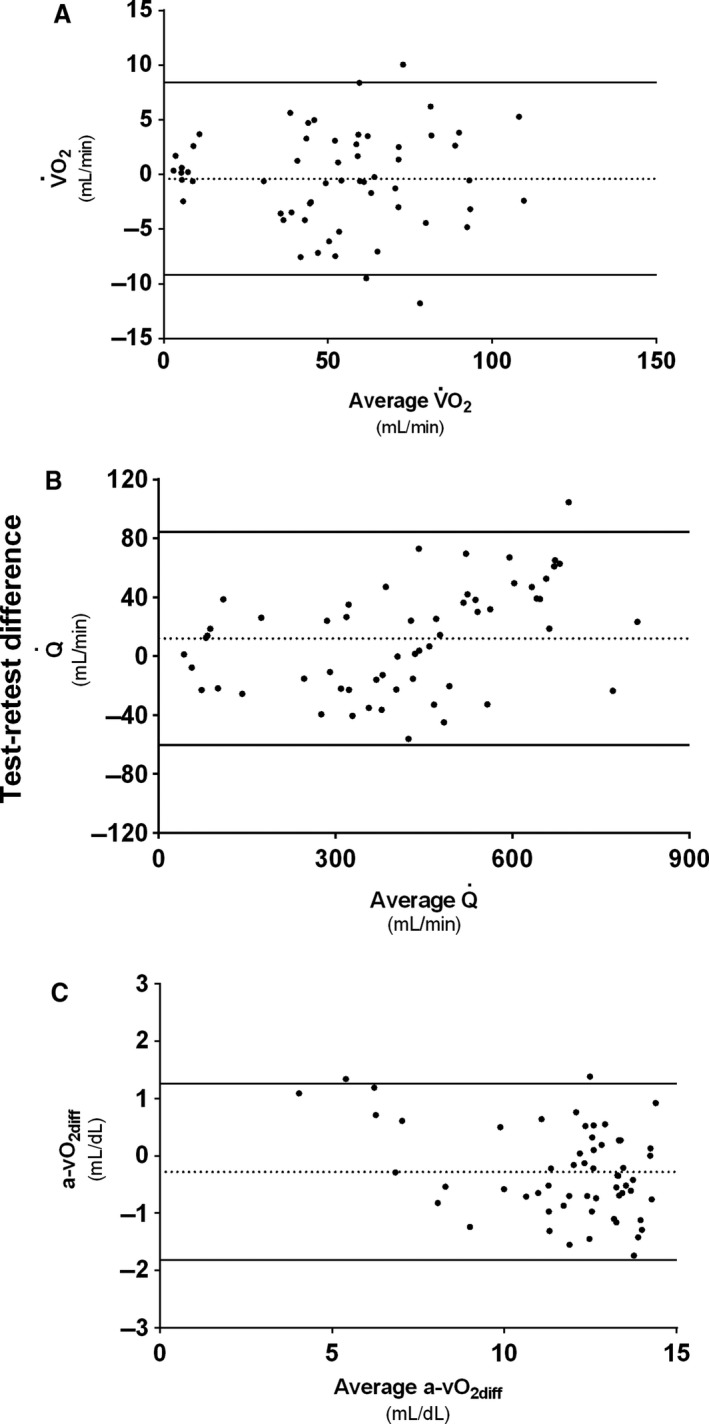
Assessment of forearm oxygen uptake (V˙O2 ) during handgrip exercise is a keenly investigated concept for observing small muscle mass metabolism. Although a combination of Doppler ultrasound measurements of brachial artery blood flow (Q˙) and blood gas drawn from a deep forearm vein has been utilized to calculate forearm V˙O2 for more than two decades, the applicability of this experimental design may benefit from a thorough evaluation of its reliability during graded exercise. Therefore, we evaluated the reliability of this technique during incremental handgrip exercise in ten healthy young (24 ± 3(SD) years.) males. V˙O2 and work rate (WR) exhibited a linear relationship (1.0 W: 43.8 ± 10.1 mL·min-1 ; 1.5 W: 53.8 ± 14.1 mL·min-1 ; 2.0 W: 63.4 ± 16.3 mL·min-1 ; 2.5 W: 72.2 ± 17.6 mL·min-1 ; 3.0 W: 79.2 ± 18.6 mL·min-1 ; r = 0.65, P < 0.01). In turn, V˙O2 was strongly associated with Q˙ (1.0 W: 359 ± 86 mL·min-1 ; 1.5 W: 431 ± 112 mL·min-1 ; 2.0 W: 490 ± 123 mL·min-1 ; 2.5 W: 556 ± 112 mL·min-1 ; 3.0 W: 622 ± 131 mL·min-1 ; r = 0.96; P < 0.01), whereas arteriovenous oxygen difference (a-vO2diff ) remained constant following all WRs (123 ± 11-130 ± 10 mL·L-1 ). Average V˙O2 test-retest difference was -0.4 mL·min-1 with ±2SD limits of agreement (LOA) of 8.4 and -9.2 mL·min-1 , respectively, whereas coefficients of variation (CVs) ranged from 4-7%. Accordingly, test-retest Q˙ difference was 11.9 mL·min-1 (LOA: 84.1 mL·min-1 ; -60.4 mL·min-1 ) with CVs between 4 and 7%. Test-retest difference for a-vO2diff was -0.28 mL·dL-1 (LOA: 1.26mL·dL-1 ; -1.82 mL·dL-1 ) with 3-5% CVs. In conclusion, our results revealed that forearm V˙O2 determination by Doppler ultrasound and direct venous sampling is linearly related to WR, and a reliable experimental design across a range of exercise intensities.
Keywords: Blood flow; V˙O2; oxygen extraction; small muscle mass; test-retest.
© 2018 The Authors. Physiological Reports published by Wiley Periodicals, Inc. on behalf of The Physiological Society and the American Physiological Society.
Figures
Similar articles
-
Blood flow regulation and oxygen uptake during high-intensity forearm exercise.J Appl Physiol (1985). 2017 Apr 1;122(4):907-917. doi: 10.1152/japplphysiol.00983.2016. Epub 2017 Jan 5. J Appl Physiol (1985). 2017. PMID: 28057820
-
Maximal strength training-induced improvements in forearm work efficiency are associated with reduced blood flow.Am J Physiol Heart Circ Physiol. 2018 Apr 1;314(4):H853-H862. doi: 10.1152/ajpheart.00435.2017. Epub 2017 Dec 29. Am J Physiol Heart Circ Physiol. 2018. PMID: 29351462 Free PMC article.
-
Assessing functional sympatholysis during rhythmic handgrip exercise using Doppler ultrasound and near-infrared spectroscopy: sex differences and test-retest reliability.Am J Physiol Regul Integr Comp Physiol. 2022 Nov 1;323(5):R810-R821. doi: 10.1152/ajpregu.00123.2022. Epub 2022 Oct 3. Am J Physiol Regul Integr Comp Physiol. 2022. PMID: 36189987
-
Systemic and vastus lateralis muscle blood flow and O2 extraction during ramp incremental cycle exercise.Am J Physiol Regul Integr Comp Physiol. 2013 May 1;304(9):R720-5. doi: 10.1152/ajpregu.00016.2013. Epub 2013 Mar 20. Am J Physiol Regul Integr Comp Physiol. 2013. PMID: 23515617 Free PMC article.
-
Individual susceptibility to hypoperfusion and reductions in exercise performance when perfusion pressure is reduced: evidence for vasodilator phenotypes.J Appl Physiol (1985). 2014 Aug 15;117(4):392-405. doi: 10.1152/japplphysiol.01155.2013. Epub 2014 Jun 26. J Appl Physiol (1985). 2014. PMID: 24970851 Free PMC article.
Cited by
-
Limb blood flow and tissue perfusion during exercise with blood flow restriction.Eur J Appl Physiol. 2019 Feb;119(2):377-387. doi: 10.1007/s00421-018-4029-2. Epub 2018 Nov 12. Eur J Appl Physiol. 2019. PMID: 30421007
-
Assessment of resistance vessel function in human skeletal muscle: guidelines for experimental design, Doppler ultrasound, and pharmacology.Am J Physiol Heart Circ Physiol. 2020 Feb 1;318(2):H301-H325. doi: 10.1152/ajpheart.00649.2019. Epub 2019 Dec 30. Am J Physiol Heart Circ Physiol. 2020. PMID: 31886718 Free PMC article. Review.
-
Global REACH 2018: increased adrenergic restraint of blood flow preserves coupling of oxygen delivery and demand during exercise at high-altitude.J Physiol. 2022 Aug;600(15):3483-3495. doi: 10.1113/JP282972. Epub 2022 Jul 12. J Physiol. 2022. PMID: 35738560 Free PMC article.
-
Aging increases metabolic capacity and reduces work efficiency during handgrip exercise in males.J Appl Physiol (1985). 2023 May 1;134(5):1154-1164. doi: 10.1152/japplphysiol.00411.2022. Epub 2023 Mar 23. J Appl Physiol (1985). 2023. PMID: 36958347 Free PMC article.
-
The Effect of Low-Intensity Interval Exercise with Blood Flow Restriction on Plasma Cardiac Troponin: A Cross-Design Trial.Anatol J Cardiol. 2024 Sep 18;28(11):542-9. doi: 10.14744/AnatolJCardiol.2024.4458. Online ahead of print. Anatol J Cardiol. 2024. PMID: 39292153 Free PMC article.
References
-
- Bland, J. M. , and Altman D. G.. 1986. Statistical methods for assessing agreement between two methods of clinical measurement. Lancet (London, England) 1: 307–310. - PubMed
-
- Boland, R. , and Adams R.. 1996. Development and evaluation of a precision forearm and hand volumeter and measuring cylinder. J. Hand Ther. 9:349–358. - PubMed
MeSH terms
Substances
LinkOut - more resources
Full Text Sources
Other Literature Sources
Medical
Miscellaneous
