. 2018 May 30:7:e34058.
doi: 10.7554/eLife.34058.

A transcriptomics resource reveals a transcriptional transition during ordered sarcomere morphogenesis in flight muscle

Affiliations

A transcriptomics resource reveals a transcriptional transition during ordered sarcomere morphogenesis in flight muscle

Maria L Spletter et al. Elife. .

Abstract

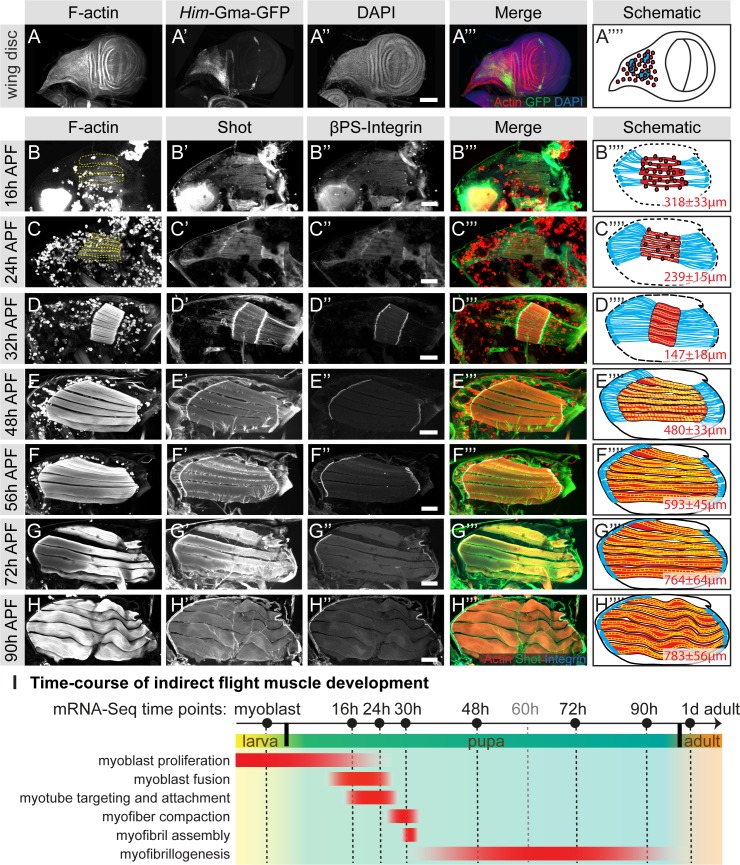
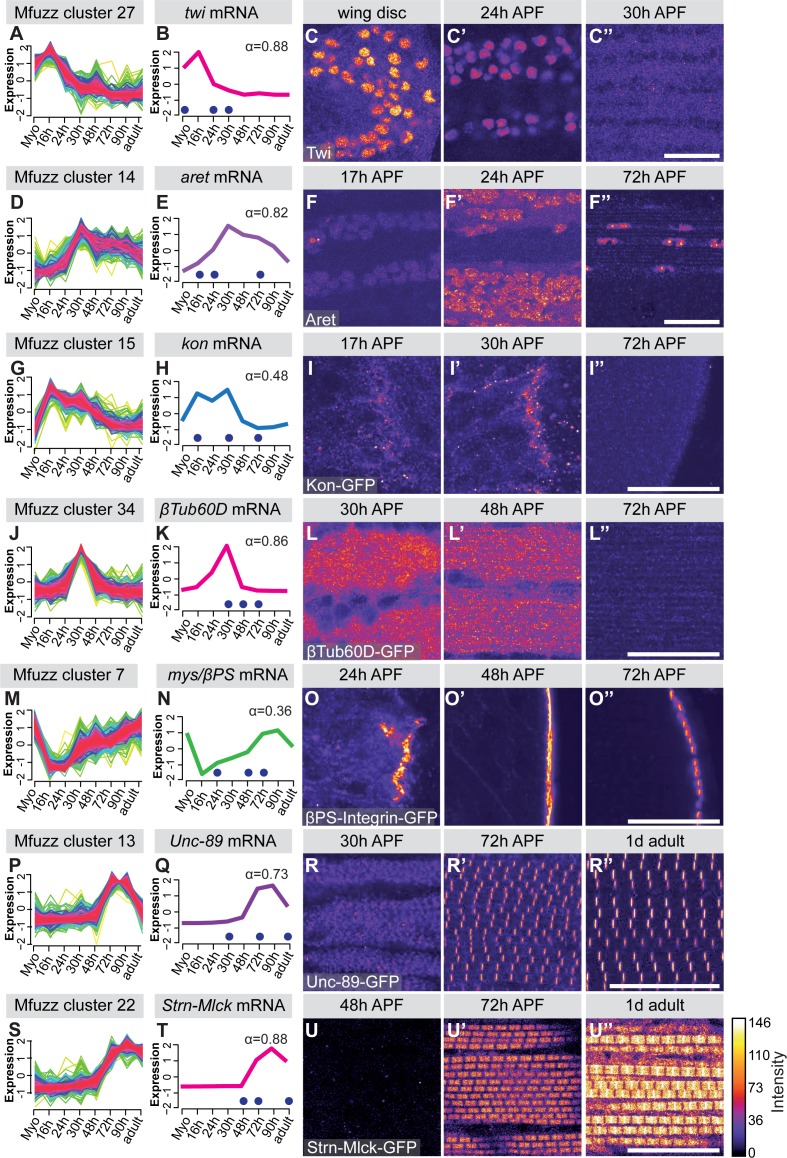
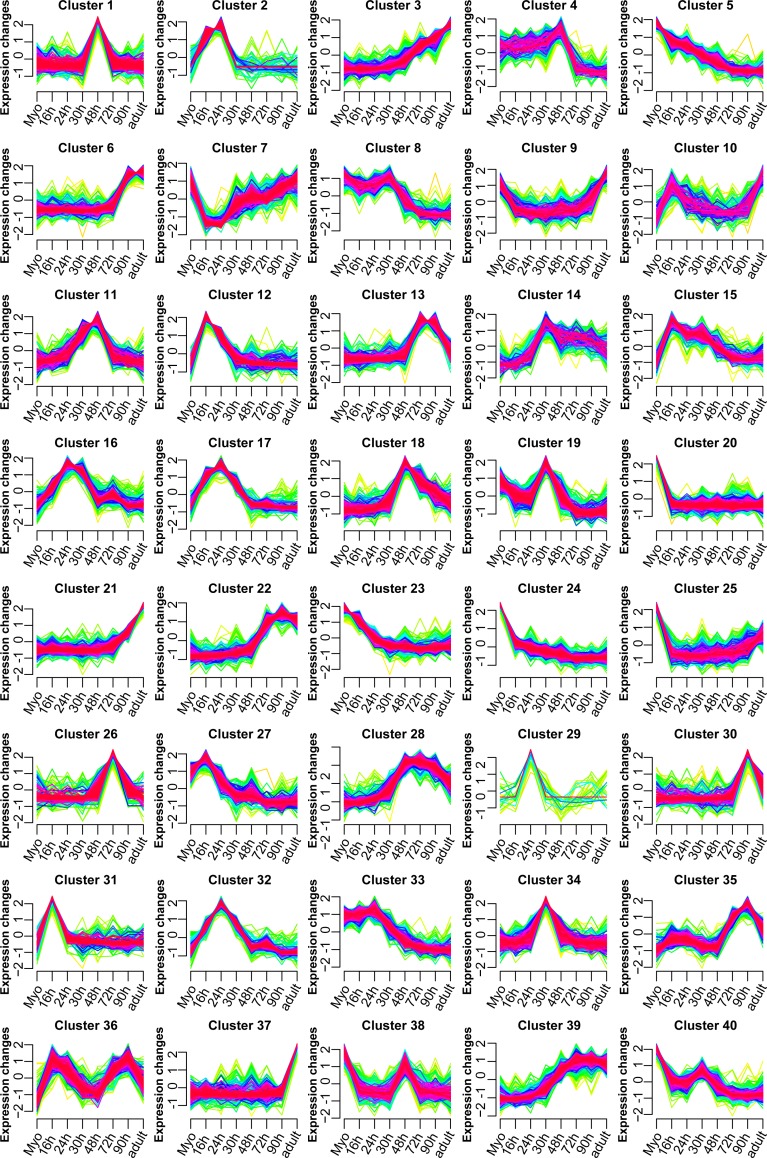
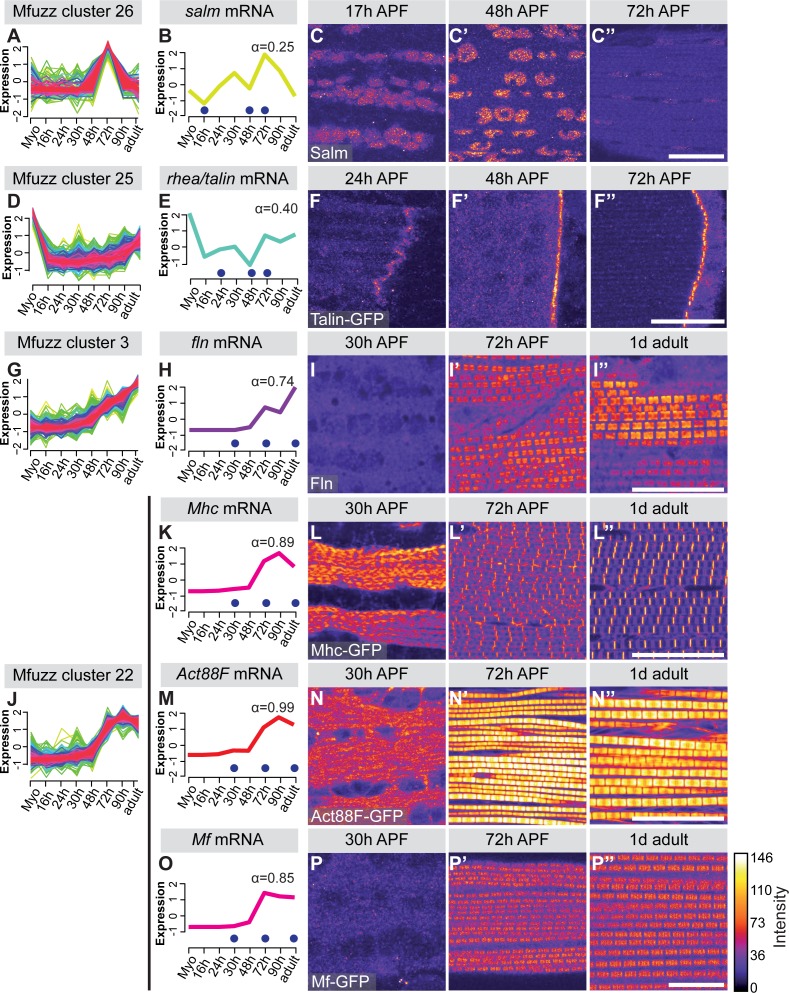
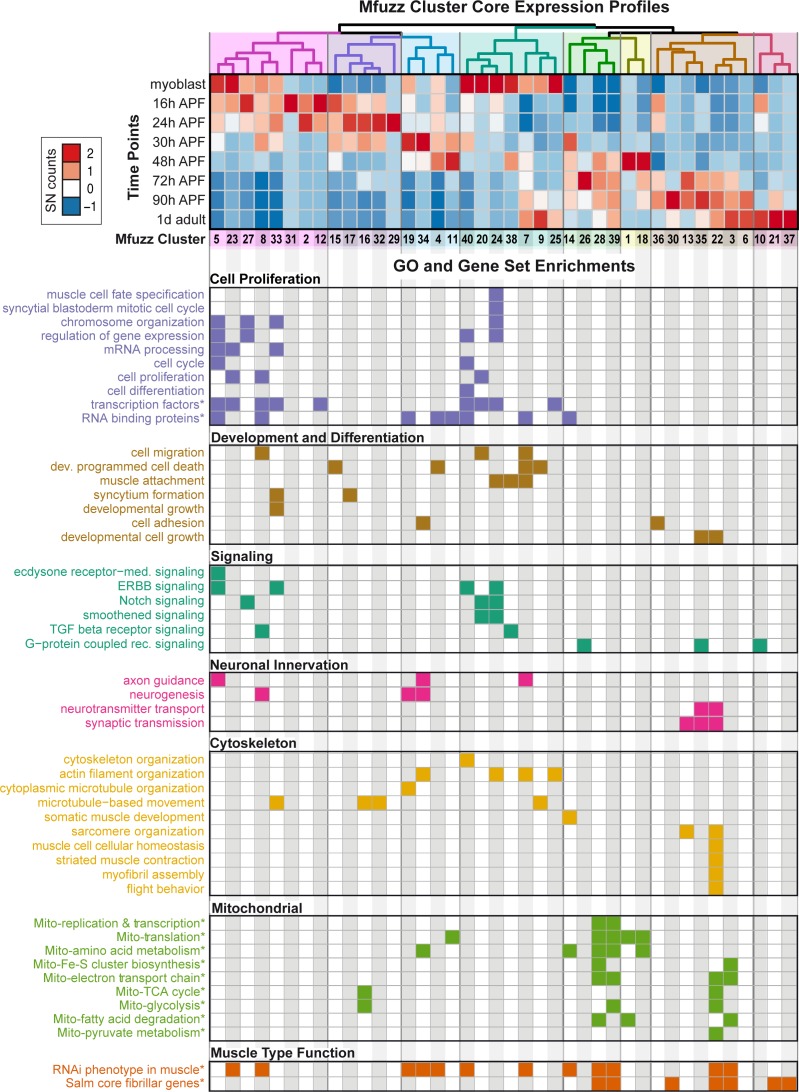
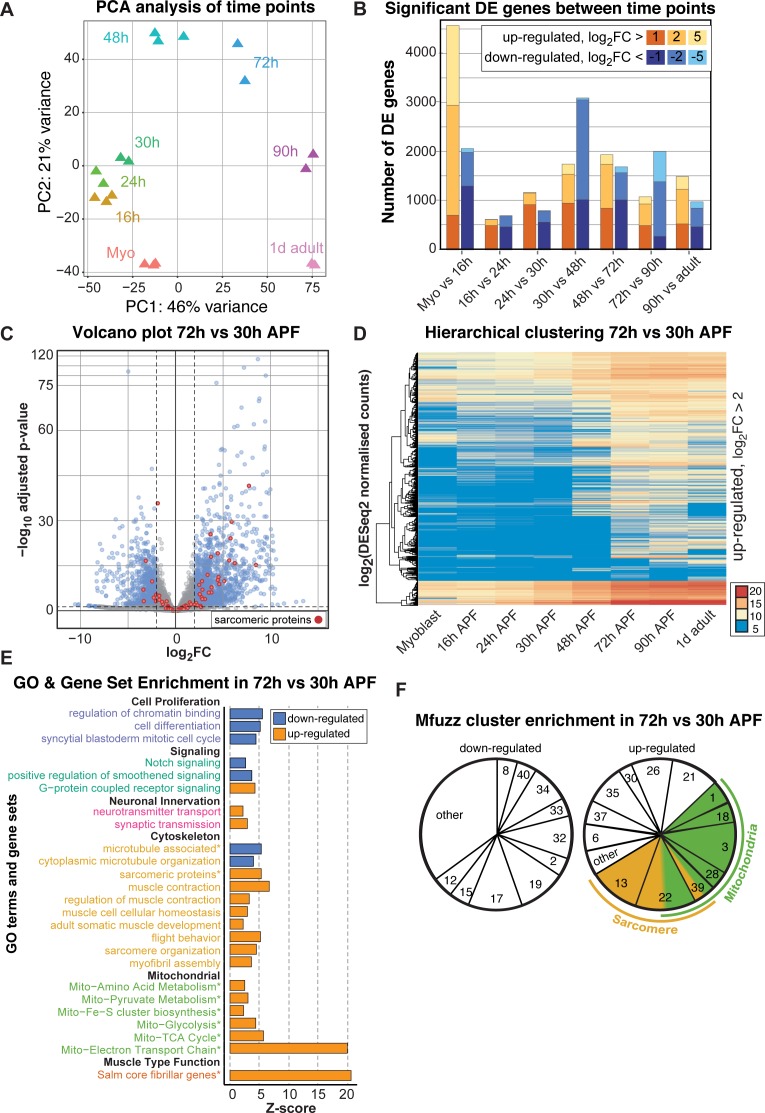
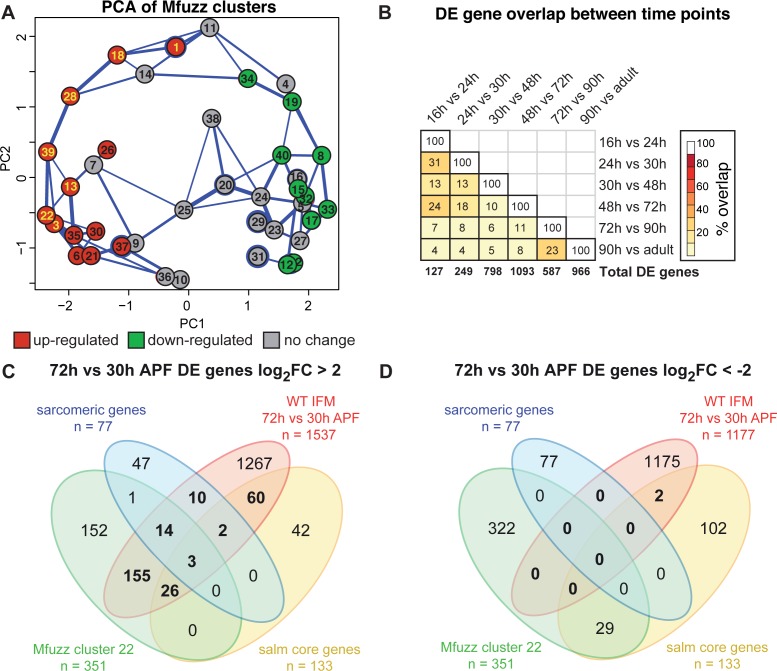
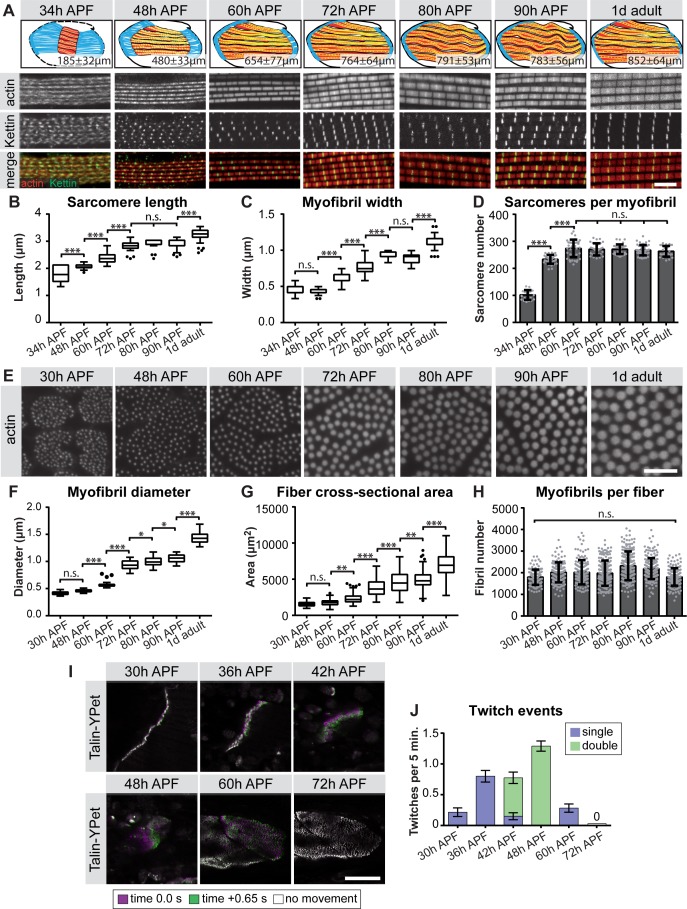
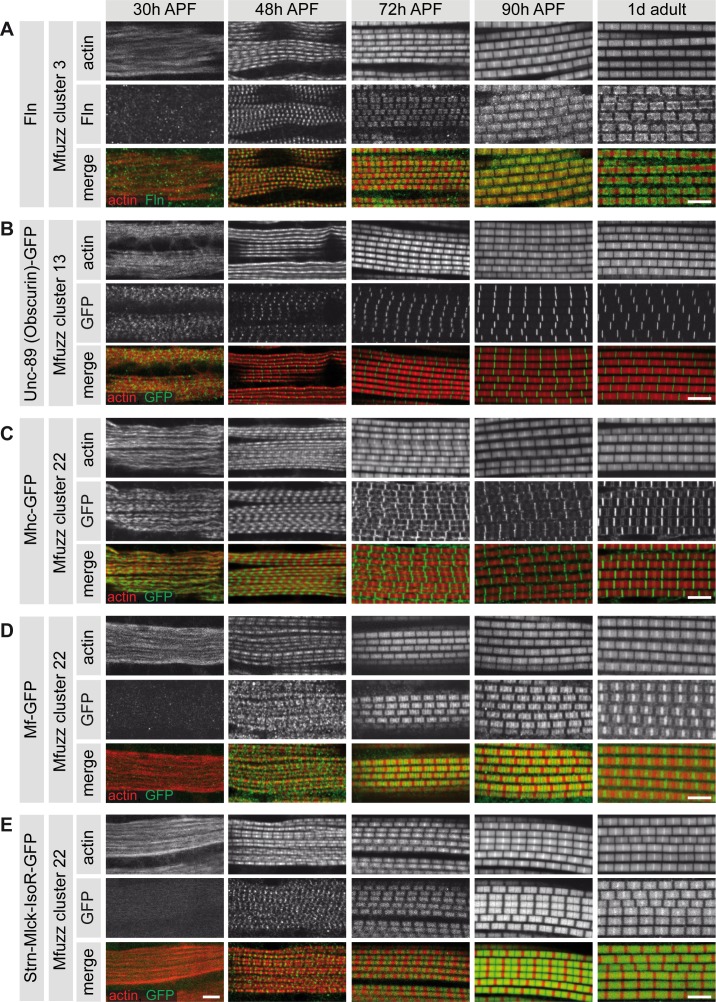
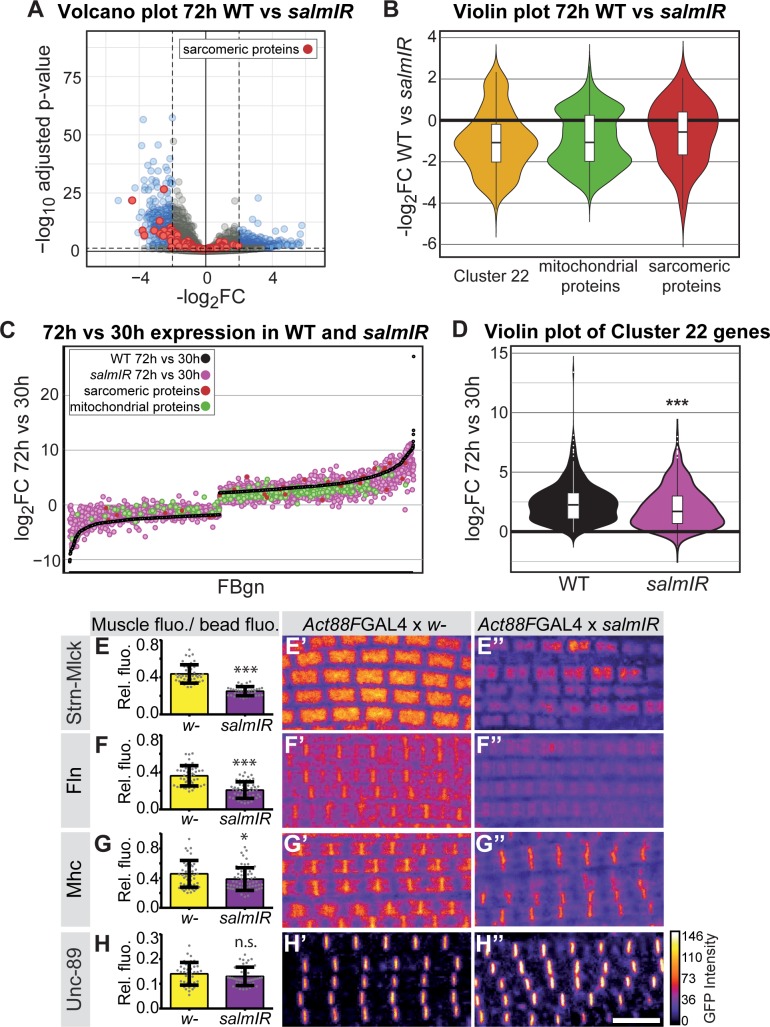
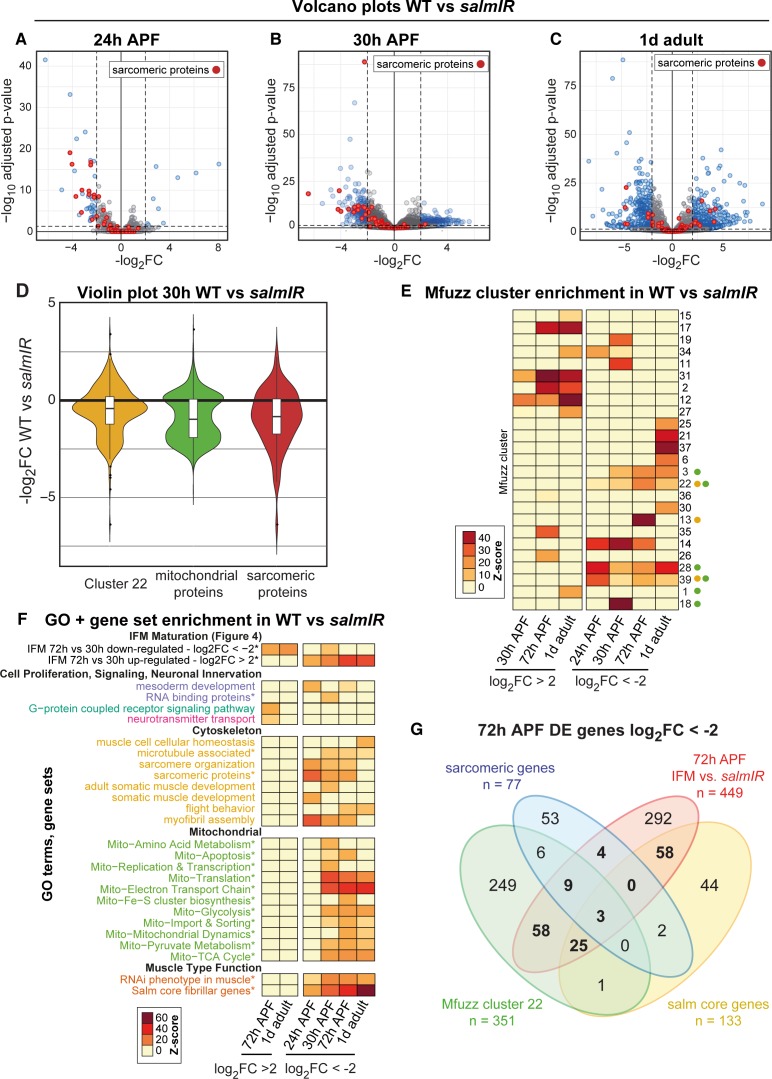
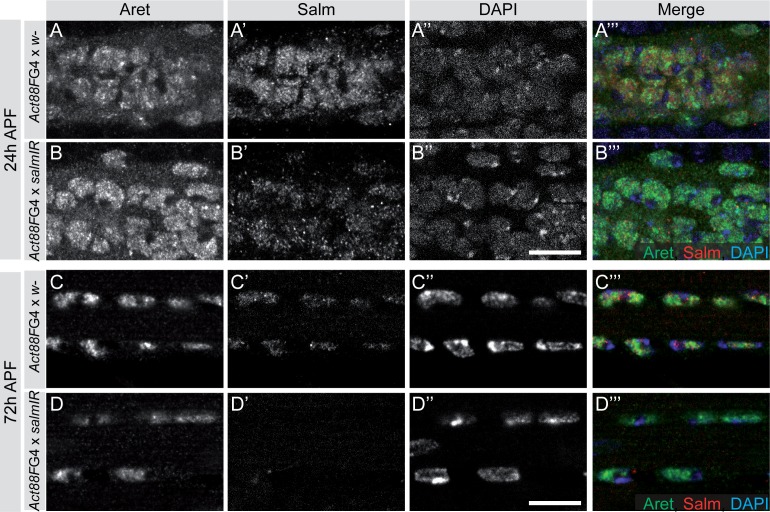
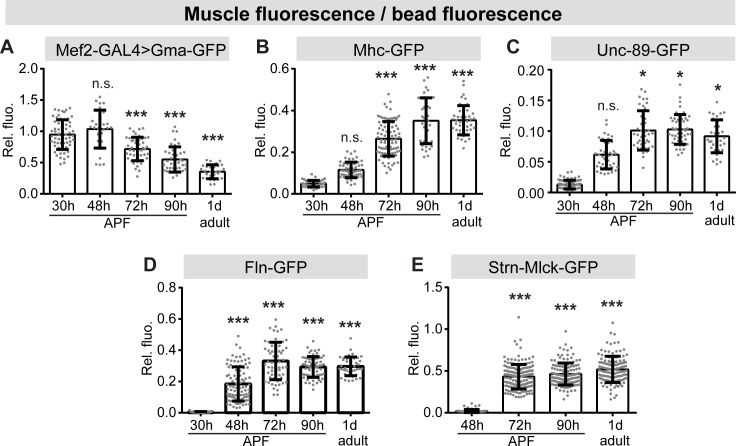
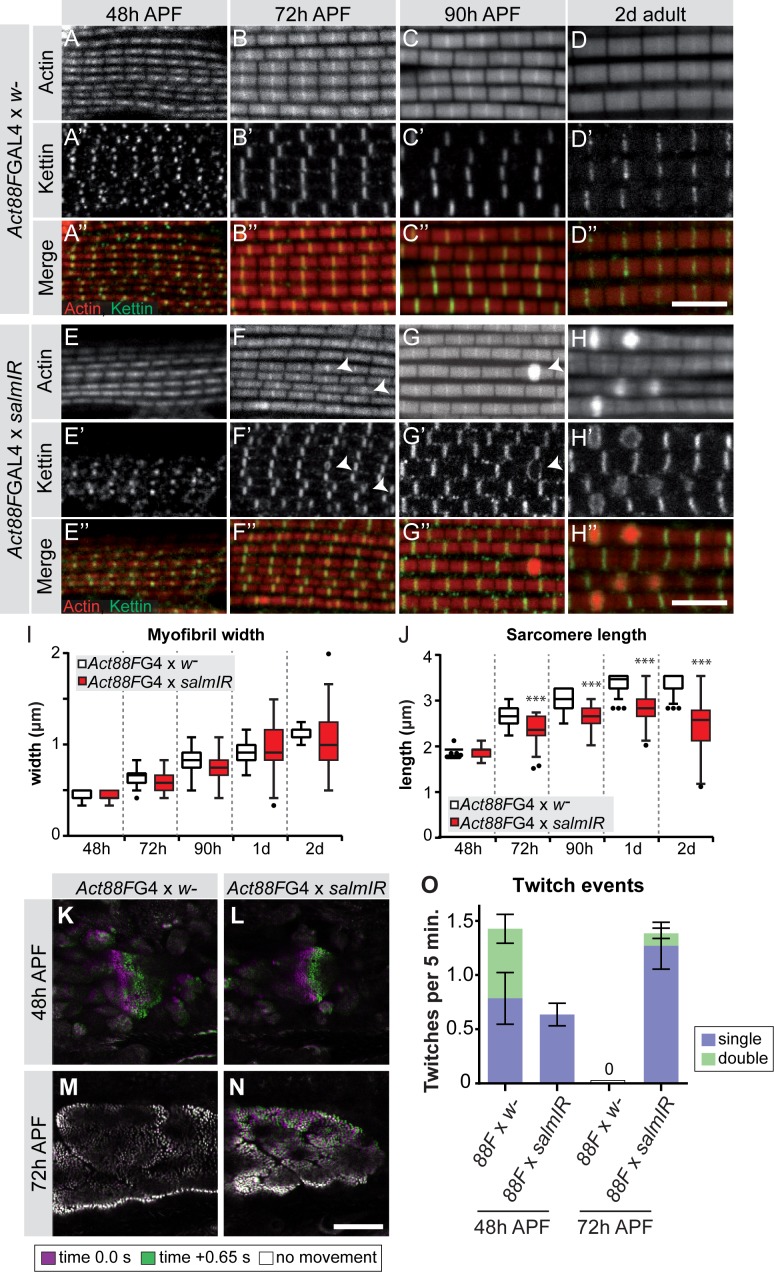
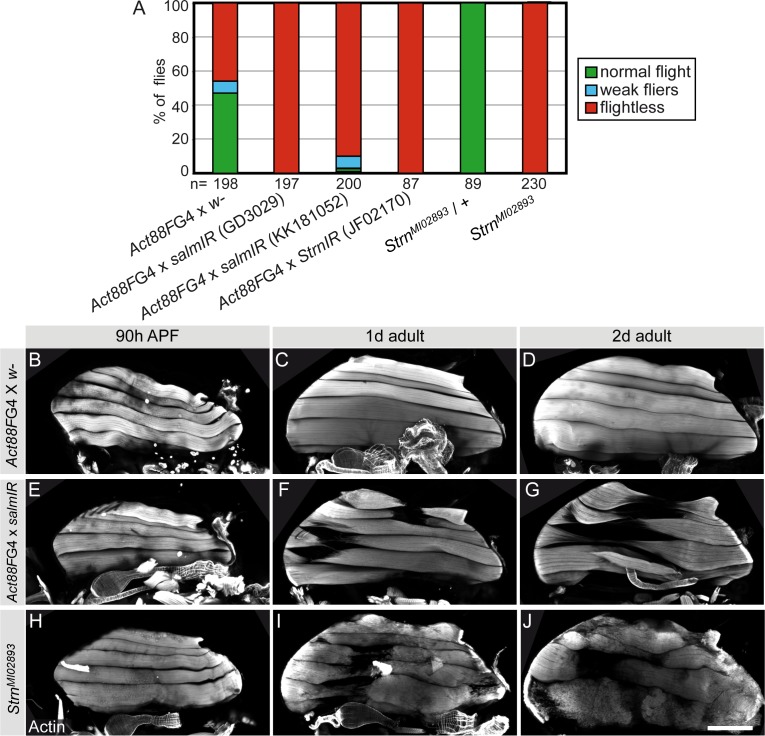
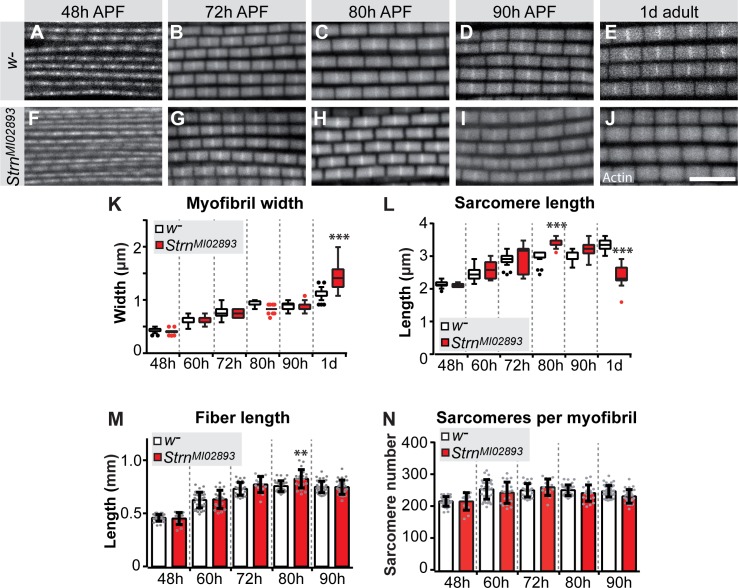
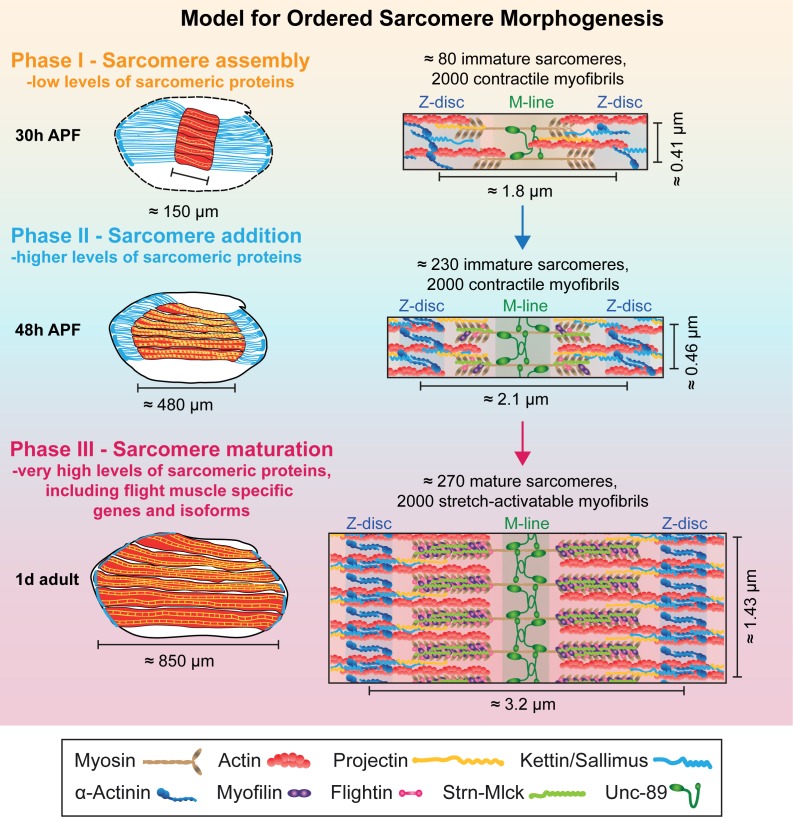
Muscles organise pseudo-crystalline arrays of actin, myosin and titin filaments to build force-producing sarcomeres. To study sarcomerogenesis, we have generated a transcriptomics resource of developing Drosophila flight muscles and identified 40 distinct expression profile clusters. Strikingly, most sarcomeric components group in two clusters, which are strongly induced after all myofibrils have been assembled, indicating a transcriptional transition during myofibrillogenesis. Following myofibril assembly, many short sarcomeres are added to each myofibril. Subsequently, all sarcomeres mature, reaching 1.5 µm diameter and 3.2 µm length and acquiring stretch-sensitivity. The efficient induction of the transcriptional transition during myofibrillogenesis, including the transcriptional boost of sarcomeric components, requires in part the transcriptional regulator Spalt major. As a consequence of Spalt knock-down, sarcomere maturation is defective and fibers fail to gain stretch-sensitivity. Together, this defines an ordered sarcomere morphogenesis process under precise transcriptional control - a concept that may also apply to vertebrate muscle or heart development.

Keywords: D. melanogaster; Sarcomere; biomechanics; cell biology; development; developmental biology; muscle; self organization; stem cells; transcriptomics.


Conflict of interest statement

MS, CB, AY, XZ, SL, AB, EB, GC, KB, BH, FS No competing interests declared

Figures

Figure 1.
Figure 1.. Development of the dorsal longitudinal indirect flight muscles.
(A–H) Time-course of DLM development. (A) Myoblasts adhering to the hinge of the larval wing disc were visualised with Him-GFP-Gma (green), F-actin was stained with phalloidin (red) and nuclei with DAPI (blue). (B–H) Time-course of DLM and myotendinous junction development at 16 hr (B), 24 hr (C), 32 hr (D), 48 hr (E), 56 hr (F), 72 hr (G) and 90 hr APF (H). F-actin was stained with phalloidin (red), Shot (green) and βPS-Integrin (blue). DLMs are highlighted in dashed yellow lines in B an C. (A’’’–C’’’) Scheme of the respective developmental stages with myoblasts and muscles in red, tendon cells in blue and wing disc or pupal thorax outline in black. The length of the muscle fibers in indicated in red. For details see text. Scale bar represents 100 µm. (I) Temporal summary of known events during myogenesis (red). Samples for mRNA-Seq were collected at time points noted in black.
Figure 2.
Figure 2.. Verification of mRNA-Seq time-course by ‘indicator’ gene expression.
(A,D,G,J,M,P,S) Temporal expression dynamics were evaluated by clustering standard-normal mRNA-seq counts using Mfuzz. Temporal expression profiles are plotted with high membership values in warm colours (red, pink), and lower membership values in cool colours (blue, green). (B,E,H,K,N,Q,T) The profile of one ‘indicator’ gene from each cluster is shown and coloured based on the Mfuzz membership value α. (C,F,I,L,O,R,U). Protein expression and localisation dynamics were visualised by antibody staining against Twi (C) and Aret (F) or against GFP for GFP tagged fosmid reporters for Kon (I), β-Tub60D (L), βPS-Integrin (mys) (O), Unc-89 (Obscurin) (R) and Strn-Mlck (U). Images for the same protein were acquired using the same settings, and pseudo-coloured based on intensity. Note the close correlation between mRNA and protein expression dynamics. Time points are indicated by blue dots on the mRNA expression profile. Scale bars represent 20 µm.
Figure 2—figure supplement 1.
Figure 2—figure supplement 1.. Forty distinct temporal mRNA-Seq expression profiles.
Temporal expression profiles were identified by clustering standard-normal mRNA-Seq counts using Mfuzz to group genes with similar temporal expression dynamics. Expression dynamic profiles were labelled 1–40. Each plot shows the profile for each gene in the cluster, with profiles of genes with high membership values in warm colours (red, pink) and lower membership values in cool colours (blue, green).
Figure 2—figure supplement 2.
Figure 2—figure supplement 2.. Additional examples of ‘indicator’ gene expression.
(A–P) Cluster profiles and mRNA dynamics for additional indicator genes. salm from cluster 26 (A,B), rhea (Talin) from cluster 25 (D,E), fln from cluster 3 (G,H) and Mhc, Act88F, Mf from cluster 22 (J,K,M,O) are shown. The respective protein dynamics were visualised with antibodies against the respective protein or GFP fusion protein (C,F,I,L,N,P). Note that although Mhc and Act88F show significant mRNA and protein expression already at 30 hr APF, this expression dramatically increases after 30 hr APF to reach even higher protein levels at 72 hr APF. Fln and Mf mRNA and protein are only induced to high levels after 30 hr APF. Scale bars represent 20 µm.
Figure 3.
Figure 3.. Expression dynamics reveal a temporal ordering of biological processes during muscle morphogenesis.
(Top) Heat map of Mfuzz cluster core expression profiles. Standard-normal count values for all genes with a membership value α >0.8 were averaged to generate the core expression profile for each cluster. Mfuzz expression profiles fall into eight groups (coloured dendrogram leaves) based on hierarchical clustering of their temporal expression dynamics. Time points and Mfuzz clusters are labelled. Colour scale of standard-normal count values ranges from blue (stable/no expression) to red (high expression). (Bottom) GO Biological Process and user-defined gene set (marked with *) enrichments calculated with GO-Elite. Note that proliferation, development and differentiation terms are enriched at early time points, while mitochondrial and sarcomere terms are enriched at late time points. A coloured box indicates a significant enrichment of a given term in the specified cluster (see Supplementary file 2 for details).
Figure 4.
Figure 4.. A major transition in gene expression after 30 hr APF.
(A) DESeq2 principle components analysis (PCA) of all mRNA-Seq libraries. Each triangle represents a different biological replicate coloured by time point. Note that individual replicates for a given time point cluster together. PC1 divides early (≤48 hr APF) from late (≥72 hr) stages. (B) Stacked box plot of the number of significantly differentially expressed genes up-regulated (reds) or down-regulated (blues) between sequential time points with a p-value<0.05 and a log2FC (fold change) of >1 (dark), >2 (medium) or >5 (light). The large differences between myoblast to 16 hr APF reflect muscle specification. A second large shift in expression is evident between 30 and 72 hr APF. (C) Volcano plot illustrating the strong up-regulation of sarcomeric proteins (red) from 30 hr to 72 hr APF. Significantly up- or down-regulated genes are in blue (p-value<0.05 and abs(log2FC)>2). (D) Hierarchical clustering of log2 transformed DESeq2 normalized counts for all genes that are significantly up-regulated between 30 and 72 hr APF. Note that they are either strongly induced at 48 or 72 hr APF (from yellow to red), or only turned on at 48 or 72 hr APF (blue to yellow/red), suggesting a major transition in gene expression after 30 hr APF. Colour scale of log2 count values ranges from blue (not expressed) to red (highly expressed). (E) GO-Elite and user-defined gene set (marked with *) enrichments in up- (red) and down- (blue) regulated genes from 30 hr to 72 hr APF. Note the strong enrichment of mitochondrial and sarcomere terms in the up- regulated genes. (F) Pie charts showing the proportion of genes belonging to an enriched Mfuzz cluster in the sets of genes either up- or down-regulated from 30 hr to 72 hr APF. Note that a large proportion of genes up-regulated 30 hr to 72 hr belong to cluster 22, as well as Mfuzz clusters enriched for sarcomere (yellow) or mitochondrial (green) terms.
Figure 4—figure supplement 1.
Figure 4—figure supplement 1.. Additional evidence supporting a transition in gene expression between 30 and 72 hr APF.
(A) Principle component analysis (PCA) of Mfuzz clusters. PC1 largely separates clusters based on 30 to 72 hr dynamics, with significantly ‘up-regulated’ clusters on the left (red) and ‘down regulated’ clusters on the right (green) (see Figure 4F). Sarcomeric and mitochondrial gene clusters shown in yellow script. (B) Number of differentially expressed (DE) genes that are the same between time points. Total number of DE genes on bottom. Note that sequential time points share the greatest overlap. (C,D) Venn diagrams showing the strong overlap between genes coding for sarcomeric proteins, salm core genes, Mfuzz cluster 22 and genes up-regulated (C) but not down-regulated (D) between 30 and 72 hr APF.
Figure 5.
Figure 5.. Sequential phases of sarcomere morphogenesis in flight muscles.
(A) Scheme of hemi-thoraces at 34, 48, 60, 72, 80, 90 hr APF and 1 day adults (muscle in red, tendon in blue, sarcomeres in yellow) with indicated muscle fiber length. Myofibrils and sarcomeres at these time points were stained for phalloidin (F-actin, red) and Kettin (Z-disc, green). Scale bar represents 5 µm. (B,C) Tukey box and whisker plot of sarcomere length and myofibril width. Box extends from 25 to 75%, line marks median, whiskers extend to 25/75% plus 1.5 times the interquartile range. (D) Histogram of sarcomere number per myofibril. Error bars represent SD. Note the sarcomere assembly at 34 hr, followed by sarcomere addition until ~48 hr and sarcomere maturation after ~48 hr APF. (E) Cross-sections of the DLMs at 30, 48, 60, 72, 80, 90 hr APF and 1 day adult. Scale bar represents 5 µm. (F,G) Tukey box and whisker plot of myofibril diameter and myofiber cross-sectional area. Note the lack of growth in diameter or area from 30 hr to 48 hr. (H) Histogram of the number of myofibrils per myofiber. Error bars represent SD. Note that all myofibrils are already present at 30 hr APF. Tukey’s multiple comparison p-value<0.05*,. 01**,. 001***, n.s. = not significant. N > 10 for each individual time point. (I) Stills of live movies of DLMs at 30, 36, 42, 48, 60 and 72 hr APF. Scale bar represents 50 µm. For live movies see Figure 5—video 1. Stills are a time 0.0 s image (magenta) overlaid with a time +0.65 s image (green), where a perfect overlap (white) shows no movement. (J) Quantification of spontaneous contraction events per fiber per 5 min, with single twitches in blue and double twitches in green. Fibers are first contractile at 30 hr APF, reach peak contractility at 48 hr and stop all spontaneous contraction shortly after 60 hr APF.
Figure 5—figure supplement 1.
Figure 5—figure supplement 1.. Expression and localisation of thin- and thick-filament structural proteins.
(A–E) Developing flight muscle myofibrils are stained with phalloidin (red) and the respective sarcomeric proteins (green). Flightin (A) cannot be detected at 30 hr, but decorates the thick filament from 48 hr APF. Unc-89/Obscurin-GFP (B) labels the M-line from 30 hr, and is markedly refined to 72 hr APF. Myosin heavy chain (C) is visible in a regular pattern at 30 hr APF. Myofilin/Mf (D) cannot be detected at 30 hr and decorates the thick filament at 48 hr APF. Likewise, IFM-specific Strn-Mlck Isoform R (E) is not expressed at 30 hr, but is detected on the thick filament at low levels at 48 hr APF. Scale bars represent 5 µm.
Figure 6.
Figure 6.. salm contributes to the transition in gene expression after 30 hr APF.
(A) Volcano plot of mRNA-Seq comparison of wild-type (WT) versus salmIR IFMs at 72 hr APF. Note the significant down-regulation of genes in salmIR, especially sarcomeric protein coding genes (red). Significantly differentially expressed (DE) genes (abs(log2 FC)>2, p<0.05) are in blue. (B) Violin plot showing down-regulation of sarcomeric proteins (in red), mitochondrial proteins (in green) and members of Mfuzz cluster 22 (in yellow) in salmIR compared to wild type at 72 hr APF. Box plots indicate the median of the data as well as the first and third quartile in the box, outliers are the dots. (C) WT mRNA-Seq fold change values of all genes significantly DE from 30 hr to 72 hr APF are ordered from lowest to highest (black). The corresponding salmIR fold change is shown in yellow. Both sarcomeric (red) and mitochondrial protein coding genes (blue) are less strongly up- or down-regulated in salmIR across the 30 hr to 72 hr APF transition. Note that many genes in salmIR (yellow dots) are not as strongly induced or even repressed compared to WT (below and above the black WT line, respectively). (D) Violin plot comparing the log2FC over the 30 hr to 72 hr transition in WT (in black) and salmIR IFM (in magenta) for members of Mfuzz Cluster22. Box plots indicate the median of the data as well as the first and third quartile in the box, outliers are the dots. Note the significant decrease in induction to 72 hr APF in the salmIR sample. ***Student’s t-test p-value<0.0005. (E–H) salm is required for the induction of some but not all sarcomeric proteins. Act88F >> salmIR in the background of GFP-tagged Strn-Mlck-IsoR (E), Fln (F), Mhc (G) and Unc-89 (H). Quantitative changes in live GFP fluorescence at 90 hr APF were measured by quantitative confocal microscopy relative to standard fluorescent beads, revealing significant decreases in induction for Strn-Mlck, Fln and Mhc between wild type control (shown in yellow, Act88F-GAL4 crossed to w1118) and Act88F >> salmIR (shown in purple). Scale bar represents 5 µm. Error bars represent SEM, Student’s t-test p-value<0.05*, 0.001***, n.s. = not significant. N > 10 for each individual sample. (E’–H’’) Intensity-coded GFP fluorescence at 90 hr APF in confocal images of fixed myofibrils.
Figure 6—figure supplement 1.
Figure 6—figure supplement 1.. salm regulates gene expression during flight muscle development.
(A–C) Volcano plots of mRNA-Seq data comparing wild-type (WT) versus salmIR IFMs at 24 hr (A), 30 hr (B) and 1d adult. Significantly differentially expressed (DE) genes (abs(log2FC)>2, p<0.05) are in blue. Note the significant down regulation of genes at all time points, particularly sarcomeric protein coding genes (red). (D) Violin plot showing down-regulation of sarcomeric proteins (in red), mitochondrial proteins (in green) and members of Mfuzz cluster 22 (in yellow) in salmIR compared to wild type at 30 hr APF. Box plots indicate the median of the data as well as the first and third quartile in the box, outliers are the dots. Note that all three gene groups are down-regulated in in salmIR. (E) Mfuzz cluster enrichment in genes that are DE between WT and salmIR. Note that the sarcomeric and mitochondrial clusters (indicated by the green and yellow dots, respectively) are all down-regulated in salmIR. Colour scale represents enrichment Z-score. (F) GO and gene set (marked with *) enrichment in genes that are DE between WT and salmIR. Note that terms down-regulated in salmIR are enriched in genes up-regulated in WT from 30 hr to 72 hr. (G) Venn diagram showing the strong overlap between sarcomeric protein coding genes, salm core genes, Mfuzz cluster 22 and genes down-regulated in salmIR at 72 hr APF.
Figure 6—figure supplement 2.
Figure 6—figure supplement 2.. Act88F-GAL4 driven knock-down of salm is efficient.
(A–D) At 24 hr APF, both Aret and Salm expression is observed in the nuclei of wild type (A) and Act88F >> salmIR (B) DLMs. At 72 hr APF, Salm protein is present in wild type (C) but cannot be detected in the nuclei of Act88F >> salmIR (D) DLMs. Scale bars represent 10 µm.
Figure 6—figure supplement 3.
Figure 6—figure supplement 3.. Expression of sarcomere proteins strongly increases from 30 hr to 72 hr APF.
(A–E) Live assay to quantify GFP fusion protein expression by normalizing GFP expression intensity in muscle to fluorescent beads (relative fluorescence on Y-axis). Gma-GFP expression driven by Mef2-GAL4 (A) shows a decrease in expression with developmental time, likely due to a decrease in expression from the Mef2 enhancer. Mhc-GFP (B) and Unc-89-GFP (C) show detectable GFP expression at 30 hr APF, but a massive increase in expression to 72 hr APF. Fln-GFP (D) is not detectable at 30 hr APF and increases expression from 48 hr APF to 72 hr APF. Strn-Mlck-GFP (E) is weakly detectable at 48 hr APF and is massively induced to 72 hr APF. Relative fluorescence was calculated as muscle intensity/bead intensity. Error bars represent SEM, Tukey’s multiple comparison p-value<0.05*, 0.001***, n.s. = not significant. N > 10 flies for each timepoint.
Figure 7.
Figure 7.. salm is required for normal sarcomere maturation and function.
(A–H) Myofibrils of Act88F-GAL4 / + (A–D) or Act88F >> salmIR (E–H). Note that salmIR DLM remains fibrillar and appears normal at 48 hr APF (E), but at 72 hr APF (F) 90 hr APF (G) and 2 day adult (H) Z-discs widen and show actin accumulations (arrowheads). (I,J) Tukey box and whisker plot of myofibril width (I) and sarcomere length (J) in Act88F-GAL4 /+ and Act88F >> salmIR (red). Tukey’s multiple comparison p-value<0.001***. N > 10 for each individual time point. Scale bars represent 5 µm. (K–O) Stills from live movies of developing DLMs at 48 and 72 hr APF in Act88F-GAL4 / + (K, M) and Act88F >> salmIR (L, N). Scale bar represents 50 µm. Coloured as in Figure 5. (O) Quantification of spontaneous contraction events per fiber per 5 min, with single twitches in blue and double twitches in green. Error bars represent SEM. salmIR fibers continue spontaneously contracting at 72 hr APF.
Figure 7—figure supplement 1.
Figure 7—figure supplement 1.. Act88F >> salmIR and Strn-Mlck mutant flies are flightless and IFM fibers rupture in adult flies.
(A) Adult males from Act88F-GAL4 crossed to two independent salmIR hairpins as well as StrnM102893 are flightless. (B–J) At 90 hr APF, Act88F-GAL4 / + (B–D), Act88F >> salmIR (E–G) and StrnM102893 (H–J) all have six intact fibers. At 1 day and 2 days after eclosion, both Act88F >> salmIR (F,G) and StrnM102893 (I,J) show muscle tearing and atrophy. Scale bar represents 200 µm.
Figure 8.
Figure 8.. Strn-Mlck contributes to sarcomere length regulation during sarcomere maturation.
(A–J) Wild type (A–E) and StrnM102893 mutant (F–J) sarcomere development at 48, 72, 80, 90 hr APF and 1 day adult. (K–N) Tukey box and whisker plot of myofibril width (K) and sarcomere length (L) in wild type and StrnM102893 mutant (red). Tukey’s multiple comparison p-value<0.001***. N > 10 for each individual time point. Histogram of fiber length (M) and number of sarcomeres per myofibril (N). Error bars represent SEM. Tukey’s multiple comparison p-value<0.01**, N > 10 for each individual time point. Note that a normal number of sarcomeres are formed in StrnM102893 mutants, but they grow too long at 80 hr APF and hyper-contract in 1 day adult.
Figure 9.
Figure 9.. Model for ordered sarcomere morphogenesis.
Phase 1 - Sarcomere assembly: Sarcomeric proteins are expressed at low levels, enabling the self-assembly of immature sarcomeres and myofibrils at around 30 hr APF. Each of the 2000 myofibrils contains about 80 immature sarcomeres. Phase 2 - Sarcomere addition: Sarcomere protein expression increases and each immature myofibril incorporates many new sarcomeres until about 48 hr APF. These immature sarcomeres contract spontaneously. Phase 3 - Sarcomere maturation: After 48 hr APF, sarcomere protein expression increases even more, including flight muscle specific proteins/isoforms, and all sarcomeres strongly grow in width and length. This enables the flight muscle to gain stretch-activation. Muscles are shown in red, tendons in blue. Structural proteins are illustrated as cartoons and are not drawn to scale. Induction of Actin, Mhc, Myofilin, Flightin, Strn-Mlck and Unc-89/Obscurin is shown here, expression of αActinin, Projectin and Kettin/Sallimus was shown by others (Bullard et al., 2006; Burkart et al., 2007; Katzemich et al., 2013; Orfanos et al., 2015; Weitkunat et al., 2014).

References

    1. Anant S, Roy S, VijayRaghavan K. Twist and notch negatively regulate adult muscle differentiation in Drosophila. Development. 1998;125:1361–1369. - PubMed
    1. Asano T, Ishizuka T, Morishima K, Yawo H. Optogenetic induction of contractile ability in immature C2C12 myotubes. Scientific Reports. 2015;5:8317. doi: 10.1038/srep08317. - DOI - PMC - PubMed
    1. Bate M, Rushton E, Currie DA. Cells with persistent twist expression are the embryonic precursors of adult muscles in Drosophila. Development. 1991;113:79–89. - PubMed
    1. Brinegar AE, Xia Z, Loehr JA, Li W, Rodney GG, Cooper TA. Extensive alternative splicing transitions during postnatal skeletal muscle development are required for calcium handling functions. eLife. 2017;6:e27192. doi: 10.7554/eLife.27192. - DOI - PMC - PubMed
    1. Bryantsev AL, Baker PW, Lovato TL, Jaramillo MS, Cripps RM. Differential requirements for myocyte enhancer Factor-2 during adult myogenesis in Drosophila. Developmental Biology. 2012;361:191–207. doi: 10.1016/j.ydbio.2011.09.031. - DOI - PMC - PubMed

Publication types