. 2018 May 30:7:e34408.
doi: 10.7554/eLife.34408.

The MR-Base platform supports systematic causal inference across the human phenome

Affiliations

The MR-Base platform supports systematic causal inference across the human phenome

Gibran Hemani et al. Elife. .

Abstract

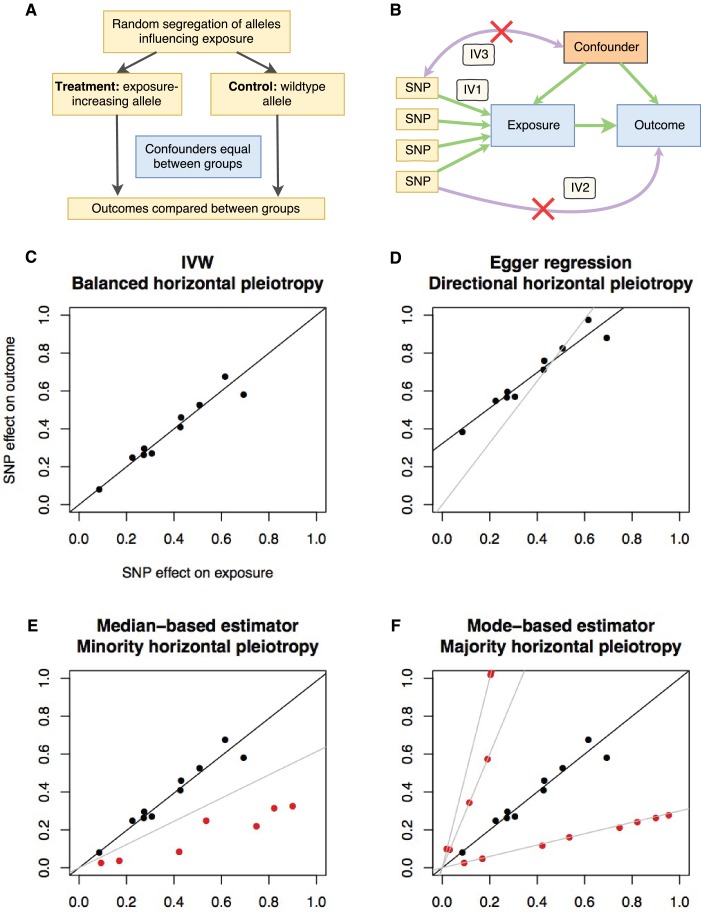
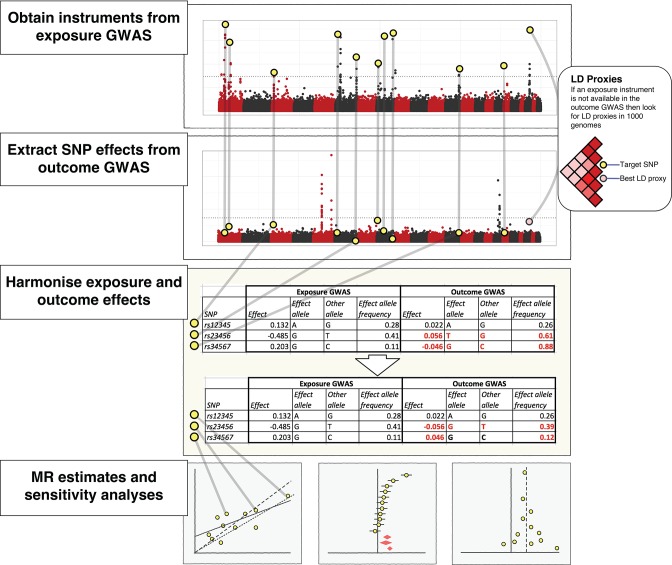
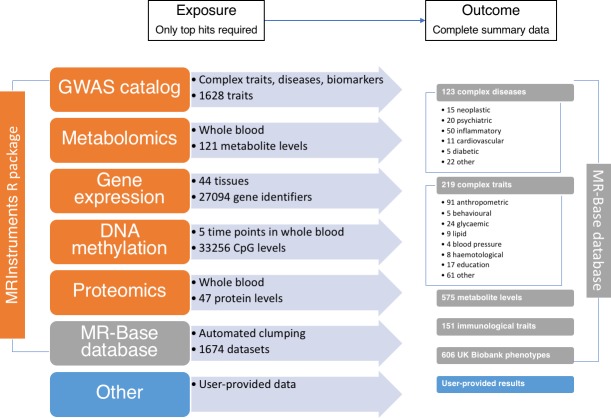
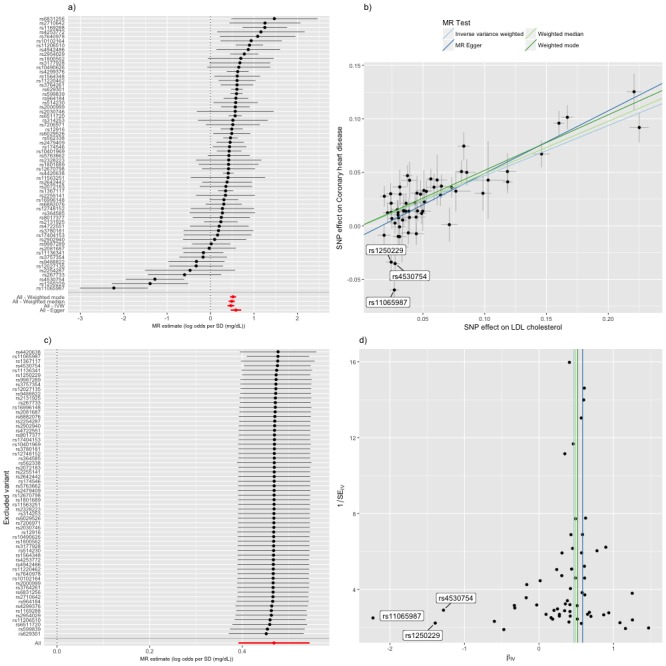
Results from genome-wide association studies (GWAS) can be used to infer causal relationships between phenotypes, using a strategy known as 2-sample Mendelian randomization (2SMR) and bypassing the need for individual-level data. However, 2SMR methods are evolving rapidly and GWAS results are often insufficiently curated, undermining efficient implementation of the approach. We therefore developed MR-Base (<ext-link ext-link-type="uri" xlink:href="http://www.mrbase.org">http://www.mrbase.org</ext-link>): a platform that integrates a curated database of complete GWAS results (no restrictions according to statistical significance) with an application programming interface, web app and R packages that automate 2SMR. The software includes several sensitivity analyses for assessing the impact of horizontal pleiotropy and other violations of assumptions. The database currently comprises 11 billion single nucleotide polymorphism-trait associations from 1673 GWAS and is updated on a regular basis. Integrating data with software ensures more rigorous application of hypothesis-driven analyses and allows millions of potential causal relationships to be efficiently evaluated in phenome-wide association studies.

Keywords: GWAS; Mendelian randomization; causal inference; computational biology; human; human biology; medicine; systems biology.


Conflict of interest statement

GH, JZ, BE, KW, VH, DB, CL, SB, JB, RL, VT, JY, HS, NT, DE, CR, RM, GD, TG, PH No competing interests declared

Figures

Figure 1.
Figure 1.. Principles and assumptions behind Mendelian randomization.
(A) Diagram illustrating the analogy between Mendelian randomization (MR) and a randomised controlled trial. (B) A directed acyclic graph representing the MR framework. Instrumental variable (IV) assumption 1: the instruments must be associated with the exposure; IV assumption 2: the instruments must influence the outcome only through the exposure; IV assumption 3: the instruments must not associate with measured or unmeasured confounders. (C-F) Scatter plots demonstrating the relationship between the instrumental single nucleotide polymorphism (SNP) effects on the exposure against their corresponding effects on the outcome. The slope of the regression is the estimate of the causal effect of the exposure on the outcome. (C) If there is no violation of the IV2 assumption (no horizontal pleiotropy), or the horizontal pleiotropy is balanced, an unbiased causal estimate can be obtained by inverse-variance weighted (IVW) linear regression, where the contribution of each instrumental SNP to the overall effect is weighted by the inverse of the variance of the SNP-outcome effect. Fixed and random effects IVW approaches are available (the slopes from both approaches are identical but the variance of the slope is inflated in the random effects model in the presence of heterogeneity between SNPs). (D) If there is a tendency for the horizontal pleiotropic effect to be in a particular direction, then constraining the slope to go through zero will incur bias (grey line). Egger regression relaxes this constraint by allowing the intercept to pass through a value other than zero, returning an unbiased effect estimate if the instrument-exposure and pleiotropic effects are uncorrelated, also known as the InSIDE (Instrument Strength Independent of Direct Effect) assumption (Bowden et al., 2015). Pleiotropic effect here refers to the effect of the instrument on the outcome that is not mediated by the exposure. (E) If the majority of the instruments are valid (black points), with some invalid instruments (red points), the median based approach will provide an unbiased estimate in the presence of unbalanced horizontal pleiotropy (black line), whereas IVW linear regression will provide a biased estimate (grey line). In addition, the median-based estimator does not require the InSIDE assumption of the Egger approach. (F) If a group of SNPs influences the outcome through a particular pathway other than the exposure (i.e. the SNPs are horizontally pleiotropic) then that group of SNPs will return consistently biased estimates. Clustering SNPs based on their estimates (grey lines) is possible with the mode-based estimator. The cluster with the largest weight (black line) is selected as the final causal estimate. The causal estimate from the mode-based estimator is unbiased if the SNPs contributing to the largest cluster are valid instruments.
Figure 2.
Figure 2.. The practical steps for performing 2-sample Mendelian randomization (2SMR), as described in the Model section of the paper.
The database of genome-wide association study results and R packages (‘TwoSampleMR’ and ‘MRInstruments’) curated by MR-Base support the data extraction, harmonisation and analysis steps required for 2SMR. Additional R packages for MR from other researchers are also accessible, including MendelianRandomization (Yavorska and Burgess, 2017), RadialMR ( Bowden et al., 2017b), MR-PRESSO (Verbanck et al., 2018) and mr.raps (Zhao et al., 2018). The available methods are updated on a regular basis.
Figure 3.
Figure 3.. The data available through MR-Base and the possible exposure-outcome analyses that can be performed.
Exposure traits can very broadly defined and may include molecular traits like gene expression, DNA-methylation, metabolites and proteins, as well as more complex traits, including cholesterol, body mass index, smoking and education. Further details on the traits with complete summary data can be found in Supplementary file 1A. The numbers reflect MR-Base in December 2017 and are updated on a regular basis.
Figure 4.
Figure 4.. Mendelian randomization study of the effect of low density lipoprotein cholesterol levels on coronary heart disease.
(a) A forest plot, where each black point represents the log odds ratio (OR) for coronary heart disease (CHD) per standard deviation (SD) increase in low density lipoprotein (LDL) cholesterol, produced using each of the ‘LDL single nucleotide polymorphisms (SNPs)’ as separate instruments, and red points showing the combined causal estimate using all SNPs together in a single instrument, using each of four different methods (weighted median, weighted mode, inverse-variance weighted [IVW] random effects and MR-Egger). Horizontal lines denote 95% confidence intervals. (b) A plot relating the effect sizes of the SNP-LDL association (x-axis, SD units) and the SNP-CHD associations (y-axis, log OR) with standard error bars. The slopes of the lines correspond to causal estimates using each of the four different methods. Outlier SNPs are labeled. (c) Leave-one-out sensitivity analysis. Each black point represents the IVW MR method applied to estimate the causal effect of LDL on CHD excluding that particular variant from the analysis. The red point depicts the IVW estimate using all SNPs. There are no instances where the exclusion of one particular SNP leads to dramatic changes in the overall result. (d) Funnel plot showing the relationship between the causal effect of LDL on CHD estimated using each individual SNP as a separate instrument against the inverse of the standard error of the causal estimate. Vertical lines show the causal estimates using all SNPs combined into a single instrument for each of four different methods. There is some asymmetry in the plot (an excess of strong protective effects associated with higher LDL cholesterol), which is potentially indicative of violations of instrumental variable (IV) assumptions, e.g. violation of the IV2 assumption through horizontal pleiotropy. Outlier SNPs are labeled.
Figure 5.
Figure 5.. Effect of lower low density lipoprotein cholesterol on 150 traits in MR-Base.
The x-axis shows the standard deviation (SD) change or log odds ratio (OR) for each of 150 traits per SD decrease in low density lipoprotein (LDL) cholesterol. The y-axis shows the p-value for the association on a -log10 scale. The effects on the x-axis correspond to the slope from fixed effects inverse variance weighted (IVW) linear regression of single nucleotide polymorphism (SNP)-outcome effects regressed on the SNP-LDL effects. Those results that have a p-value<0.05 are labelled. Larger points denote false discovery rate (FDR) < 0.05. LDL cholesterol was instrumented by 62 SNPs.

References

    1. 1000 Genomes Project Consortium. Auton A, Brooks LD, Durbin RM, Garrison EP, Kang HM, Korbel JO, Marchini JL, McCarthy S, McVean GA, Abecasis GR. A global reference for human genetic variation. Nature. 2015;526:68–74. doi: 10.1038/nature15393. - DOI - PMC - PubMed
    1. Angrist JD, Krueger AB. Estimating the Payoff to Schooling Using the Vietnam-Era Draft Lottery. [February 1, 2018];1992 www.nber.org/papers/w4067
    1. Angrist JD, Krueger AB. Split-sample instrumental variables estimates of the return to schooling. Journal of Business & Economic Statistics. 1995;13:225–235.
    1. Beck T, Hastings RK, Gollapudi S, Free RC, Brookes AJ. GWAS Central: a comprehensive resource for the comparison and interrogation of genome-wide association studies. European Journal of Human Genetics. 2014;22:949–952. doi: 10.1038/ejhg.2013.274. - DOI - PMC - PubMed
    1. Benner C, Spencer CC, Havulinna AS, Salomaa V, Ripatti S, Pirinen M. FINEMAP: efficient variable selection using summary data from genome-wide association studies. Bioinformatics. 2016;32:1493–1501. doi: 10.1093/bioinformatics/btw018. - DOI - PMC - PubMed

Publication types

Substances