

Clinical Correlations of Transcriptional Profile in Patients Infected With Avian Influenza H7N9 Virus
- PMID: 29846612
- PMCID: PMC6129114
- DOI: 10.1093/infdis/jiy317
Clinical Correlations of Transcriptional Profile in Patients Infected With Avian Influenza H7N9 Virus
Abstract
Background: Avian influenza A (H7N9) viruses emerged in China in 2013 and caused zoonotic disease associated with a case-fatality ratio of over 30%. Transcriptional profiles in peripheral blood reflect host responses and can help to elucidate disease pathogenesis.
Methods: We correlated serial blood transcriptomic profiles of patients with avian influenza A (H7N9) virus infection and determined the biological significances from the analysis.
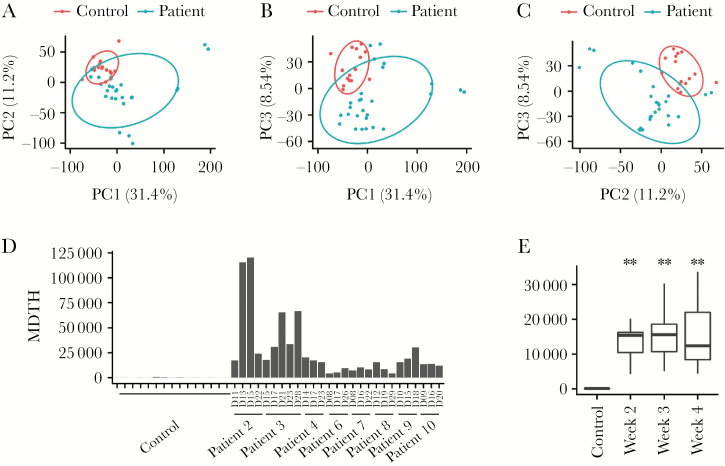
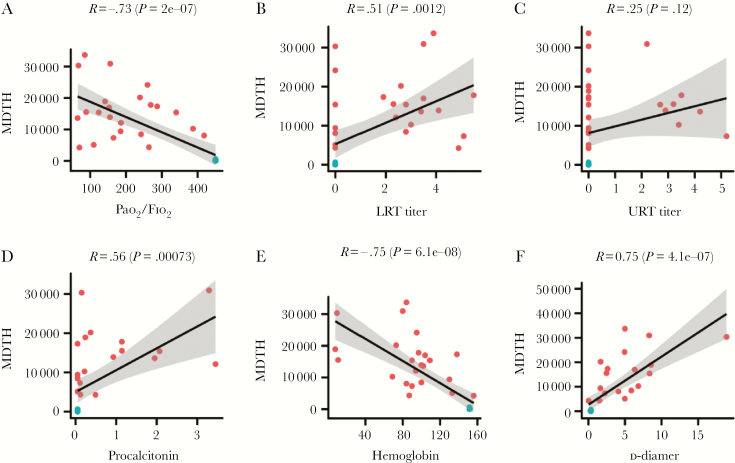
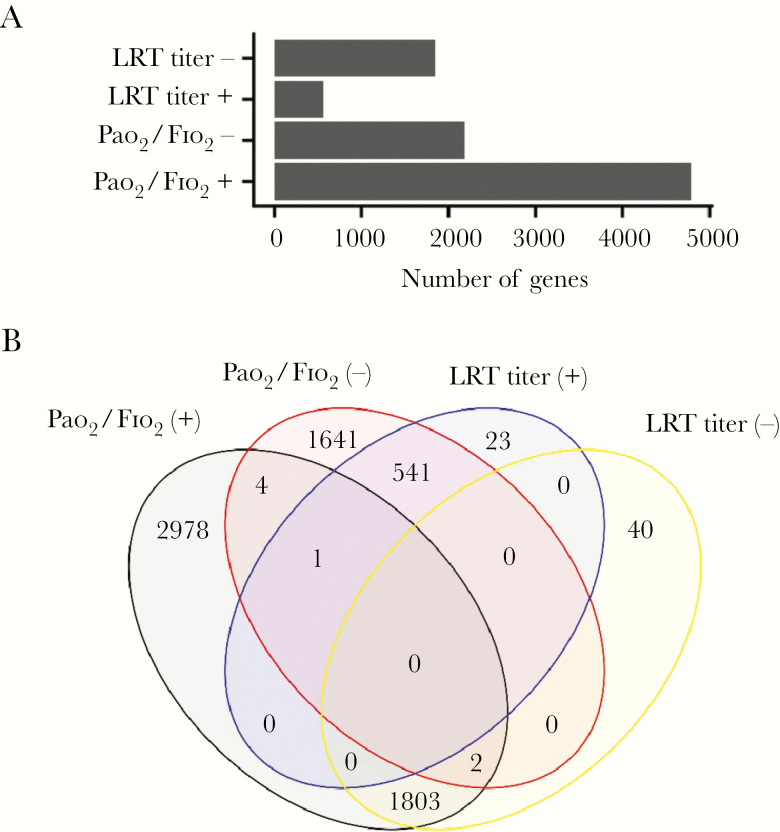
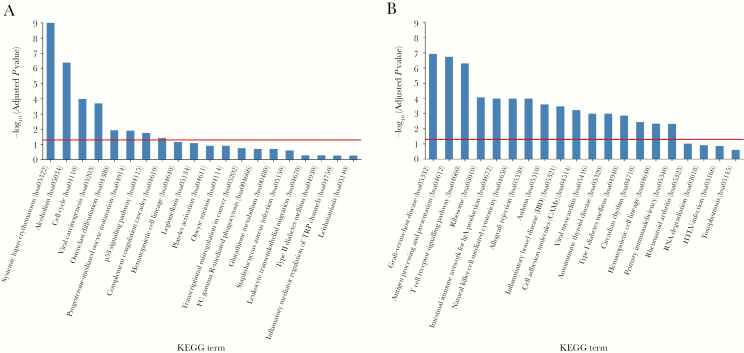
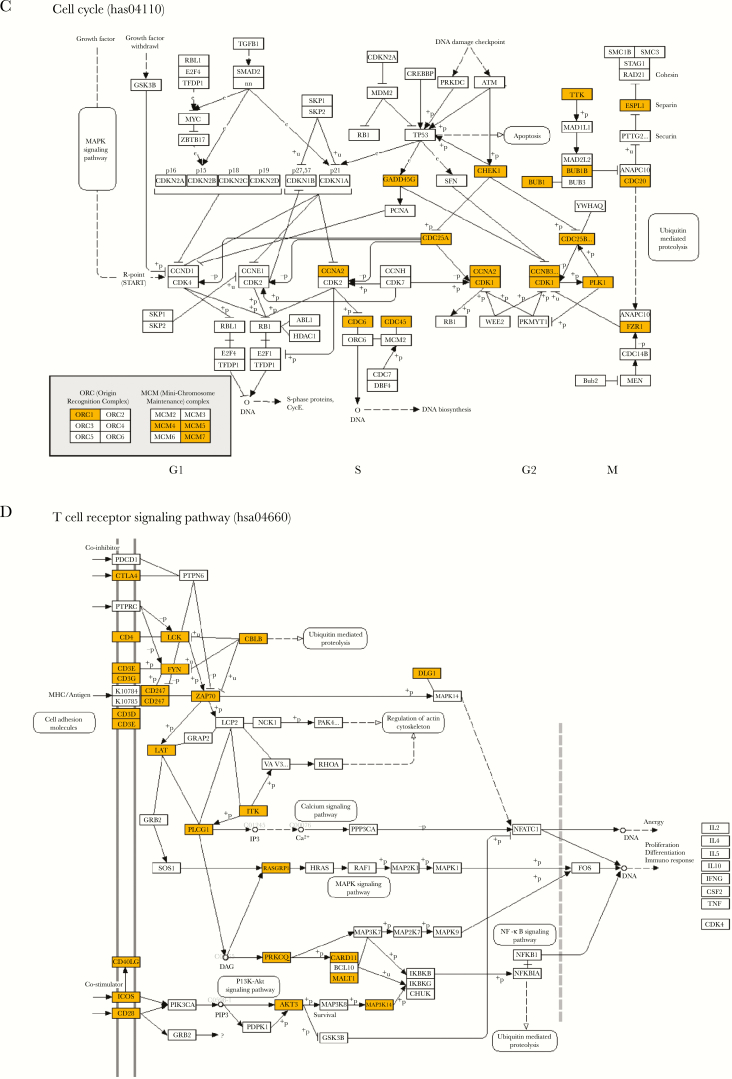
Results: We found that specific gene expression profiles in the blood were strongly correlated with the Pao 2/Fio 2 ratio and viral load in the lower respiratory tract. Cell cycle and leukocyte-related immunity were activated at the acute stage of the infection while T-cell functions and various metabolic processes were associated with the recovery phase of the illness. A transition from systemic innate to adaptive immunity was found.
Conclusions: We developed a novel approach for transcriptomic analysis to identify key host responses that were strongly correlated with specific clinical and virologic parameters in patients with H7N9 infection.
Figures
Similar articles
-
A(H7N9) virus results in early induction of proinflammatory cytokine responses in both human lung epithelial and endothelial cells and shows increased human adaptation compared with avian H5N1 virus.J Virol. 2015 Apr;89(8):4655-67. doi: 10.1128/JVI.03095-14. Epub 2015 Feb 11. J Virol. 2015. PMID: 25673714 Free PMC article.
-
Host immunological response and factors associated with clinical outcome in patients with the novel influenza A H7N9 infection.Clin Microbiol Infect. 2014 Aug;20(8):O493-500. doi: 10.1111/1469-0691.12505. Epub 2014 Jan 21. Clin Microbiol Infect. 2014. PMID: 24350809
-
In Vivo Characterization of Avian Influenza A (H5N1) and (H7N9) Viruses Isolated from Canadian Travelers.Viruses. 2019 Feb 23;11(2):193. doi: 10.3390/v11020193. Viruses. 2019. PMID: 30813415 Free PMC article.
-
Avian influenza A (H7N9) virus infection in humans: epidemiology, evolution, and pathogenesis.Infect Genet Evol. 2014 Dec;28:304-12. doi: 10.1016/j.meegid.2014.10.016. Epub 2014 Oct 24. Infect Genet Evol. 2014. PMID: 25446940 Review.
-
Did the Highly Pathogenic Avian Influenza A(H7N9) Viruses Emerged in China Raise Increased Threat to Public Health?Vector Borne Zoonotic Dis. 2019 Jan;19(1):22-25. doi: 10.1089/vbz.2018.2299. Epub 2018 Sep 15. Vector Borne Zoonotic Dis. 2019. PMID: 30222520 Review.
Cited by
-
Hypoxia and Activation of Neutrophil Degranulation-Related Genes in the Peripheral Blood of COVID-19 Patients.Viruses. 2024 Jan 28;16(2):201. doi: 10.3390/v16020201. Viruses. 2024. PMID: 38399976 Free PMC article.
-
Understanding the role of host response in influenza pneumonitis.Intensive Care Med. 2019 Jul;45(7):1012-1014. doi: 10.1007/s00134-019-05582-5. Epub 2019 Apr 24. Intensive Care Med. 2019. PMID: 31020362 No abstract available.
-
The Host Response to Viral Infections Reveals Common and Virus-Specific Signatures in the Peripheral Blood.Front Immunol. 2021 Oct 27;12:741837. doi: 10.3389/fimmu.2021.741837. eCollection 2021. Front Immunol. 2021. PMID: 34777354 Free PMC article.
-
Immune Control of Avian Influenza Virus Infection and Its Vaccine Development.Vaccines (Basel). 2023 Mar 4;11(3):593. doi: 10.3390/vaccines11030593. Vaccines (Basel). 2023. PMID: 36992177 Free PMC article. Review.
-
Comparative Pathology of Animal Models for Influenza A Virus Infection.Pathogens. 2023 Dec 29;13(1):35. doi: 10.3390/pathogens13010035. Pathogens. 2023. PMID: 38251342 Free PMC article. Review.
References
-
- Gao R, Cao B, Hu Y, et al. . Human infection with a novel avian-origin influenza A (H7N9) virus. N Engl J Med 2013; 368:1888–97. - PubMed
-
- World Health Organization. Disease outbreak news. Human infection with avian influenza A(H7N9) virus-China. http://www.who.int/csr/don/22-february-2017-ah7n9-china/en/. Accessed 22 February 2017.
-
- World Health Organization. Influenza monthly risk assessment summary, 2016. http://www.who.int/influenza/human_animal_interface/Influenza_Summary_IR.... Accessed 27 November 2017.
-
- Husain M. Avian influenza A (H7N9) virus infection in humans: epidemiology, evolution, and pathogenesis. Infect Genet Evol 2014; 28:304–12. - PubMed
Publication types
MeSH terms
Grants and funding
LinkOut - more resources
Full Text Sources
Other Literature Sources
Medical
Molecular Biology Databases
