Multicenter Study
. 2018 Sep 1;103(9):3194-3204.
doi: 10.1210/jc.2017-02301.

Subcutaneous Fat Fibrosis Links Obesity to Insulin Resistance in Chinese Americans

Affiliations
Multicenter Study

Subcutaneous Fat Fibrosis Links Obesity to Insulin Resistance in Chinese Americans

Diana L Alba et al. J Clin Endocrinol Metab. .

Abstract

Objective: Type 2 diabetes presents at a lower body mass index (BMI) in Chinese individuals than in white individuals. We sought to determine the role of subcutaneous adipose tissue (SCAT)-intrinsic factors, vs BMI or adiposity per se, in the vulnerability of Chinese individuals to obesity-associated impairment of insulin sensitivity.

Research design and methods: Thirty-two Chinese and 30 white men and women from a cohort in the San Francisco Bay Area underwent anthropometric measurements, body composition (dual-energy X-ray absorptiometry) analyses, and measurement of fasting plasma glucose and insulin. Forty-eight also provided abdominal SCAT samples for transcriptional and biochemical analyses of tissue fibrosis.

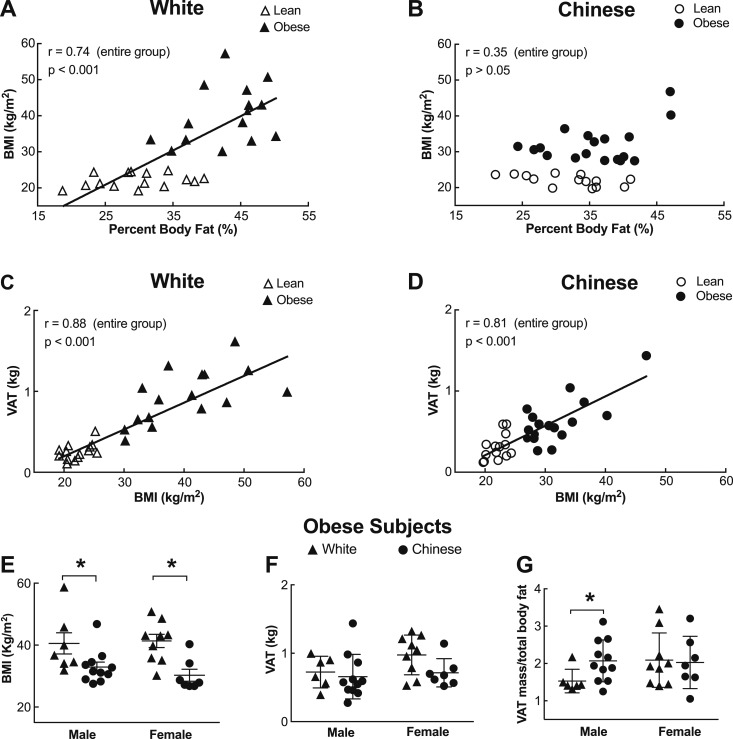
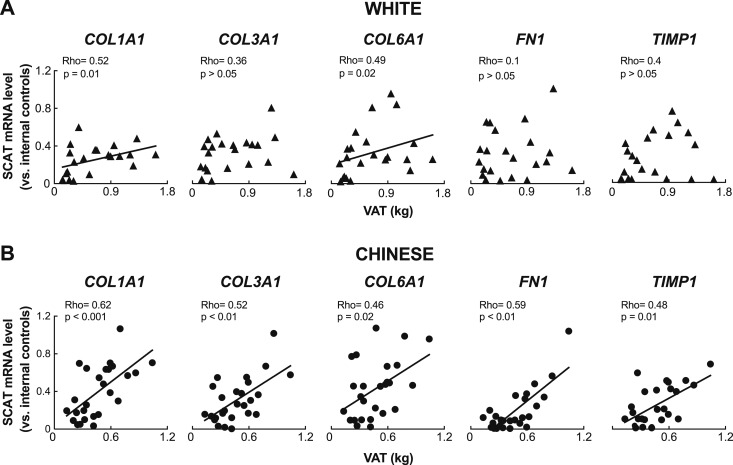
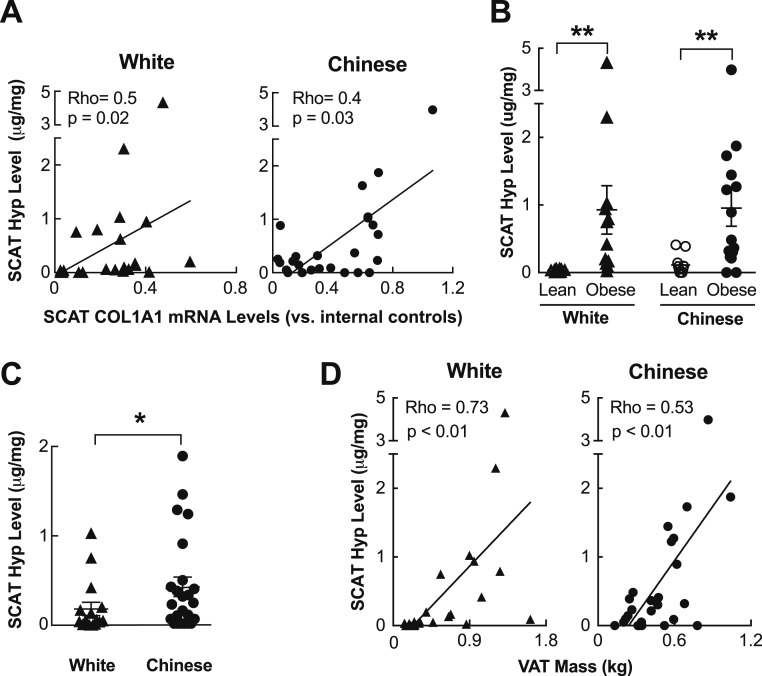
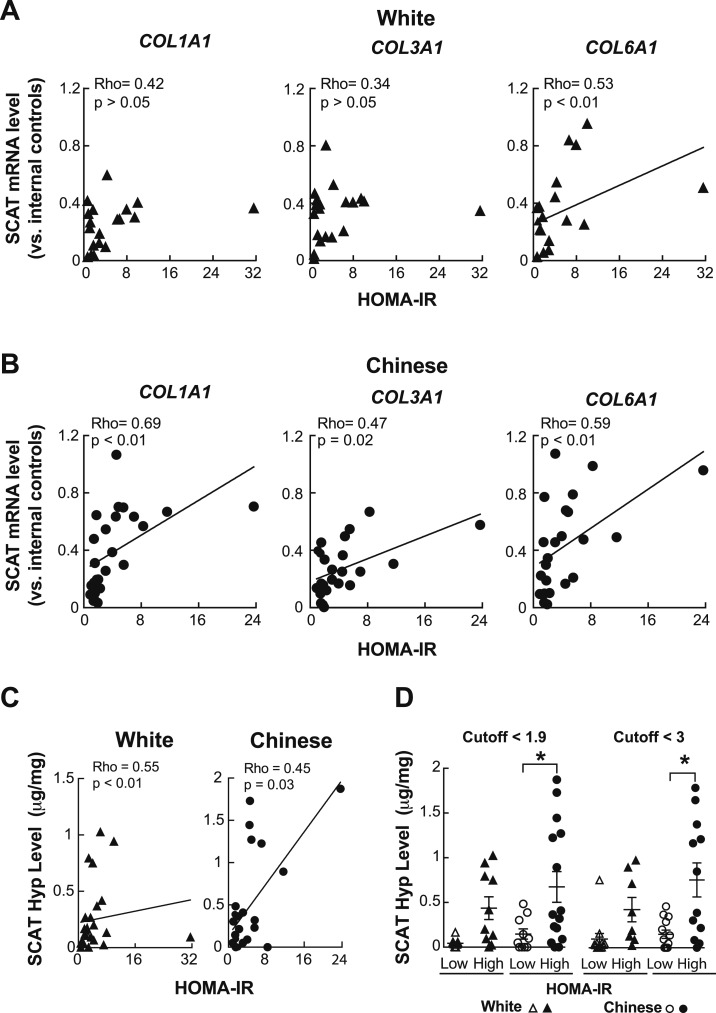
Results: BMI correlated with total body fat in white (r = 0.74, P < 0.001) but not Chinese individuals, whereas BMI correlated with visceral adipose tissue (VAT) accrual in both ethnicities (r = 0.88 and 0.81, respectively; P < 0.01). Insulin resistance (homeostatic model assessment of insulin resistance) worsened with VAT mass, but not total body fat, in Chinese subjects (r = 0.63, P < 0.01), whereas it worsened with both in white individuals. By contrast, SCAT mRNA levels of genes encoding profibrotic proteins rose remarkably along with both BMI and VAT mass in Chinese but not white subjects. Similarly, SCAT levels of hydroxyproline, an indicator of tissue collagen content that correlated with increasing VAT mass, were higher in Chinese vs white subjects, particularly in the setting of relative insulin resistance.

Conclusions: Our findings dissociate BMI from adiposity in Chinese individuals and instead highlight SCAT fibrosis as a process linked to visceral adiposity and insulin resistance in this group.


Figures

Figure 1.
Figure 1.
BMI and total adiposity are differentially related in white and Chinese individuals. (A) Lean (BMI < 24.9; n = 14) and obese (BMI > 30; n = 16) white individuals, showing that BMI positively correlates with %BF measured by DXA (r = 0.74, P < 0.001). (B) Similar data for Chinese subjects, [BMI < 24.9 for the lean subgroup (n = 14), and BMI > 27.5 for the obese subgroup (n = 18)], showing a lack of correlation between BMI and %BF. (C and D) Increasing VAT mass (DXA), unlike %BF, correlates with increasing BMI in both white (C; r = 0.88) and Chinese (D; r = 0.81) subjects. Relationships in A to D were analyzed by Pearson correlation. Solid lines represent correlations through the data. (E to G) Sex-specific body composition comparisons in Chinese and white subjects with obesity (7 white men, 11 Chinese men, 9 white women, and 7 Chinese women), showing (E) lower BMI values for both Chinese men and women vs white counterparts [men: 32.9 ± 1.6 kg/m2 for Chinese individuals vs 40.6 ± 3.4 kg/m2 for white individuals (P = 0.04); women: 30.3 ± 5.8 kg/m2 for Chinese individuals vs 41.4 ± 2.1 kg/m2 for white individuals (P = 0.002)]; (F) similar degrees of visceral adiposity between Chinese men and women and sex-matched white individuals; and (G) a greater contribution of VAT to total body fat in Chinese men with obesity (2.1% ± 0.6%) vs white men with obesity (1.5% ± 0.3%; P = 0.04). Differences between groups were analyzed by Student t test. Statistically significant differences are indicated (*P < 0.05).
Figure 2.
Figure 2.
Profibrotic gene expression in the SCAT correlates with visceral fat accrual in Chinese but not white subjects. (A and B) Correlation between SCAT mRNA levels of COL1A1, COL3A1, COL6A1, FN1, and TIMP1, respectively, and VAT mass, showing a consistent positive correlation between markers of SCAT fibrosis and VAT accrual in Chinese (n = 26) but not white (n = 22) subjects. For each data point, mRNA levels are expressed relative to the mean of two internal control genes from the same sample. Solid lines represent correlations through the data.
Figure 3.
Figure 3.
SCAT fibrosis is associated with visceral obesity in Chinese individuals. (A) SCAT Hyp levels correlate positively with SCAT mRNA levels of COL1A1, in both the 26 Chinese and 22 white subjects. (B) SCAT Hyp measurements showing that obesity promotes SCAT fibrosis in both Chinese (11 lean and 15 with obesity) and white (10 lean and 12 with obesity) subjects. (C) Higher Hyp concentrations in the SCAT of Chinese vs white individuals (excluding two Chinese and six white subjects with severe obesity; BMI > 35), indicating that Chinese individuals are relatively prone to developing SCAT fibrosis. (D) Correlation between SCAT Hyp levels, and VAT mass, showing a consistent positive correlation between Hyp levels and VAT accrual in white (n = 22) and Chinese (n = 26) individuals. *P < 0.05, **P < 0.01.
Figure 4.
Figure 4.
SCAT fibrosis correlates with rising HOMA-IR in Chinese subjects. (A and B) Plots comparing mRNA levels for several profibrotic genes (COL1A1, COL3A1, and COL6A1) in the SCAT with HOMA-IR, showing (A) an inconsistent correlation for white individuals and (B) a relatively consistent positive correlation for Chinese individuals. For each data point, mRNA levels are expressed relative to the mean of two internal control genes from the same sample. (C) Plots showing that increasing SCAT Hyp levels correlate with rising HOMA-IR in both white and Chinese subjects, although the slope of the relationship for white subjects tended to be steeper. *P < 0.05 (D) SCAT Hyp levels for white and Chinese individuals with “high” vs relatively “low” HOMA-IR values, showing that regardless of whether a HOMA-IR cutoff of 1.9 or 3 is used, insulin resistance in Chinese individuals is associated with greater SCAT fibrosis than it is for white counterparts. All analyses in A to D involved 25 Chinese and 20 white subjects, with 3 subjects (2 white and 1 Chinese) being excluded because they were taking insulin. Solid lines represent correlations through the data.

References

    1. Gu D, He J, Duan X, Reynolds K, Wu X, Chen J, Huang G, Chen C-S, Whelton PK. Body weight and mortality among men and women in China. JAMA. 2006;295(7):776–783. - PubMed
    1. Zheng W, McLerran DF, Rolland B, Zhang X, Inoue M, Matsuo K, He J, Gupta PC, Ramadas K, Tsugane S, Irie F, Tamakoshi A, Gao Y-T, Wang R, Shu X-O, Tsuji I, Kuriyama S, Tanaka H, Satoh H, Chen C-J, Yuan J-M, Yoo K-Y, Ahsan H, Pan WH, Gu D, Pednekar MS, Sauvaget C, Sasazuki S, Sairenchi T, Yang G, Xiang Y-B, Nagai M, Suzuki T, Nishino Y, You S-L, Koh W-P, Park SK, Chen Y, Shen C-Y, Thornquist M, Feng Z, Kang D, Boffetta P, Potter JD. Association between body-mass index and risk of death in more than 1 million Asians. N Engl J Med. 2011;364(8):719–729. - PMC - PubMed
    1. Hsu WC, Araneta MRG, Kanaya AM, Chiang JL, Fujimoto W. BMI cut points to identify at-risk Asian Americans for type 2 diabetes screening. Diabetes Care. 2015;38(1):150–158. - PMC - PubMed
    1. Jih J, Mukherjea A, Vittinghoff E, Nguyen TT, Tsoh JY, Fukuoka Y, Bender MS, Tseng W, Kanaya AM. Using appropriate body mass index cut points for overweight and obesity among Asian Americans. Prev Med. 2014;65:1–6. - PMC - PubMed
    1. Deurenberg P, Yap M, van Staveren WA. Body mass index and percent body fat: a meta analysis among different ethnic groups. Int J Obes Relat Metab Disord. 1998;22(12):1164–1171. - PubMed

Publication types

MeSH terms