

150-μm Spatial Resolution Using Photon-Counting Detector Computed Tomography Technology: Technical Performance and First Patient Images
- PMID: 29847412
- PMCID: PMC6173631
- DOI: 10.1097/RLI.0000000000000488
150-μm Spatial Resolution Using Photon-Counting Detector Computed Tomography Technology: Technical Performance and First Patient Images
Abstract
Objective: The aims of this study were to quantitatively assess two new scan modes on a photon-counting detector computed tomography system, each designed to maximize spatial resolution, and to qualitatively demonstrate potential clinical impact using patient data.
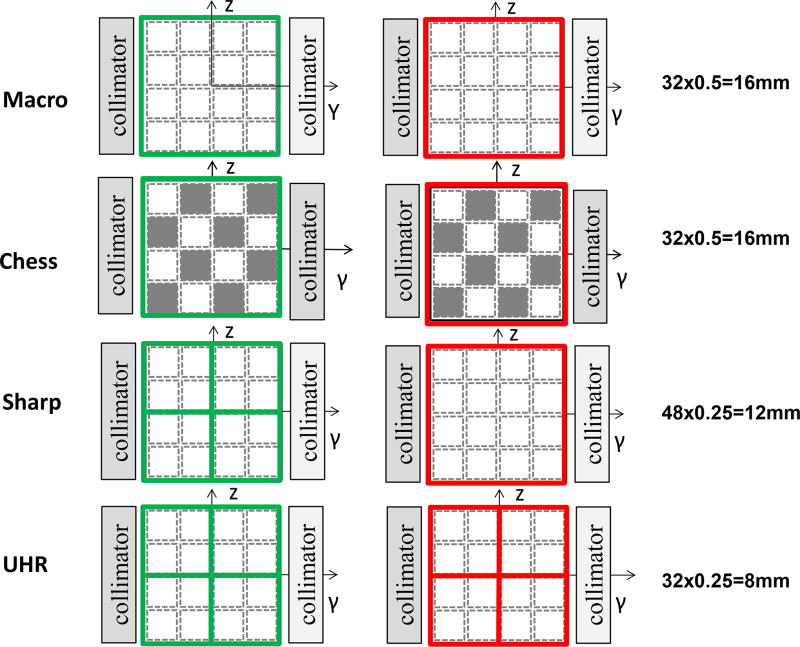
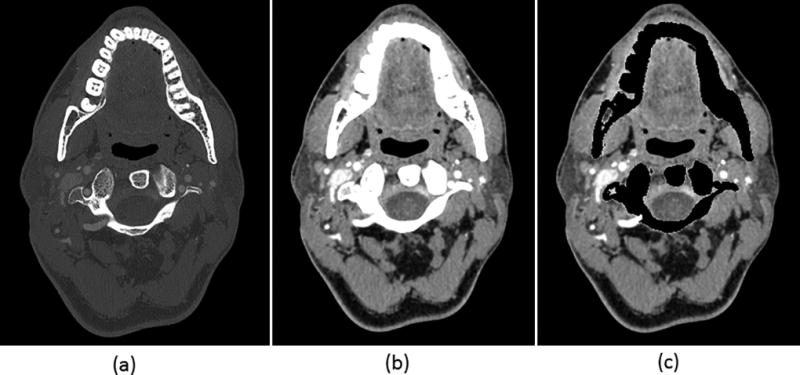
Materials and methods: This Health Insurance Portability Act-compliant study was approved by our institutional review board. Two high-spatial-resolution scan modes (Sharp and UHR) were evaluated using phantoms to quantify spatial resolution and image noise, and results were compared with the standard mode (Macro). Patients were scanned using a conventional energy-integrating detector scanner and the photon-counting detector scanner using the same radiation dose. In first patient images, anatomic details were qualitatively evaluated to demonstrate potential clinical impact.
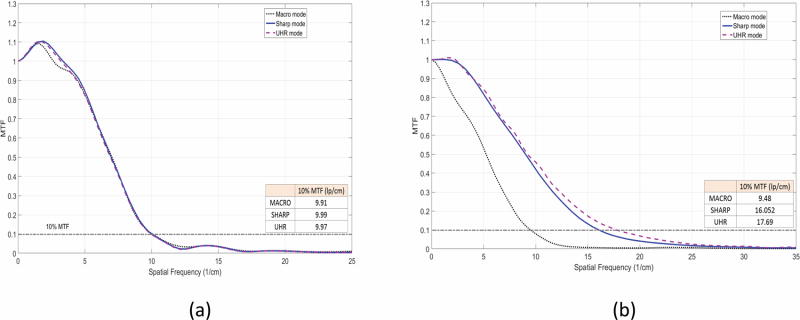
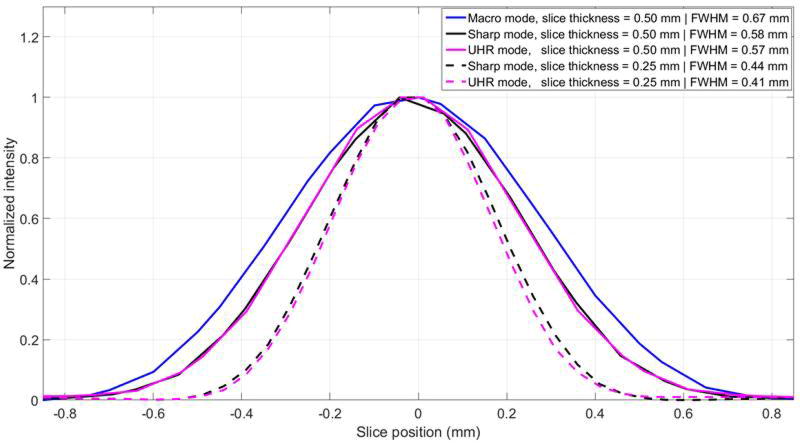
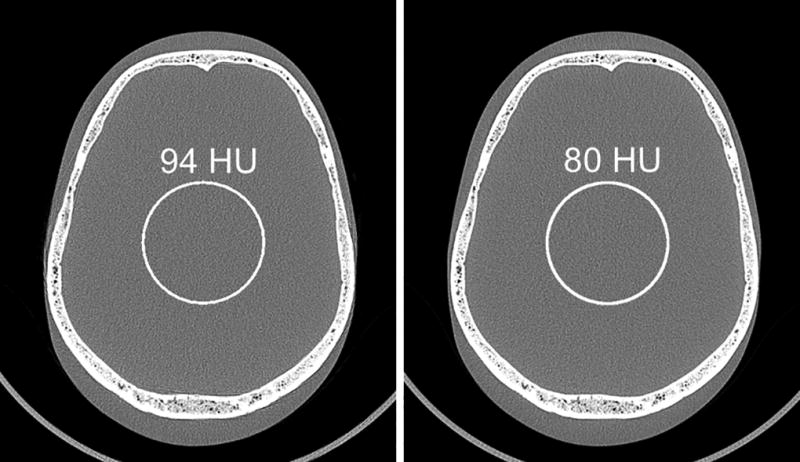
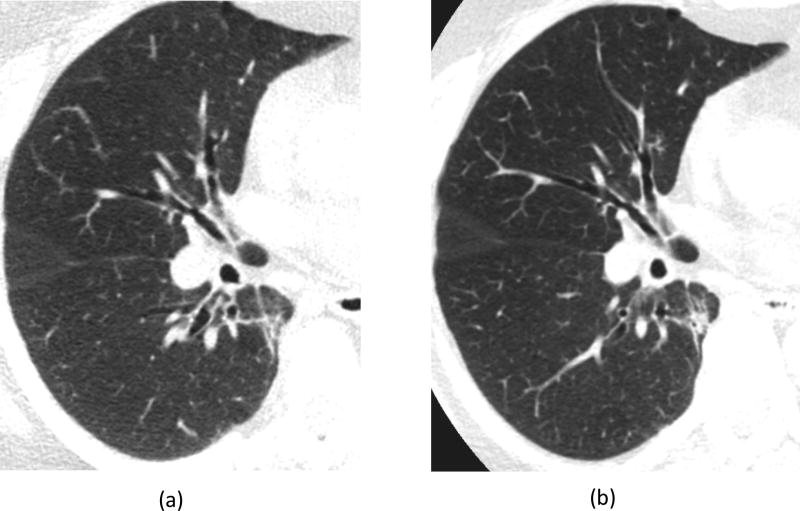
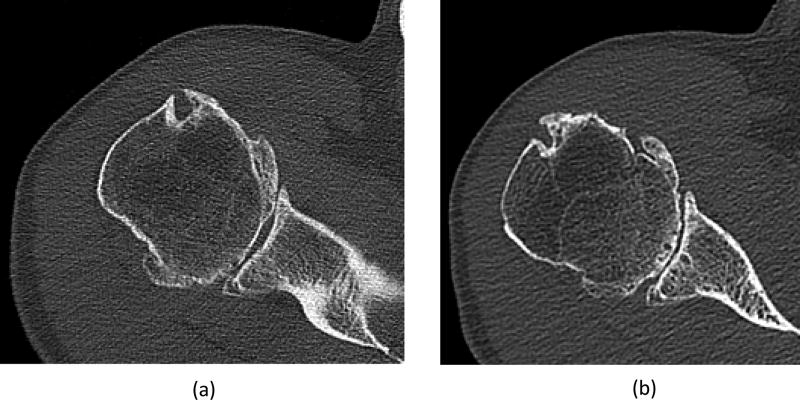
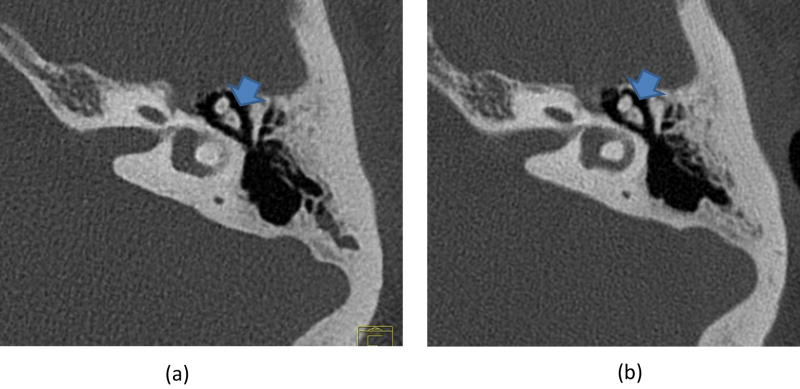
Results: Sharp and UHR modes had a 69% and 87% improvement in in-plane spatial resolution, respectively, compared with Macro mode (10% modulation-translation-function values of 16.05, 17.69, and 9.48 lp/cm, respectively). The cutoff spatial frequency of the UHR mode (32.4 lp/cm) corresponded to a limiting spatial resolution of 150 μm. The full-width-at-half-maximum values of the section sensitivity profiles were 0.41, 0.44, and 0.67 mm for the thinnest image thickness for each mode (0.25, 0.25, and 0.5 mm, respectively). At the same in-plane spatial resolution, Sharp and UHR images had up to 15% lower noise than Macro images. Patient images acquired in Sharp mode demonstrated better delineation of fine anatomic structures compared with Macro mode images.
Conclusions: Phantom studies demonstrated superior resolution and noise properties for the Sharp and UHR modes relative to the standard Macro mode and patient images demonstrated the potential benefit of these scan modes for clinical practice.
Figures
References
-
- Tümer T, et al. Preliminary results obtained from a novel CdZnTe pad detector and readout ASIC developed for an automatic baggage inspection system. Nuclear Science Symposium Conference Record. 2000;1:4/36–4/41.
-
- Shikhaliev PM. Energy-resolved computed tomography: first experimental results. Phys Med Biol. 2008;53(20):5595–613. - PubMed
-
- Shikhaliev PM, Fritz SG. Photon counting spectral CT versus conventional CT: comparative evaluation for breast imaging application. Phys Med Biol. 2011;56(7):1905–30. - PubMed
-
- Schlomka JP, et al. Experimental feasibility of multi-energy photon-counting K-edge imaging in pre-clinical computed tomography. Phys Med Biol. 2008;53(15):4031–47. - PubMed
Publication types
MeSH terms
Grants and funding
LinkOut - more resources
Full Text Sources
Other Literature Sources
Medical
