

Substantial Heterogeneity in Progress Toward Reaching the 90-90-90 HIV Target in the WHO European Region
- PMID: 29847474
- PMCID: PMC6104723
- DOI: 10.1097/QAI.0000000000001761
Substantial Heterogeneity in Progress Toward Reaching the 90-90-90 HIV Target in the WHO European Region
Abstract
Background: Achieving the UNAIDS 90-90-90 target by 2020 is expected to end the HIV epidemic by 2030. We report on progress in the WHO European Region in meeting this target.
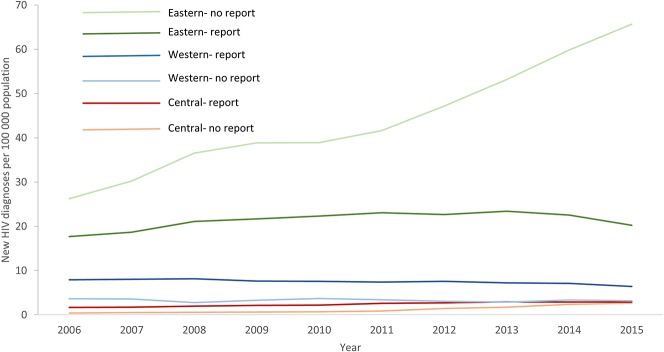
Methods: The European Centre for Disease Prevention and Control (ECDC) sent questionnaires to 55 countries in 2016. We report estimates for 4 stages of the continuum of HIV care (living with HIV, diagnosed, treated, and virally suppressed), corresponding to the Joint United Nations Programme on HIV and AIDS (UNAIDS) target and explore differences by subregion and challenges with reporting data.
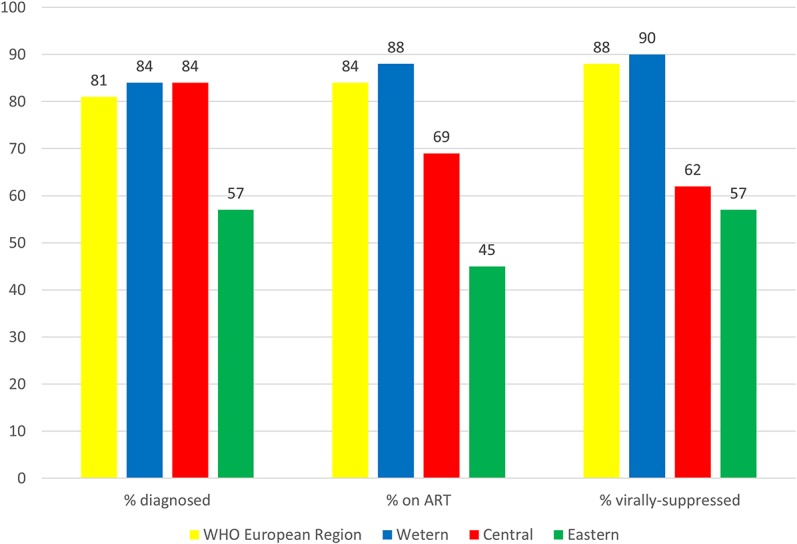
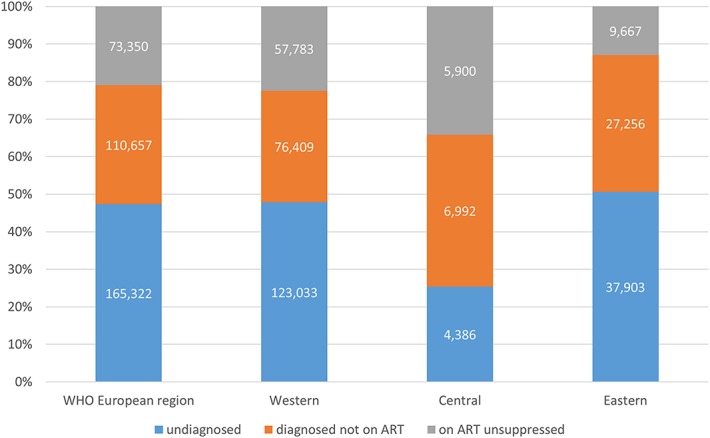
Findings: Forty-four countries provided data for ≥1 stage, and 29 for all 4 stages. Estimated HIV prevalence was 0.19% (range 0.02%-0.84%, n = 37 countries providing stage 1 data). The proportion diagnosed of people living with HIV ranged from 38% to 98% (n = 37 reporting number of people living with HIV and diagnosed). The proportion on ART of those diagnosed ranged from 27% to 96% (n = 40 reporting numbers diagnosed and treated), and viral suppression rates ranged from 32% to 97% (n = 31 providing numbers treated and virally suppressed). The overall continuum of care estimate for 29 countries with complete data was 81-84-88, which differed by subregion: 84-88-90, 84-69-62, and 57-45-57 for the western, central, and eastern subregions, respectively. Challenges in reporting data included absence of a single data source for all stages, shortage of expertise, and lack of financial and human resources.
Conclusions: There is an urgent need to strengthen HIV testing programs throughout Europe, particularly in the eastern subregion, and to remove constraints hampering access to testing and care. Recent changes to treatment guidelines should help reduce the numbers diagnosed not treated.
Figures
References
-
- World Health Organization. Adults and children estimated to be living with HIV, 2015, by WHO region. 2017. Available at: http://www.who.int/gho/hiv/epidemic/hiv_001.jpg. Accessed October 05, 2017.
-
- World Health Organization. World Health Organisation Regional Office for Europe: countries. 2017. Available at: http://www.euro.who.int/en/countries. Accessed November 07, 2017.
-
- World Health Organization. Global Health Observatory data repository: number of new HIV infections data by WHO region. 2017. Available at: http://apps.who.int/gho/data/view.main.HIVINCIDENCEREGIONv?lang=en. Accessed October 05, 2017.
-
- UNAIDS. Ending AIDS Progress Towards the 90-90-90 Targets. Geneva, Switzerland: UNAIDS; 2017.
-
- European Centre for Disease Prevention and Control and WHO Regional Office for Europe. HIV/AIDS Surveillance in Europe 2015. Stockholm, Sweden: ECDC; 2016.
Publication types
MeSH terms
Substances
Grants and funding
LinkOut - more resources
Full Text Sources
Other Literature Sources
Medical
