. 2018 May 1;59(6):2325-2338.
doi: 10.1167/iovs.17-23616.

Young Ossabaw Pigs Fed a Western Diet Exhibit Early Signs of Diabetic Retinopathy

Affiliations

Young Ossabaw Pigs Fed a Western Diet Exhibit Early Signs of Diabetic Retinopathy

Rayne R Lim et al. Invest Ophthalmol Vis Sci. .

Abstract

Purpose: Recent clinical data suggest an increasing prevalence of obesity and type 2 diabetes in adolescents, placing them at high risk of developing diabetic retinopathy during adult working years. The present study was designed to characterize the early retinal and microvascular alterations in young Ossabaw pigs fed a Western diet, described as a model of metabolic syndrome genetically predisposed to type 2 diabetes.

Methods: Four-month-old Ossabaw miniature pigs were divided into two groups, lean and diet-induced obesity. Obese pigs were fed a Western diet with high-fat/high-fructose corn syrup/high-choleric content for 10 weeks. Blood and retina were collected for biochemical profiling, trypsin digest, flatmounts, Fluoro-Jade C staining, electron microscopy, quantitative PCR, immunohistochemistry, and Western blots.

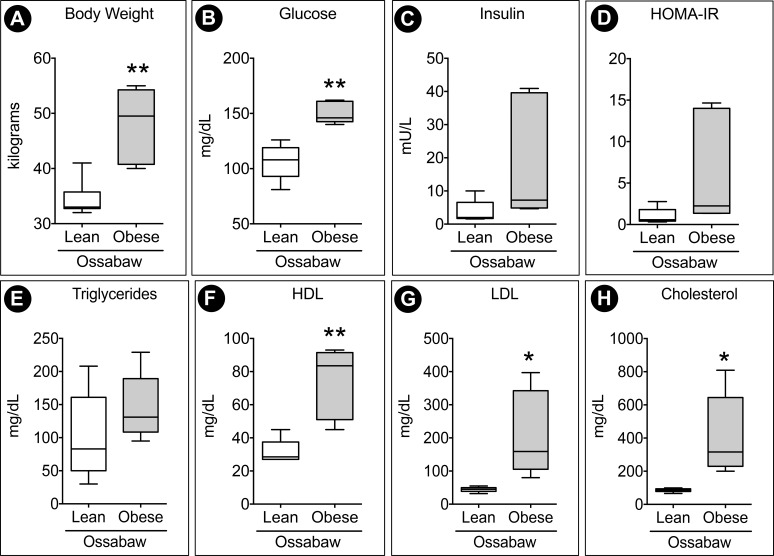
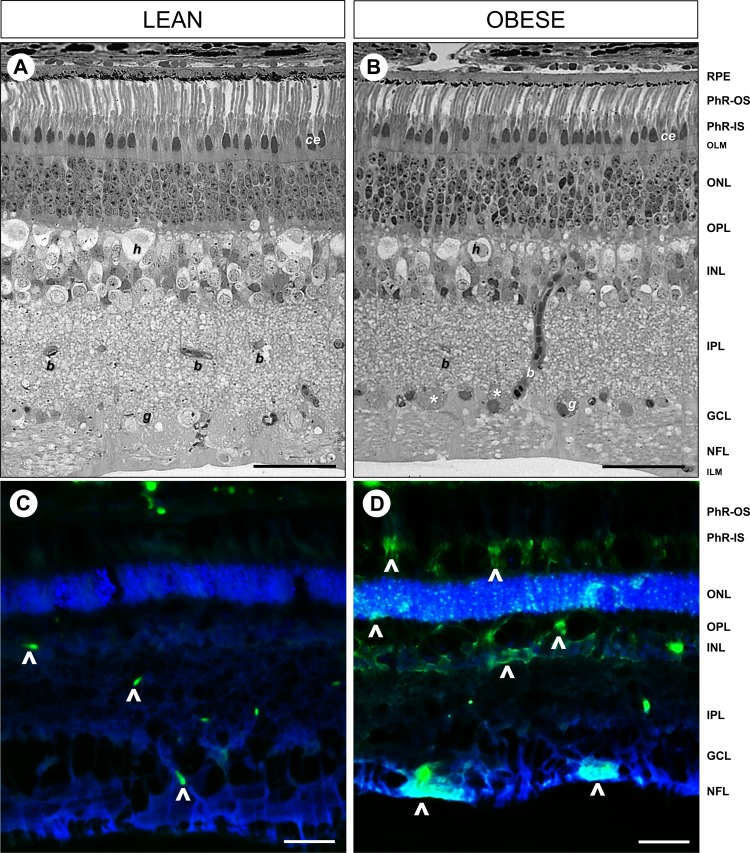
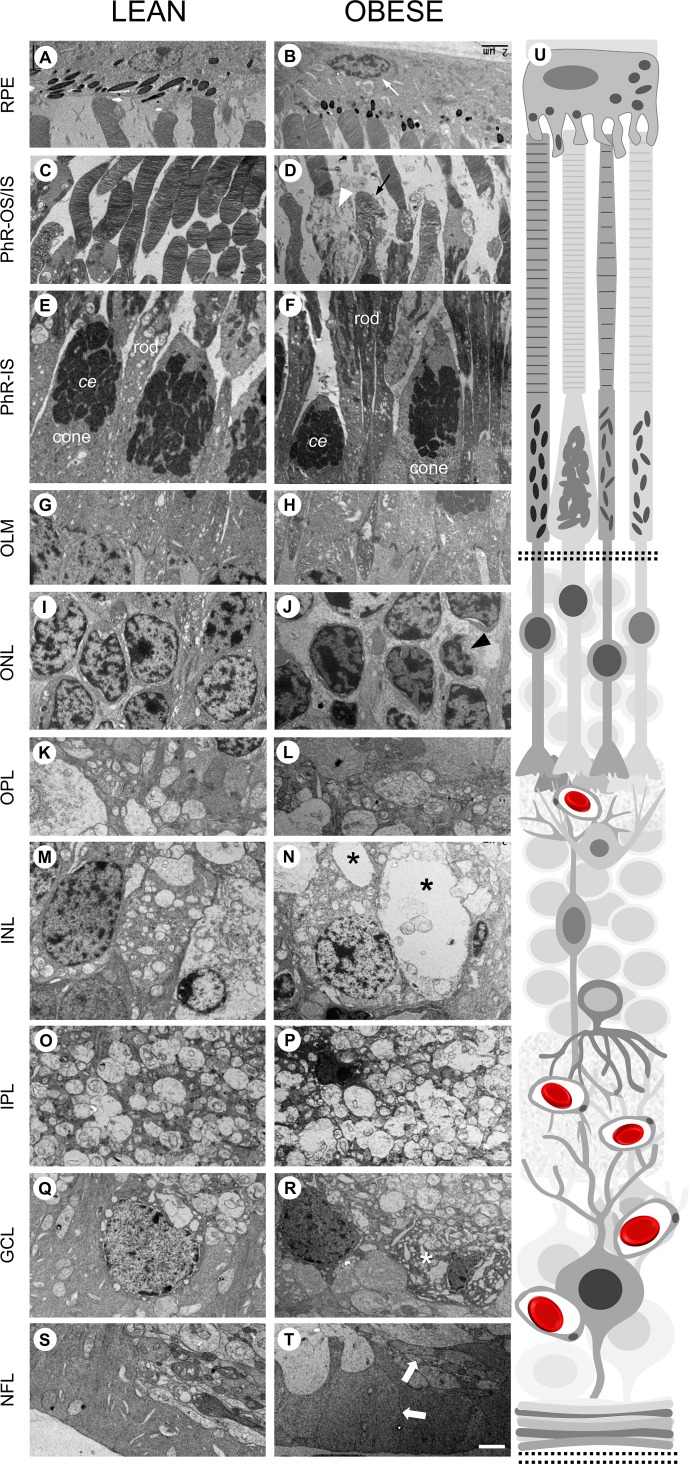
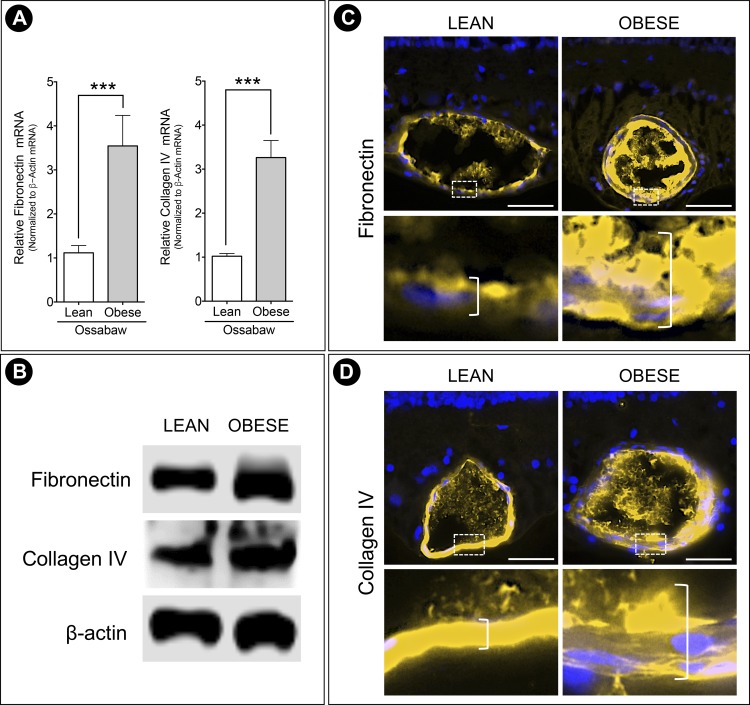
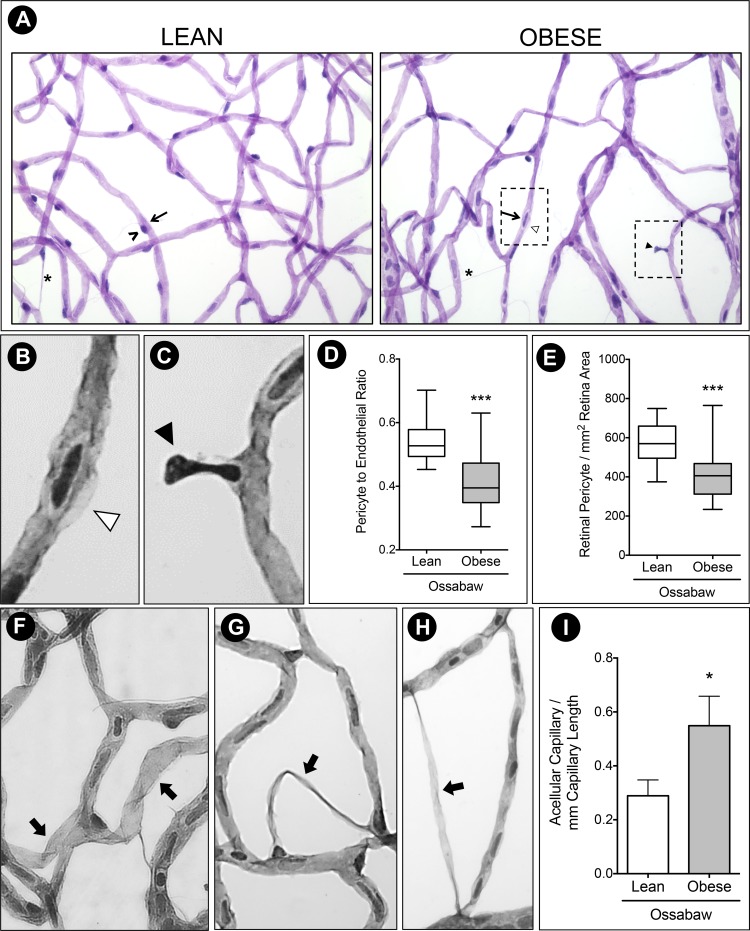
Results: Young Ossabaw pigs had elevated fasting blood glucose after feeding on a Western diet for 10 weeks. Their retina showed disrupted cellular architecture across neural layers, with numerous large vacuoles seen in cell bodies of the inner nuclear layer. Microvessels in the obese animals exhibited thickened basement membrane, along with pericyte ghosts and acellular capillaries. The pericyte to endothelial ratio decreased significantly. Retina flatmounts from obese pigs displayed reduced capillary density, numerous terminal capillary loops, and string vessels, which stained collagen IV but not isolectin IB4. Quantitative PCR and Western blots showed significantly high levels of basement membrane proteins collagen IV and fibronectin in obese pigs.

Conclusions: This is the first study to describe the ultrastructural neuronal and vascular changes in the retina of young Ossabaw pigs fed a Western diet, simulating early signs of diabetic retinopathy pathogenesis.


Figures

Figure 1
Figure 1
Ossabaw pigs fed a Western diet exhibit signs of hyperglycemia and hyperlipidemia. (A) Pigs showed ∼40% weight increase following 10 weeks of the Western diet. Blood profiling of 20-hour fasted pigs showed an increased trend of (B) plasma glucose and (C) plasma insulin. (D) HOMA-IR, calculated by insulin (mU/L) × glucose (mg/dL), was elevated, indicating insulin resistance in obese pigs. (E–H) Hyperlipidemia was characterized by an increase in HDL, LDL, and cholesterol. n = 6 animals per group. *P < 0.05 and **P < 0.01.
Figure 2
Figure 2
Cellular derangement of retinal structure and degenerating neurons in the Western diet-fed Ossabaw pigs. Light microscopy of toluidine blue staining on 2-μm thick resin-embedded retinal sections revealed intact and organized cellular structures in (A) lean control pigs, which were disrupted in the (B) obese Ossabaw pigs. FJC staining to visualize degenerating neurons (arrowheads) in (C) lean and (D) obese Ossabaw pigs showed increased labeling of cell bodies in the nerve fiber layer (NFL), INL, and PhR of the obese animals. PhR-IS, photoreceptor inner segment; OLM, outer limiting membrane; ONL, outer nuclear layer; OPL, outer plexiform layer; ILM, inner-limiting membrane; g, ganglion cell; b, blood vessel; h, horizontal cell; ce, cone ellipsoid. n = 3 eyes per group. Scale bar: 50 μm.
Figure 3
Figure 3
Obese Ossabaw pig retina displays multiple neuronal and cellular defects. Representative EM images for all layers of the retina, with (U) schematic of retina structure on the right. (A, B) RPE was intact in both lean and obese pigs. However, nuclear atrophy (white arrow) was seen in the latter. (C, D) PhR outer segment cone disc (black arrow) and PhR inner segment (white arrowhead) were seen to be disrupted in obese Ossabaw pig. (E, F) Smaller cone ellipsoid (ce) was seen in the PhR inner segment of the obese pig. (G, H) The outer limiting membrane was intact and continuous in both groups of animals. (I, J) The outer nuclear layer in Western diet-fed pigs had increased gaps between PhR nuclei and signs of atrophic nuclei (black arrowhead). (K, L) The OPL in both groups of pigs did not show discernible differences. (M, N) The INL in obese pigs were marked by hypervacuolations (black asterisk) in numerous neuronal cell bodies. (O, P) The IPL in both groups of pigs did not show discernible differences. (Q, R) The GCL in Western diet-fed pigs showed numerous densely stained disintegrated cell bodies (white asterisk). (S, T) The nerve fiber layer had indications of axonal swelling (block arrow) in the obese Ossabaw pigs. n = 3 eyes per group. Scale bar: 2 μm.
Figure 4
Figure 4
Increased BM thickness in Ossabaw pigs fed a Western diet. Representative EM images of retinal capillaries in the (A) superficial, (B) intermediate, and (C) deep capillary plexi, overlaid with a 20-spoke radial grid. Inset shows enlarged view of BM at spokes 20 and 10 for each image. BM was measured using ImageJ, by drawing a straight line perpendicular to the boundaries of the BM (denoted by arrowhead). Width measurements were averaged for the comparison between the lean and obese groups, which showed the BM to be consistently thicker across capillary plexi in the GCL, IPL, and INL/OPL of the obese Ossabaw pigs. n = 3 eyes per group; n ≥ 10 capillaries per eye. *P < 0.05 and ***P < 0.001. Scale bar: 1 μm.
Figure 5
Figure 5
Elevated production of BM components in obese pigs. (A) Real-time PCR showed upregulation of fibronectin and collagen IV transcripts in the Western diet-fed pigs, which was supported by (B) Western blot protein expression. Representative immunohistochemistry staining images of (C) fibronectin and (D) collagen IV further showed elevated production of BM proteins in the obese Ossabaw pig retinal capillaries. Insets highlight increased capillary wall thickness (denoted by open bracket) in obese animals compared to lean controls. n = 3 eyes per group. ***P < 0.001. Scale bar: 50 μm.
Figure 6
Figure 6
Pericyte ghost and acellular capillaries in Western diet-fed Ossabaw pigs. (A) Trypsin digest of Ossabaw pig retinas revealed uneven capillary caliber in the obese group, with pericyte lost (black arrowhead) and pericyte ghost (white arrowhead). Migrating pericytes (asterisk) can be seen in both animal groups. (B) Inset of pericyte ghost. (C) Inset of pericyte dropout. (D) Pericyte to endothelial ratio was significantly reduced in obese pigs compared to the lean control, evident by (E) decreased total retinal pericyte count in obese Ossabaw pigs. (F–H) Representative images of acellular capillaries (thick arrow) identified and quantified in Ossabaw pig retinas. (I) Count of acellular capillaries showed 50% increase per millimeter capillary length in Western diet-fed pigs. ^, pericyte cell; arrow, endothelial cell. n = 3 eyes per group. *P < 0.05 and ***P < 0.001.
Figure 7
Figure 7
Arteriolar narrowing and reduced capillary density in Ossabaw mini pigs. Retina flatmount staining with Isolectin IB4 was used to visualize retinal vasculature. (A, B) Representative image of arteriole in similar regions of lean and obese pigs showed a slight reduction in vessel caliber after Western diet. Capillary density was also reduced in obese animals. (C, D) Composite and individual images of superficial, intermediate, and deep capillary plexi showed disruption in the intermediate capillary network of the obese Ossabaw pigs. (E) A representative example of terminal capillary tubes seen in Western diet-fed pigs. (F) Double immunostaining on retinal flatmount using collagen IV and isolectin IB4 shows pericyte ghost (arrowhead) and acellular capillary (asterisk) in the obese Ossabaw pigs. n = 3 eyes per group. Scale bar: 25 μm.

References

    1. International Diabetes Federation. IDF Diabetes Atlas. 8th ed. Brussels, Belgium: International Diabetes Federation, 2017. Available at: http://www.diabetesatlas.org.
    1. Viner R, White B, Christie, D. . Type 2 diabetes in adolescents: a severe phenotype posing major clinical challenges and public health burden. Lancet. 2017; 389: 2252– 2260. - PubMed
    1. Lobstein T, Jackson-Leach R. . Planning for the worst: estimates of obesity and comorbidities in school-age children in 2025. Pediatr Obes. 2016; 11: 321– 325. - PubMed
    1. Ogden CL, Carroll MD, Lawman HG,et al. . Trends in obesity prevalence among children and adolescents in the United States, 1988-1994 through 2013-2014. JAMA. 2016; 315: 2292– 2299. - PMC - PubMed
    1. Copeland KC, Zeitler P, Geffner M,et al. . Characteristics of adolescents and youth with recent-onset type 2 diabetes: the TODAY cohort at baseline. J Clin Endocrinol Metab. 2011; 96: 159– 167. - PMC - PubMed

Publication types