Observational Study
. 2018 May 1;59(6):2422-2436.
doi: 10.1167/iovs.17-23739.

Characterization of Visual Function, Interocular Variability and Progression Using Static Perimetry-Derived Metrics in RPGR-Associated Retinopathy

Affiliations
Observational Study

Characterization of Visual Function, Interocular Variability and Progression Using Static Perimetry-Derived Metrics in RPGR-Associated Retinopathy

James J L Tee et al. Invest Ophthalmol Vis Sci. .

Abstract

Purpose: To characterize bilateral visual function, interocular variability and progression by using static perimetry-derived volumetric and pointwise metrics in subjects with retinitis pigmentosa associated with mutations in the retinitis pigmentosa GTPase regulator (RPGR) gene.

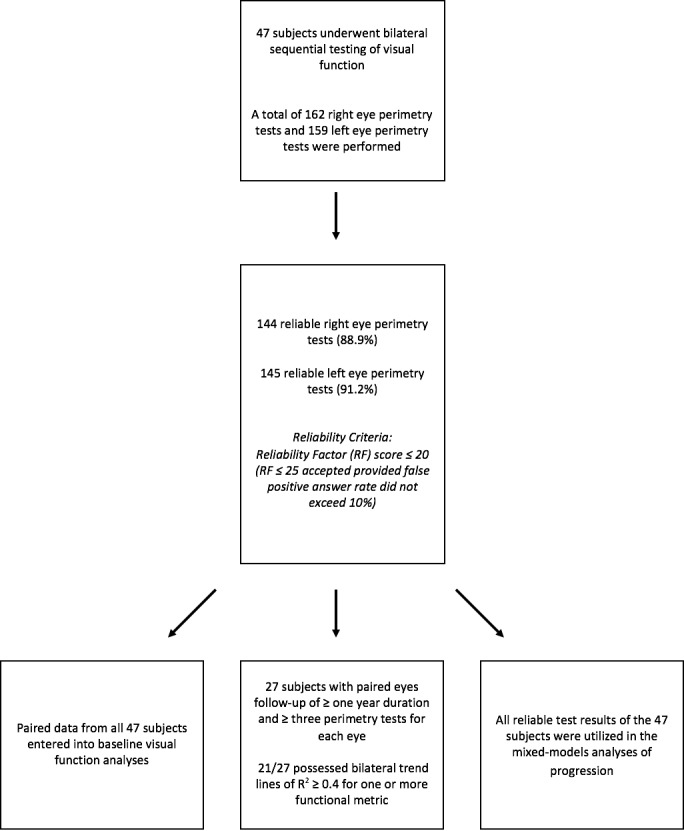
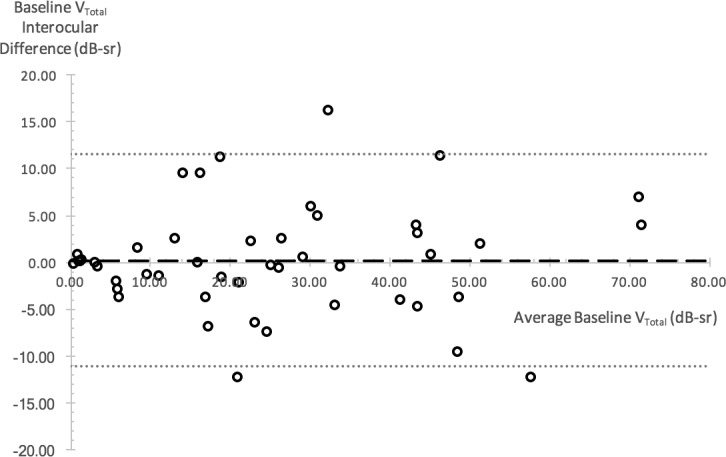
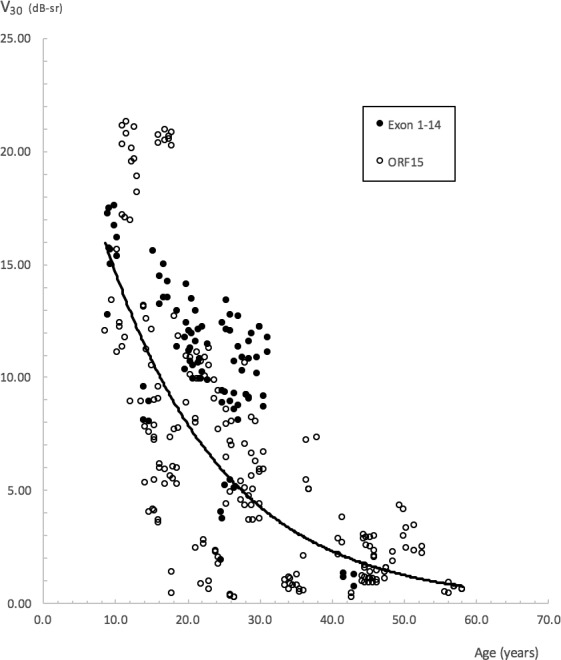
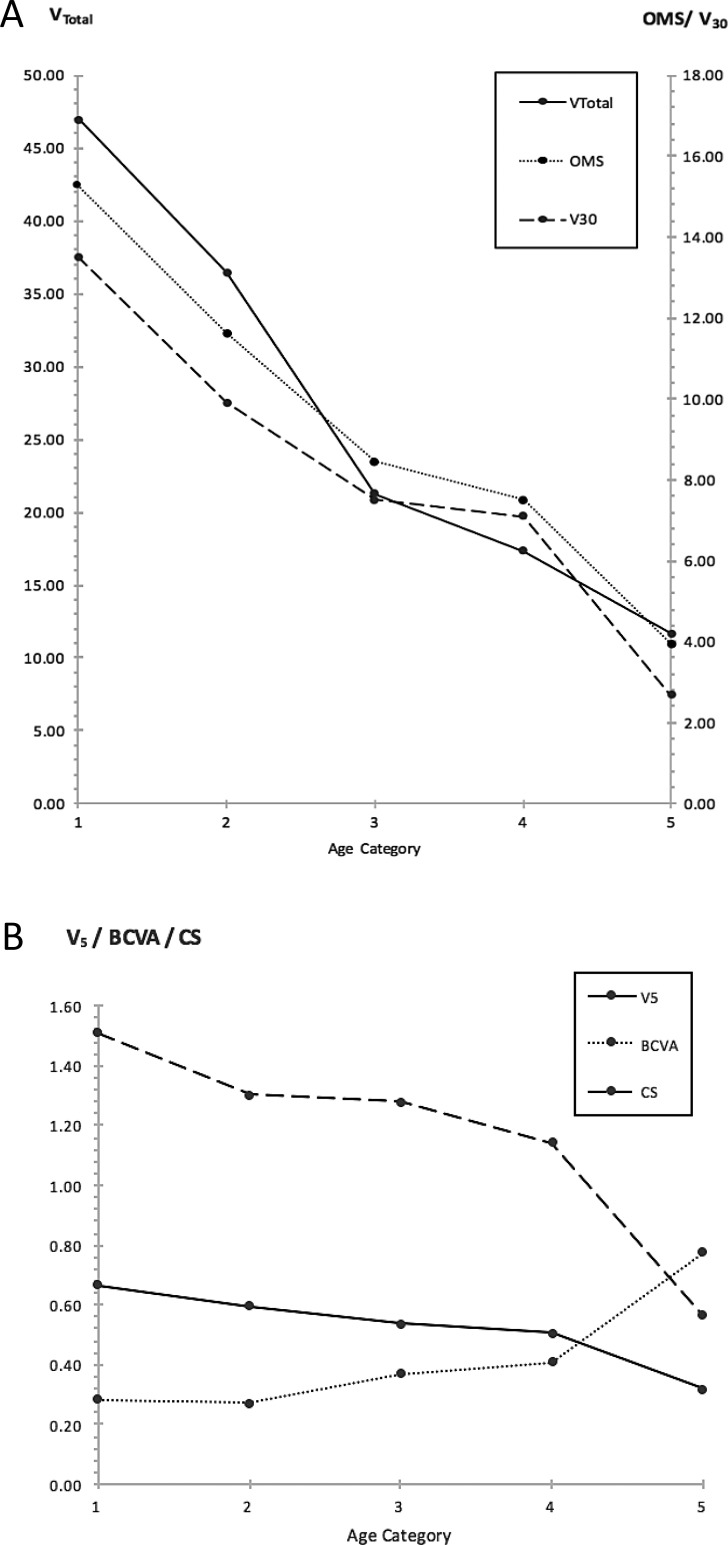
Methods: This was a prospective longitudinal observational study of 47 genetically confirmed subjects. Visual function was assessed with ETDRS and Pelli-Robson charts; and Octopus 900 static perimetry using a customized, radially oriented 185-point grid. Three-dimensional hill-of-vision topographic models were produced and interrogated with the Visual Field Modeling and Analysis software to obtain three volumetric metrics: VTotal, V30, and V5. These were analyzed together with Octopus mean sensitivity values. Interocular differences were assessed with the Bland-Altman method. Metric-specific exponential decline rates were calculated.

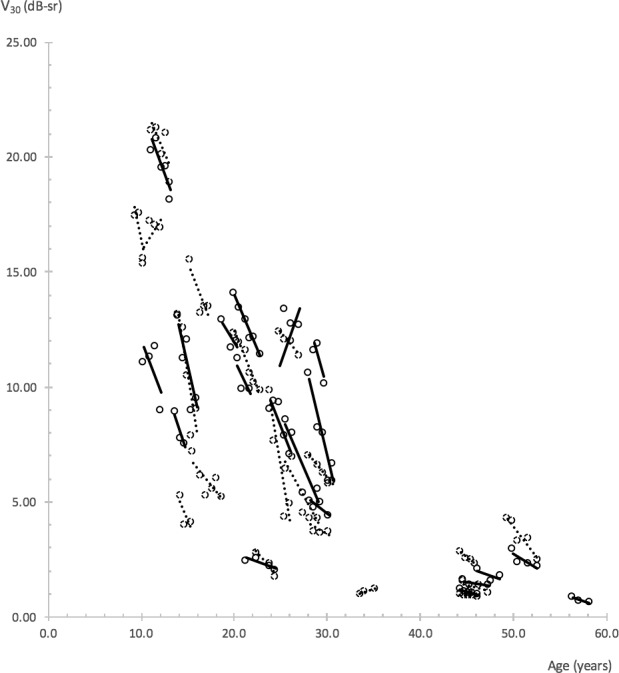
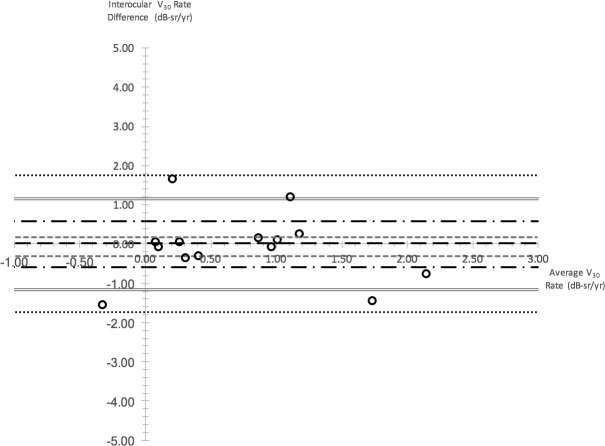
Results: Baseline symmetry was demonstrated by relative interocular difference values of 1% for VTotal and 8% with V30. Degree of symmetry varied between subjects and was quantified with the subject percentage interocular difference (SPID). SPID was 16% for VTotal and 17% for V30. Interocular symmetry in progression was greatest when quantified by VTotal and V30, with 73% and 64% of subjects possessing interocular rate differences smaller in magnitude than respective annual progression rates. Functional decline was evident with increasing age. An overall annual exponential decline of 6% was evident with both VTotal and V30.

Conclusions: In general, good interocular symmetry exists; however, there was both variation between subjects and with the use of various metrics. Our findings will guide patient selection and design of RPGR treatment trials, and provide clinicians with specific prognostic information to offer patients affected by this condition.


Figures

Figure 1
Figure 1
Flowchart illustrating recruitment of subjects and study data based on the inclusion criteria.
Figure 2
Figure 2
Linear trend lines illustrating V30 progression rates. Trend lines and data points of right eyes are represented by solid slope lines and solid circles, left eyes by dotted slope lines and dotted circles. Trend lines with R2 ≥ 0.4 are shown. Perimetry tests that met reliability criteria were used. A minimum of three tests with follow-up duration ≥1 year were required of each eye.
Figure 3
Figure 3
Bland-Altman plot illustrating VTotal interocular differences at baseline. Interocular difference is plotted against the average interocular value for each subject as represented by a circular data point. Dashed line shows mean of interocular differences; dotted lines represent upper and lower 95% limits of agreement.
Figure 4
Figure 4
Bland-Altman plot illustrating interocular differences in V30 rate. Interocular difference is plotted against the average interocular rate for each subject as represented by one circular data point. Long dashed line represent median interocular rate difference; gray small dashed lines represent third and first quartile interocular rate difference; black long dash–dot lines represent upper and lower reference values for 1× annual progression rate; gray double lines represent upper and lower reference values for 2× annual progression rate; black small dotted lines represent upper and lower reference values for 3× annual progression rate.
Figure 5
Figure 5
Scatterplot of V30 against subjects' age. A common decline for all subjects is represented by the solid exponential line with the equation y = 26.9651 e−0.0613x. R2 = 0.49. The equation is provided only as a guide, as overall progression rates for the study were obtained via the mixed-models method.
Figure 6
Figure 6
Baseline visual function of subjects as grouped by respective age categories. Visual function characterized by metrics of peripheral function is shown in (A), function characterized by metrics of isolated central function is shown in (B). A decline in peripheral function is evident from the early ages, whereas a decline in central function becomes apparent only in the later-age categories. Age categories: (1) <15 years of age; (2) 15 to 20 years; (3) 20 to 25 years; (4) 25 to <30 years; (5) ≥30 years.
Figure 7
Figure 7
Scatterplots of VTotal (A) and V30 (B) volumetric metrics at baseline for all study subjects, right eyes corresponding to left eyes. Spearman correlation coefficients—rs = 0.94, P < 0.0001 for VTotal and rs = 0.95, P < 0.0001 for V30—indicate a very strong and significant interocular correlation for both metrics. Diagonal lines represent the line of equality.

References

    1. Hartong DT, Berson EL, Dryja TP. . Retinitis pigmentosa. . 2006; 368: 1795– 1809. - PubMed
    1. Hamel C. . Retinitis pigmentosa. . 2006; 1: 40. - PMC - PubMed
    1. Haim M. . Epidemiology of retinitis pigmentosa in Denmark. . 2002; 233: 1– 34. - PubMed
    1. You QS, Xu L, Wang YX,et al. . Prevalence of retinitis pigmentosa in North China: the Beijing Eye Public Health Care Project. . 2013; 91: e499– e500. - PubMed
    1. Liew G, Michaelides M, Bunce C. . A comparison of the causes of blindness certifications in England and Wales in working age adults (16-64 years), 1999-2000 with 2009-2010. . 2014; 4: e004015. - PMC - PubMed

Publication types