. 2018 May 1;59(6):2529-2537.
doi: 10.1167/iovs.17-22915.

Aqueous Humor Dynamics of the Brown-Norway Rat

Affiliations

Aqueous Humor Dynamics of the Brown-Norway Rat

Kayla R Ficarrotta et al. Invest Ophthalmol Vis Sci. .

Abstract

Purpose: The study aimed to provide a quantitative description of aqueous humor dynamics in healthy rat eyes.

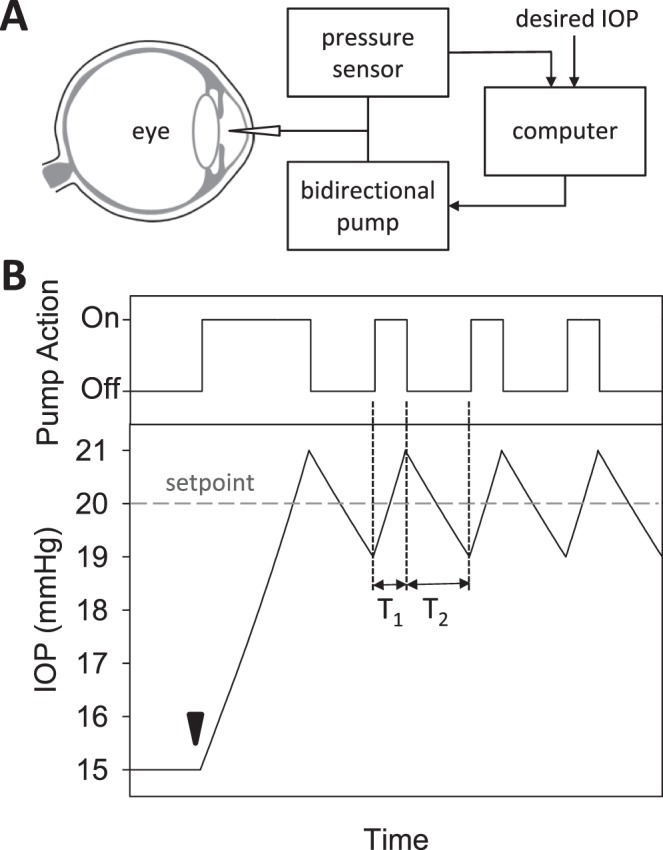
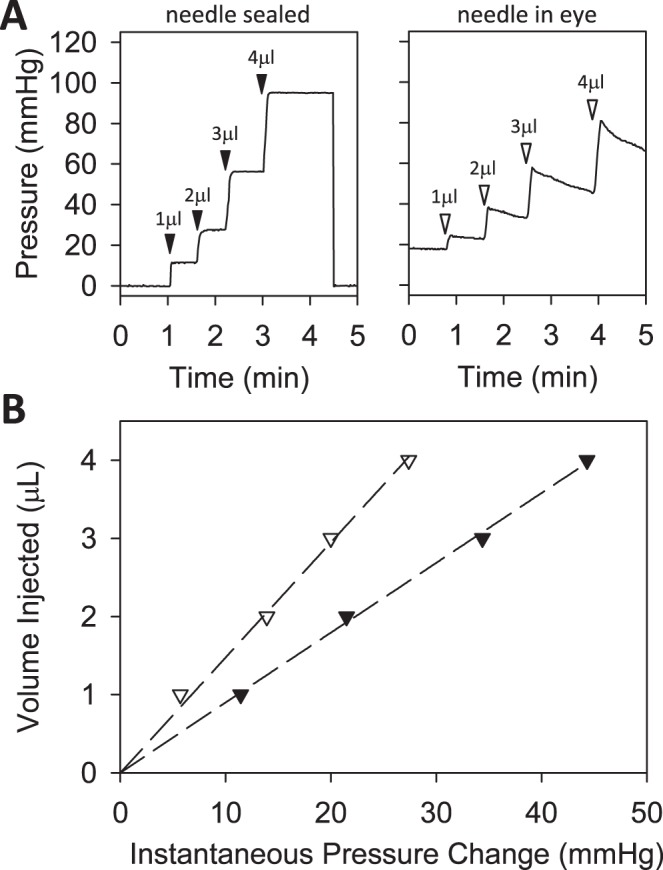
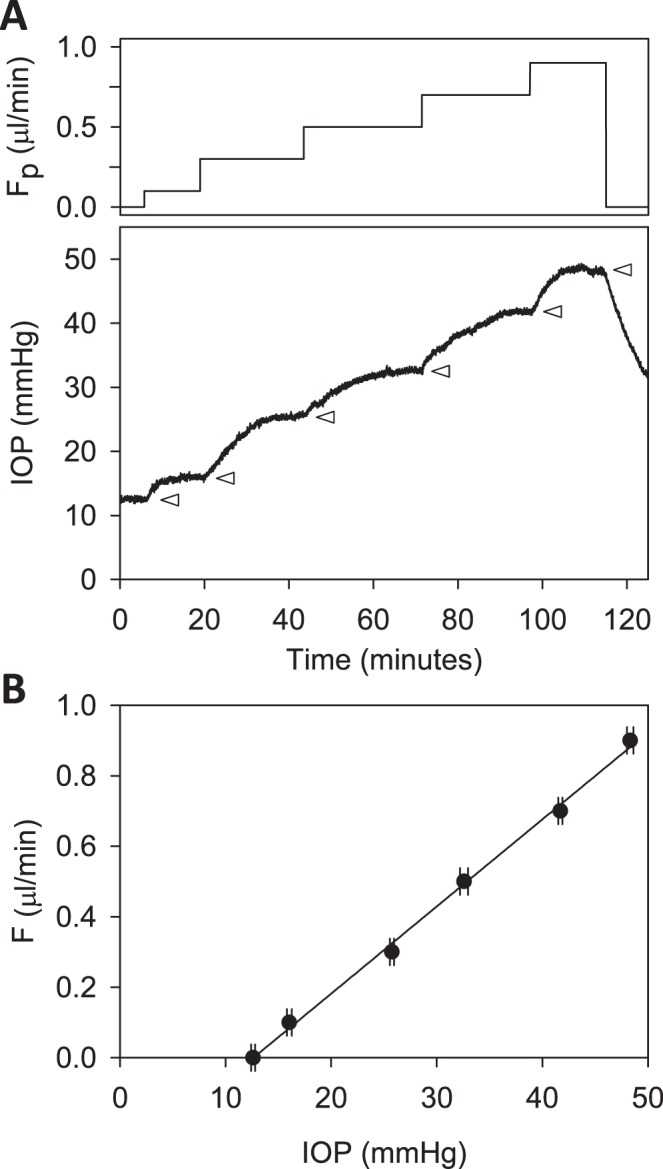
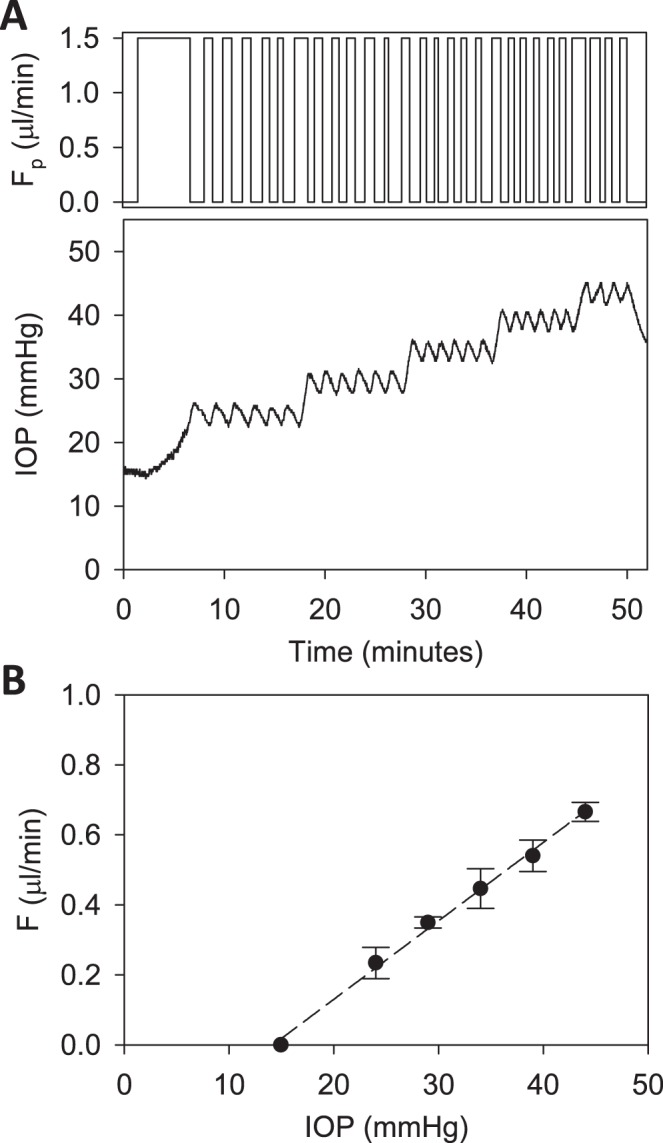
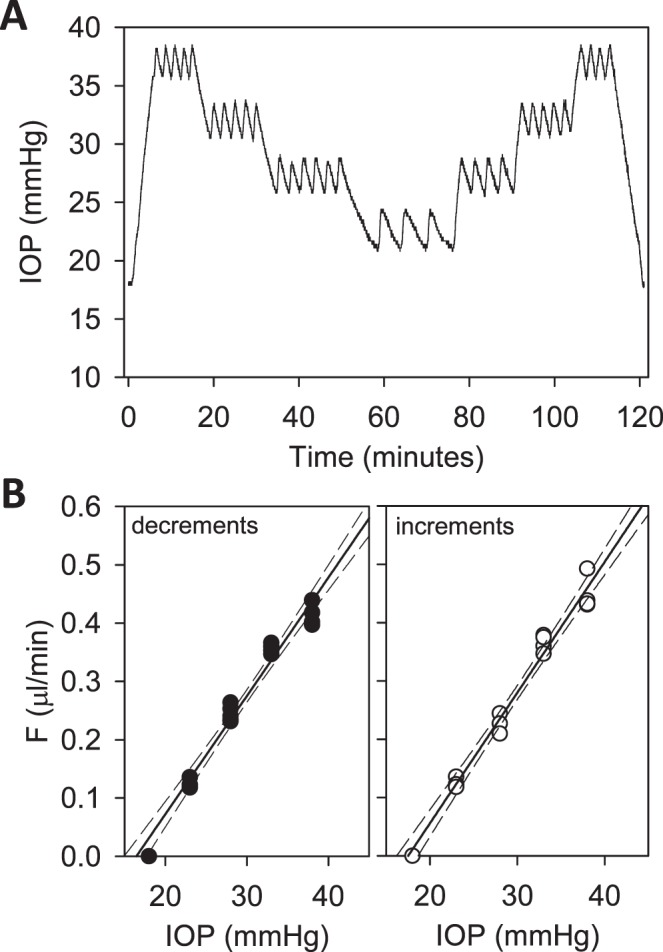
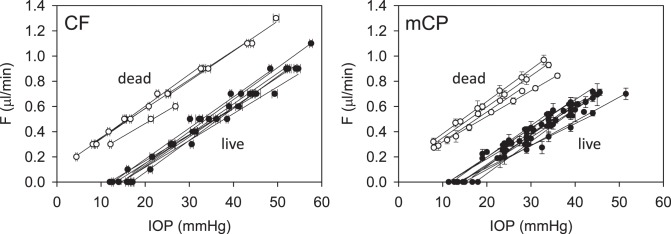
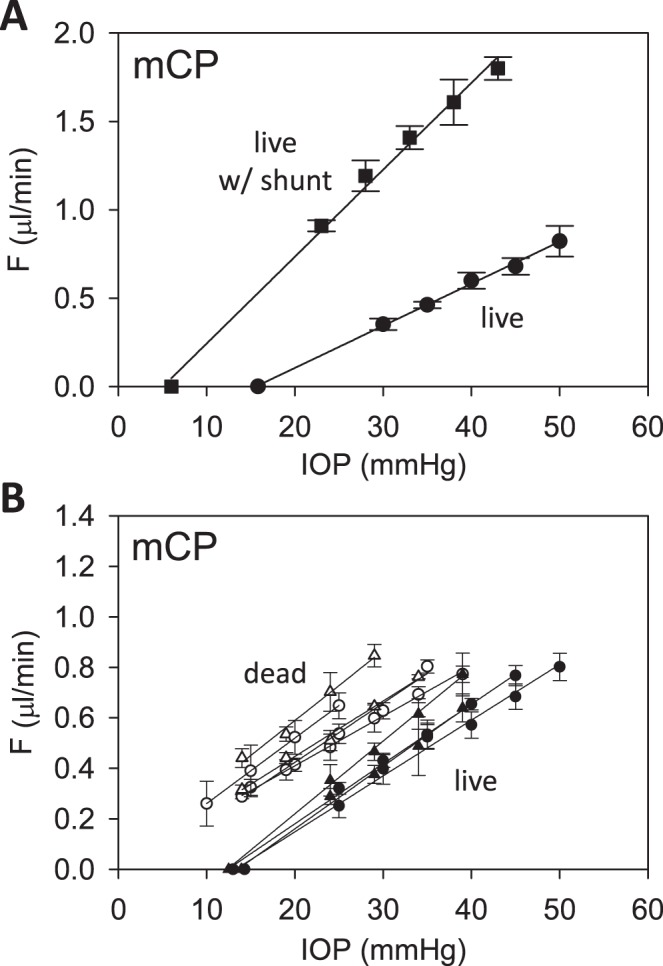
Methods: One eye of 26 anesthetized adult Brown-Norway rats was cannulated with a needle connected to a perfusion pump and pressure transducer. Pressure-flow data were measured in live and dead eyes by varying pump rate (constant-flow technique) or by modulating pump duty cycle to hold intraocular pressure (IOP) at set levels (modified constant-pressure technique). Data were fit by the Goldmann equation to estimate conventional outflow facility (C) and unconventional outflow rate (Fun). Parameter estimates were respectively checked by inserting a shunt of similar conductance into the eye and by varying eye hydration methodology.

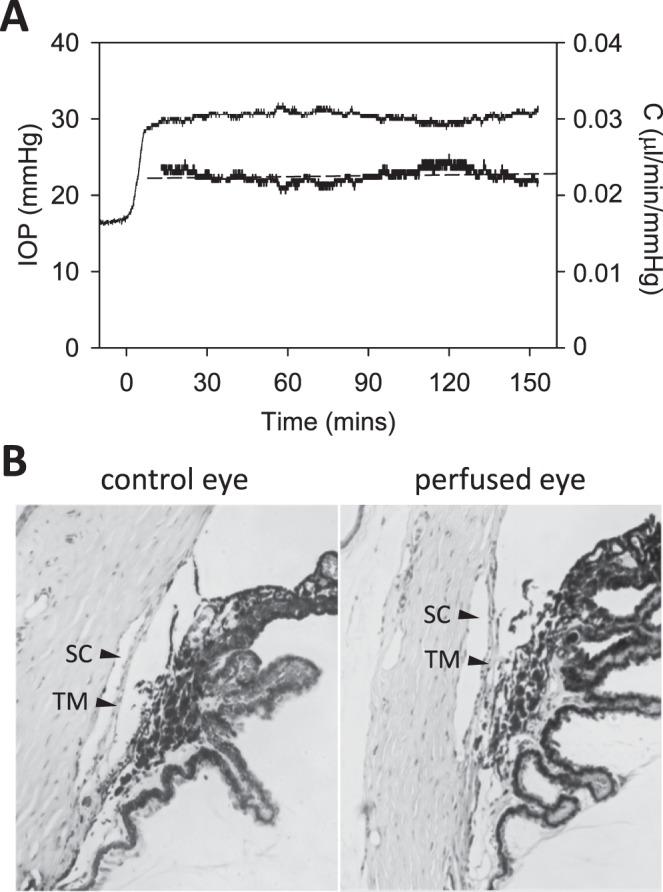
Results: Rat IOP averaged 14.6 ± 1.9 mm Hg at rest. Pressure-flow data were repeatable and indistinguishable for the two perfusion techniques, yielding C = 0.023 ± 0.002 μL/min/mm Hg and Fun = 0.096 ± 0.024 μL/min. C was similar for live and dead eyes and increased upon shunt insertion by an amount equal to shunt conductance, validating measurement accuracy. At 100% humidity Fun dropped to 0.003 ± 0.030 μL/min. Physiological washout was not observed (-0.35 ± 0.65%/h), and trabecular anatomy looked normal.

Conclusions: Rat aqueous humor dynamics are intermediate in magnitude compared to those in mice and humans, consistent with species differences in eye size. C does not change with time or death. Evaporation complicates measurement of Fun even when eyes are not enucleated. Absence of washout is a notable finding seen only in mouse and human eyes to date.


Figures

Figure 1
Figure 1
Modified constant-pressure eye perfusion experiment. (A) Schematic diagram of the perfusion system used to assess aqueous humor dynamics of the rat eye. (B) Conceptual illustration of the behavior of the perfusion pump (top) and IOP (bottom) during the experiment. IOP is initially at rest when a set point of 20 mm Hg is specified by the user (arrowhead). The pump subsequently cycles on and off in order to hold IOP within a 2 mm Hg window of the set point. The window size is also specified by the user. T1 and T2 correspond to the pump on and off duration, respectively.
Figure 2
Figure 2
Perfusion system properties. (A) Pressure signal recorded by system in response to bolus injections of 1, 2, 3, and 4 μL (arrowheads). The system was connected to a 33-gauge needle that was sealed with cyanoacrylate (left) or inserted in the anterior chamber of a rat eye (right). (B) Peak instantaneous pressure versus bolus volume for the closed (filled symbols) and open (unfilled symbols) system. The slope of the regression line fit to the two datasets gives the system compliance (0.089 [0.087, 0.091] μL/mm Hg) and combined ocular and system compliance (0.148 [0.142, 0.154] μL/mm Hg), respectively.
Figure 3
Figure 3
Constant-flow perfusion of a live rat eye. (A) Perfusion rate (top) and IOP response (bottom) are shown for rate increments of 0, 0.1, 0.3, 0.5, 0.7, and 0.9 μL/min. Arrowheads mark the plateau level at which IOP settled after each increment. (B) Plateau IOP versus net eye flow F, which is equivalent to Fpump in a CF experiment. The slope of the regression line fit is outflow facility (C = 0.025 [0.023, 0.027] μL/min/mm Hg), and the y-intercept represents IOP-independent flow (−0.312 [−0.351, −0.273] μL/min).
Figure 4
Figure 4
Modified constant-pressure perfusion of a live rat eye. (A) Perfusion rate (top) and IOP response (bottom) are shown for IOP set points of 25, 30, 35, 40, and 45 mm Hg. (B) IOP set point versus net eye flow F, which equals D·Fpump in a mCP experiment. The pump duty cycle D is the average of all cycles in a set point. The slope of the regression line fit is outflow facility (C = 0.022 [0.020, 0.024] μL/min/mm Hg), and the y-intercept represents IOP-independent flow (−0.318 [−0.361, −0.275] μL/min).
Figure 5
Figure 5
Hysteresis test. (A) IOP of a rat eye was decremented and then incremented in steps of 5 mm Hg between 38 and 23 mm Hg. (B) IOP set point versus flow measured for perfusion rate decrements (left) and increments (right). The respective slopes of the regression line are 0.021 [0.019, 0.023] and 0.022 [0.020, 0.024] μL/min/mm Hg and y-intercepts are −0.334 [−0.387, −0.281] and −0.393 [−0.448, −0.338] μL/min. Dashed lines are 95% confidence intervals on the slope.
Figure 6
Figure 6
Pressure-flow data. Results of all CF (left) and mCP (right) experiments performed on live (filled) and dead (unfilled) rat eyes in situ. Lines are linear regression fits of the data.
Figure 7
Figure 7
Parameter assessment. (A) mCP experiment in which pressure-flow data were collected before (circles) and after (squares) a shunt was inserted through the cornea. Lines are regression fits of the respective datasets (formula image = 0.024 [0.022, 0.026] and formula image = 0.049 [0.045, 0.053] μL/min/mm Hg). Error bars are standard deviation. (B) Pressure-flow data from mCP experiments on live (filled) and dead (unfilled) rats in which the eye was kept moist by a constant saline drip (circles) or by immersion in a saline bath (triangle). Lines are linear regression fits of the data. Error bars are standard deviation.
Figure 8
Figure 8
Washout test. (A) IOP (thin line) and instantaneous outflow facility (thick line) record of a live rat eye perfused for 150 minutes at a constant rate of 0.5 μL/min. Dashed line is a linear regression fit of outflow facility data (slope: 1.1%/h). (B) Thin (4-μm) section of the iridocorneal angle of nonperfused (left) and perfused (right) rat eyes stained with hematoxylin and eosin. TM, trabecular meshwork; SC, Schlemm's canal.

References

    1. Bill A. . The aqueous humor drainage mechanism in the cynomolgus monkey (Macaca irus) with evidence for unconventional routes. . 1965; 4: 911– 919. - PubMed
    1. Bill A. . Conventional and uveo-scleral drainage of aqueous humour in the cynomolgus monkey (Macaca irus) at normal and high intraocular pressures. . 1966; 5: 45– 54. - PubMed
    1. Gong H, Tripathi RC, Tripathi BJ. . Morphology of the aqueous outflow pathway. . 1996; 33: 336– 367. - PubMed
    1. Tamm ER. . The trabecular meshwork outflow pathways: structural and functional aspects. . 2009; 88: 648– 655. - PubMed
    1. Alm A, Nilsson SF. . Uveoscleral outflow—a review. . 2009; 88: 760– 768. - PubMed

Publication types

LinkOut - more resources