. 2018 May 29;23(9):2582-2594.
doi: 10.1016/j.celrep.2018.04.106.

A Batf3/Nlrp3/IL-18 Axis Promotes Natural Killer Cell IL-10 Production during Listeria monocytogenes Infection

Affiliations

A Batf3/Nlrp3/IL-18 Axis Promotes Natural Killer Cell IL-10 Production during Listeria monocytogenes Infection

Sarah E Clark et al. Cell Rep. .

Abstract

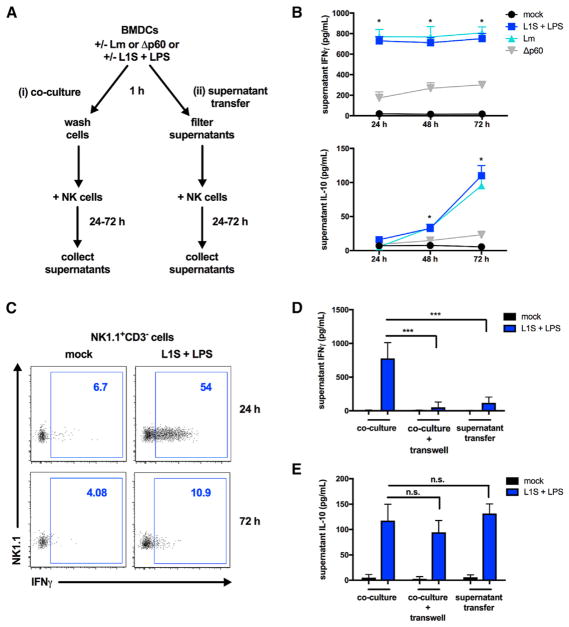
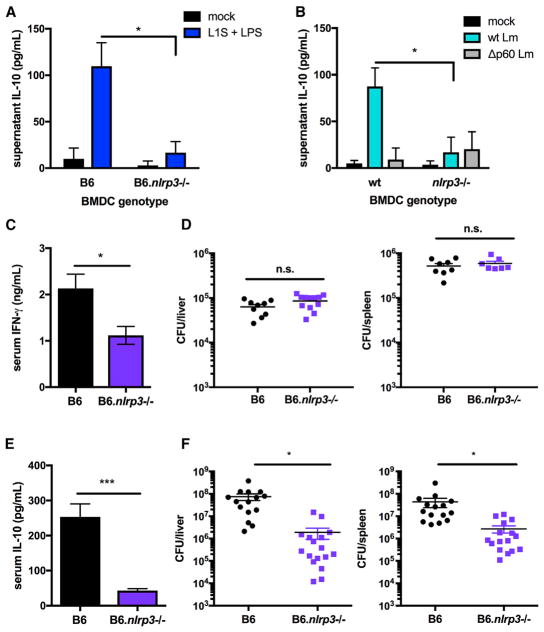
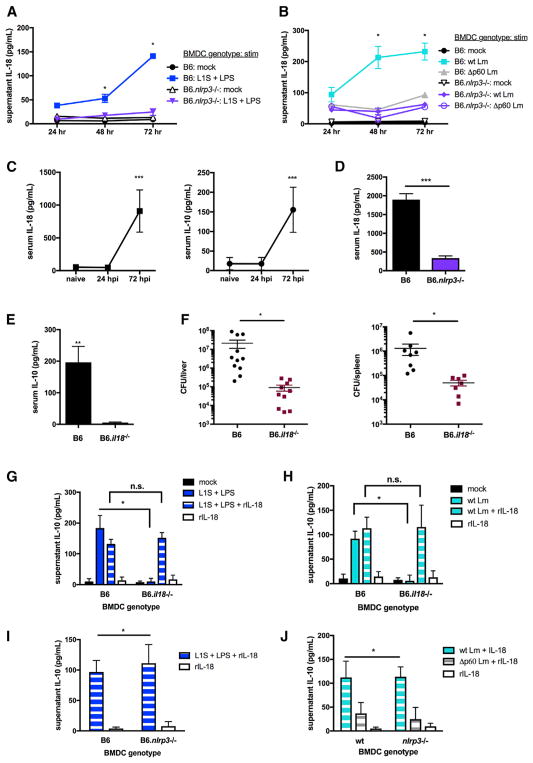
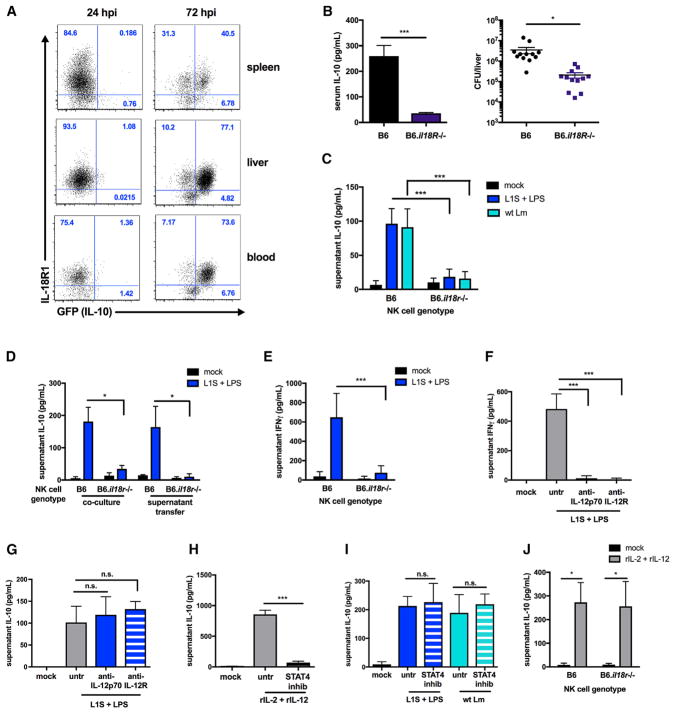
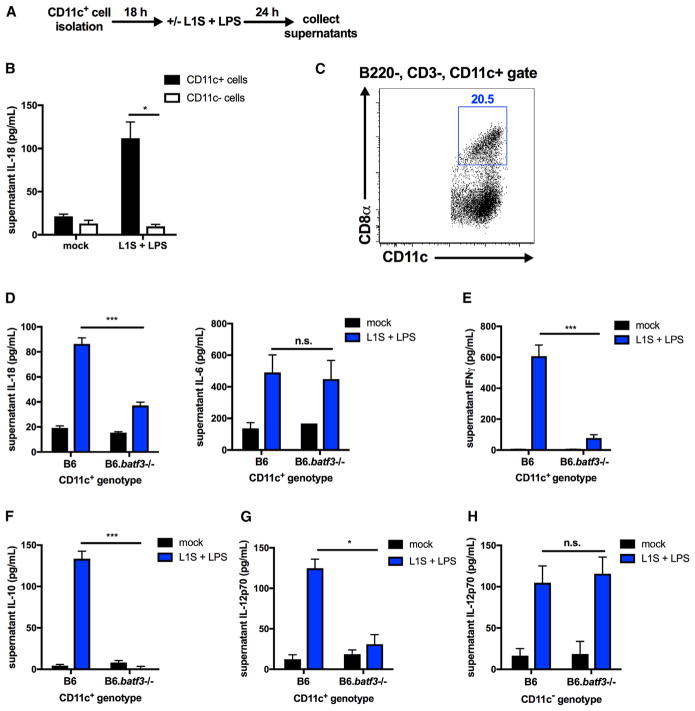
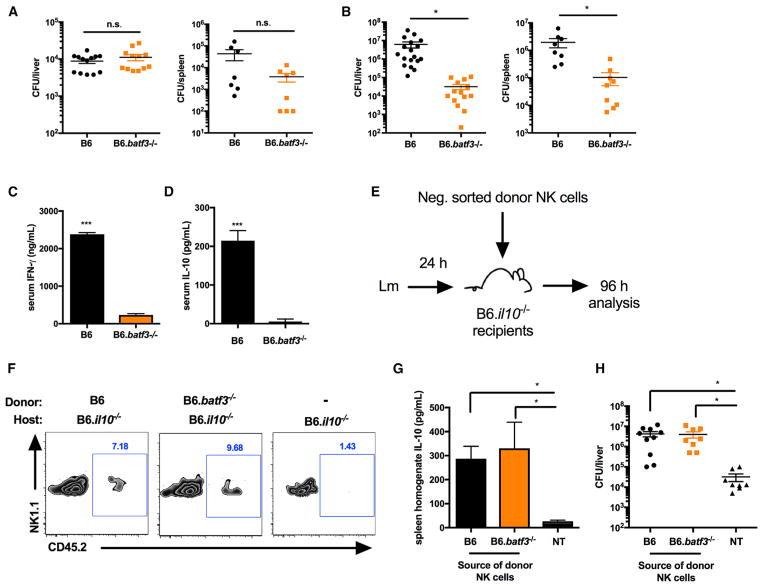
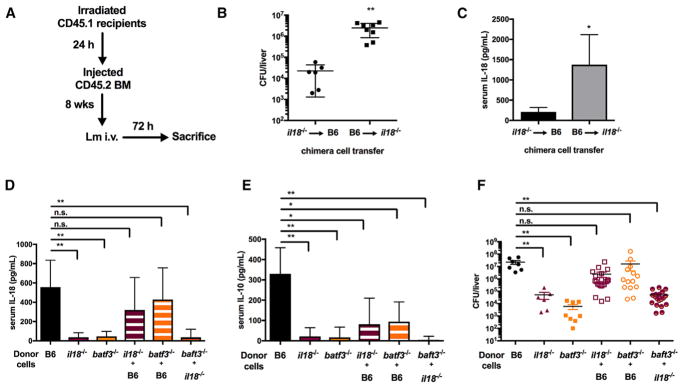
The bacterial pathogen Listeria monocytogenes (Lm) capitalizes on natural killer (NK) cell production of regulatory interleukin (IL)-10 to establish severe systemic infections. Here, we identify regulators of this IL-10 secretion. We show that IL-18 signals to NK cells license their ability to produce IL-10. IL-18 acts independent of IL-12 and STAT4, which co-stimulate IFNγ secretion. Dendritic cell (DC) expression of Nlrp3 is required for IL-18 release in response to the Lm p60 virulence protein. Therefore, mice lacking Nlrp3, Il18, or Il18R fail to accumulate serum IL-10 and are highly resistant to systemic Lm infection. We further show that cells expressing or dependent on Batf3 are required for IL-18-inducing IL-10 production observed in infected mice. These findings explain how Il18 and Batf3 promote susceptibility to bacterial infection and demonstrate the ability of Lm to exploit NLRP3 for the promotion of regulatory NK cell activity.

Keywords: Batf3; Listeria monocytogenes; Natural killer cell; Nlrp3; dendritic cell; immune regulation; infection; innate immunity; interleukin-10; interleukin-18.


Conflict of interest statement

DECLARATION OF INTERESTS

The authors declare no competing interests.

Figures

Figure 1
Figure 1. Soluble Factors from BMDCs Suffice to License NK Cell IL-10 Production
(A) Schematic of the in vitro co-culture and supernatant transfer systems. (B) Supernatant IFNγ and IL-10 detected 24, 48, and 72 hr after NK cell co-culture with L1S+LPS-stimulated or Lm-infected B6.Il10−/− BMDCs (n = 3 independent experiments pooled). (C) Intracellular IFNγ produced by NK1.1+CD3 cells 24 hr and 72 hr after co-culture (representative of n = 3 experiments). (D and E) Supernatant cytokines detected 24 hr (IFNγ, D) or 72 hr (IL-10, E) following NK cell exposure to L1S+LPS-stimulated B6.Il10−/− BMDCs in co-culture with or without separation with a 0.4 μM transwell insert or exposed to filtered supernatants collected 1 hr post-stimulation from BMDCs, as indicated (n = 3 independent experiments pooled). Data are displayed as mean ± SEM; *p < 0.05 and ***p < 0.001 as measured by t test.
Figure 2
Figure 2. NLRP3 Regulates NK Cell IL-10 Production and Increases Susceptibility to Lm
(A and B) Supernatant IL-10 detected from NK cell cultures 72 hr after exposure to filtered supernatants from 1 hr L1S+LPS stimulation (A) or WT or Δp60 Lm infection (B) of B6 or B6.Nlrp3−/− BMDCs (n = 3 independent experiments pooled).(C and D) Serum IFNγ (C) and Lm burdens shown as colony-forming units (CFUs) per organ (D) from B6 or B6.Nlrp3−/− mice sacrificed 24 hpi with 104 Lm i.v. (E and F) Serum IL-10 (E) and Lm burdens per organ (F) from B6 or B6.Nlrp3−/− mice sacrificed 72 hpi (n = 3 independent experiments pooled with 3–5 mice per group for in vivo experiments). Data are displayed as mean ± SEM; *p < 0.05 and ***p < 0.001 as measured by t test.
Figure 3
Figure 3. NLRP3 Regulates IL-18 Release Required for NK Cell IL-10 Production in Response to Lm or L1S+LPS
(A and B) Supernatant IL-18 detected at the indicated times post-stimulation with L1S+LPS (A) or infection with WT or Δp60 Lm (B) of B6 or B6.Nlrp3−/− BMDCs (n = 3 independent experiments pooled). (C) Serum IL-10 and IL-18 detected in uninfected (naive) or Lm-infected (104 i.v.) B6 mice at the indicated time points. (D) Serum IL-18 detected in B6 or B6.Nlrp3−/− mice sacrificed 72 hpi. (E and F) Serum IL-10 (E) and Lm burdens per organ (F) from B6 or B6.Il18−/− mice sacrificed 72 hpi (n = 3 independent experiments pooled with 3–5 mice per group for in vivo experiments). (G and H) Supernatant IL-10 detected in NK cell cultures 72 hr after exposure to filtered supernatants from 1 hr L1S+LPS stimulation (G) or WT or Δp60 Lm infection (H) of B6 or B6.Il18−/− BMDCs with or without 50 pg/mL rIL-18 added to NK cell cultures. (I and J) Supernatant IL-10 detected in NK cell cultures 72 hr after exposure to filtered supernatants from 1 hr L1S+LPS stimulation (I) or WT or Δp60 Lm infection (J) of B6 or B6.Nlrp3−/− BMDCs + 50 pg/mL rIL-18 added to NK cell cultures (n = 3 independent experiments pooled for in vitro experiments). Data are displayed as mean ± SEM; *p < 0.05, **p < 0.01, and ***p < 0.001 as measured by t test.
Figure 4
Figure 4. IL-18 Acts on NK Cells to License IL-10 Secretion Independent of IL-12/STAT4 Signaling
(A) Percentage of NK1.1+CD3− cells from the spleen, liver, and blood positive for IL-18R1 expression from IL-10 GFP+ and IL-10 GFP populations at the indicated time points with 104 Lm i.v. in IL-10 GFP reporter mice (representative of n = 3 experiments with 3–5 mice per group). (B) Serum IL-10 and Lm burdens per liver from B6 or B6.Il18R−/− mice sacrificed 72 hpi (n = 3 independent experiments pooled with 3–5 mice per group). (C) Supernatant IL-10 detected in B6 or B6.Il18R−/− NK cells 72 hr after co-culture with B6.Il10−/− BMDCs stimulated with L1S+LPS or infected with Lm. (D) Supernatant IL-10 detected from B6 or B6.Il18R−/− NK cells 72 hr after co-culture with or exposure to filtered supernatants from B6.Il10−/− BMDCs stimulated with L1S+LPS for 1 hr. (E) Supernatant IFNγ detected in B6 or B6.Il18R−/− NK cells 24 hr after co-culture with B6 BMDCs stimulated with L1S+LPS. (F and G) Supernatant cytokines detected 24 hr (IFNγ, F) or 72 hr (IL-10, G) in NK cells in co-culture with B6.Il10−/− BMDCs stimulated with L1S+LPS with or without 1 μg/mL anti-IL-12p70 or 50 μg/mL anti-IL-12R added with NK cells to co-cultures. (H) Supernatant IL-10 detected 72 hr after stimulation of NK cells with 50 pg/mL rIL-12 + 50 pg/mL rIL-2 with or without 80 μM STAT4 inhibitor lisofylline. (I) Supernatant IL-10 detected at 72 hr from NK cells in co-culture with B6.Il10−/− BMDCs stimulated with L1S+LPS or infected with Lm with or without 80 μM STAT4 inhibitor lisofylline added with NK cells to co-cultures. (J) Supernatant IL-10 detected in B6 or B6.Il18R−/− NK cells 72 hr post-stimulation with 50 pg/mL rIL-12 + 50 pg/mL rIL-2 (n = 3 independent experiments pooled for in vitro experiments). Data are displayed as mean ± SEM; *p < 0.05 and ***p < 0.001 as measured by t test.
Figure 5
Figure 5. Batf3 Expression Licenses DC IL-18 Production in Response to L1S+LPS
(A) Schematic of CD11c+ cell stimulation in vitro. (B) Supernatant IL-18 detected from CD11c+/− cells 24 hr post-stimulation with L1S+LPS (n = 3 independent experiments pooled). (C) CD8α+CD11c+ cells detected by flow cytometry from the B220CD3CD11c+ gate of purified CD11c+ cells (representative of n = 3 experiments). (D) Supernatant IL-18 (left) and IL-6 (right) detected in CD11c+ cells purified from B6 or B6.Batf3−/− mice 24 hr after stimulation with L1S+LPS. (E and F) Supernatant cytokines detected following co-culture of NK cells with B6 or B6.Batf3−/− CD11c+ cells 24 hr after stimulation with L1S+LPS (IFNγ, E) or 72 hr following NK cell exposure to filtered supernatants from B6 or B6.Batf3−/− CD11c+ cells stimulated with L1S+LPS for 1 hr (IL-10, F). (G and H) Supernatant IL-12p70 detected 24 hr after stimulation of B6 or B6.Batf3−/− CD11c+ (G) or CD11c (H) cells with L1S+LPS (n = 3 independent experiments pooled for in vitro experiments). Data are displayed as mean ± SEM; *p < 0.05 and ***p < 0.001 as measured by t test.
Figure 6
Figure 6. Batf3 Expression Promotes Bacterial Expansion during Systemic Lm Infection by Licensing NK Cell IL-10 Secretion
(A and B) Lm burdens per organ of B6 or B6.Batf3−/− mice harvested at 24 hpi (A) or 72 hpi (B) with 104 Lm i.v. (C and D) Serum cytokines detected from B6 or B6.Batf3−/− mice harvested at 24 hpi (IFNγ, C) or 72 hpi (IL-10, D). (E) Schematic of NK cell adoptive transfer. (F) CD3NK1.1+CD45.2+ donor cells (or [−] = no transfer) detected by flow cytometry from the spleens of B6.Il10−/− recipient mice at 96 hpi. (G and H) Total spleen homogenate IL-10 (G) and Lm burdens per livers (H) detected in B6.Il10−/− recipients at 96 hpi. NT, no transfer. Data were pooled from n = 3 independent experiments with 3–5 mice per group. Data are displayed as mean ± SEM; *p < 0.05 and ***p < 0.001 as measured by t test (B–D) or ANOVA (G and H). See also Figure S5.
Figure 7
Figure 7. Batf3-Dependent Cells Are a Vital Source of IL-18 that Regulates NK Cell IL-10 Responses during Lm Infection
(A) Schematic of the bone marrow (BM) chimera experiment. (B and C) Bacterial burdens per liver (B) and serum IL-18 (C) in lethally irradiated B6 versus B6.Il18−/− recipients of B6.Il18−/− or B6 BM, respectively, harvested at 72 hpi with 104 Lm i.v. (n = 2 independent experiments with 3–5 mice per group). (D and E) Serum IL-18 (D) and IL-10 (E) detected in lethally irradiated BM recipients at 72 hpi. (F) Lm burdens per the livers of BM recipients at 72 hpi (data pooled from n = 2 independent experiments with 3–5 mice per group, repeated a third time with similar results). Data are displayed as mean ± SEM; *p < 0.05 and **p < 0.01 as measured by t test (B and C) or ANOVA (D–F).

References

    1. Berg RE, Cordes CJ, Forman J. Contribution of CD8+ T cells to innate immunity: IFN-gamma secretion induced by IL-12 and IL-18. Eur J Immunol. 2002;32:2807–2816. - PubMed
    1. Borg C, Jalil A, Laderach D, Maruyama K, Wakasugi H, Charrier S, Ryffel B, Cambi A, Figdor C, Vainchenker W, et al. NK cell activation by dendritic cells (DCs) requires the formation of a synapse leading to IL-12 polarization in DCs. Blood. 2004;104:3267–3275. - PubMed
    1. Brodsky IE, Palm NW, Sadanand S, Ryndak MB, Sutterwala FS, Flavell RA, Bliska JB, Medzhitov R. A Yersinia effector protein promotes virulence by preventing inflammasome recognition of the type III secretion system. Cell Host Microbe. 2010;7:376–387. - PMC - PubMed
    1. Broz P, Dixit VM. Inflammasomes: mechanism of assembly, regulation and signalling. Nat Rev Immunol. 2016;16:407–420. - PubMed
    1. Carlsson F, Kim J, Dumitru C, Barck KH, Carano RAD, Sun M, Diehl L, Brown EJ. Host-detrimental role of Esx-1-mediated inflammasome activation in mycobacterial infection. PLoS Pathog. 2010;6:e1000895. - PMC - PubMed

Publication types

MeSH terms

LinkOut - more resources