. 2018 May 29;23(9):2758-2769.
doi: 10.1016/j.celrep.2018.04.102.

Identification of Drivers of Aneuploidy in Breast Tumors

Affiliations

Identification of Drivers of Aneuploidy in Breast Tumors

Katherine Pfister et al. Cell Rep. .

Abstract

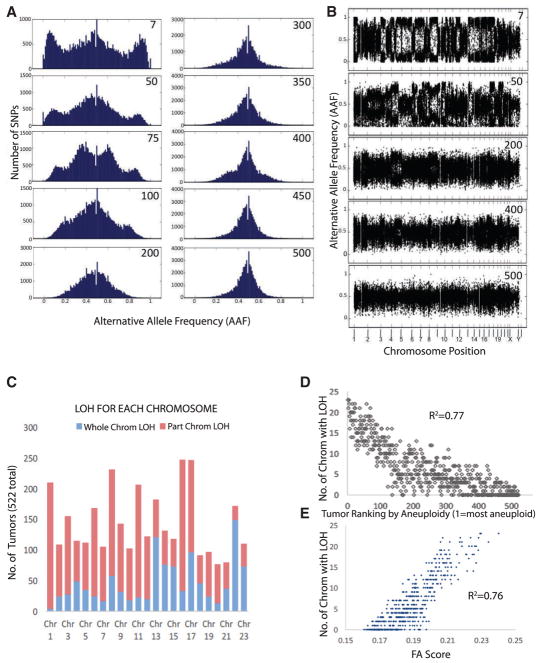
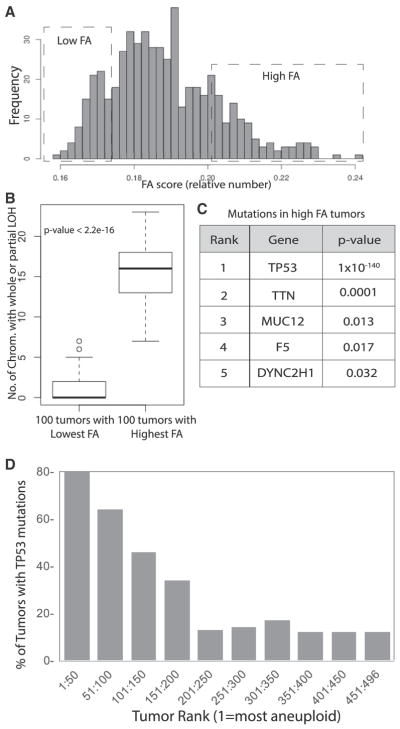
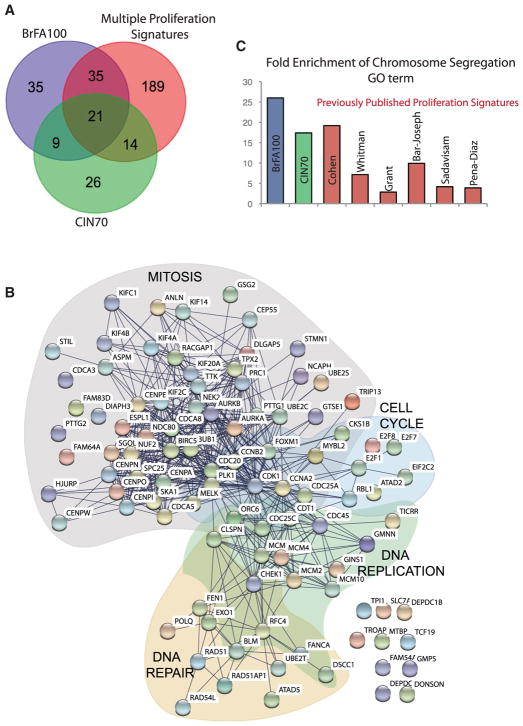
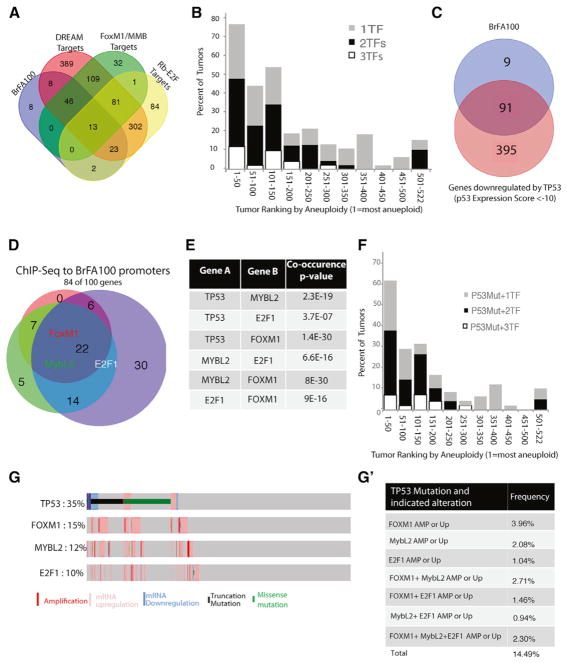
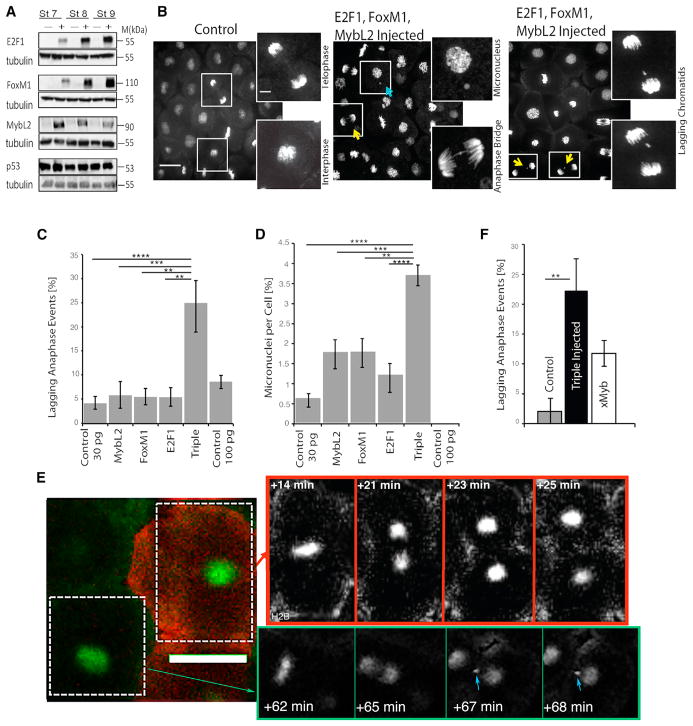
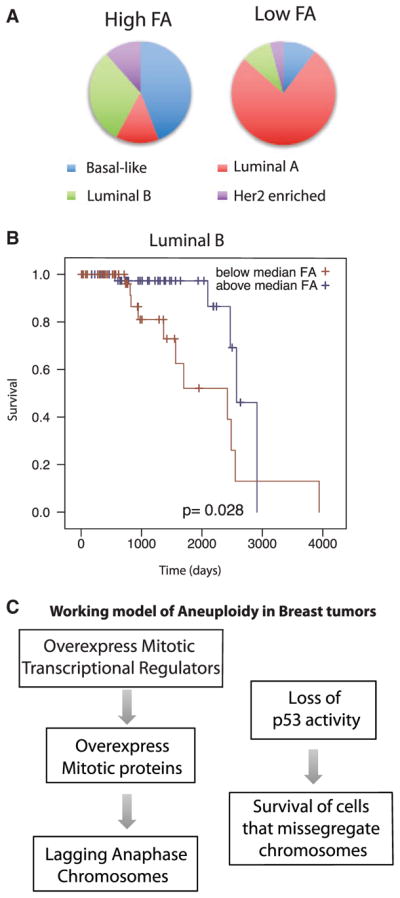
Although aneuploidy is found in the majority of tumors, the degree of aneuploidy varies widely. It is unclear how cancer cells become aneuploid or how highly aneuploid tumors are different from those of more normal ploidy. We developed a simple computational method that measures the degree of aneuploidy or structural rearrangements of large chromosome regions of 522 human breast tumors from The Cancer Genome Atlas (TCGA). Highly aneuploid tumors overexpress activators of mitotic transcription and the genes encoding proteins that segregate chromosomes. Overexpression of three mitotic transcriptional regulators, E2F1, MYBL2, and FOXM1, is sufficient to increase the rate of lagging anaphase chromosomes in a non-transformed vertebrate tissue, demonstrating that this event can initiate aneuploidy. Highly aneuploid human breast tumors are also enriched in TP53 mutations. TP53 mutations co-associate with the overexpression of mitotic transcriptional activators, suggesting that these events work together to provide fitness to breast tumors.

Keywords: LOH; MMB complex; TCGA; aneuploidy; cancer; chromosome instability; genomic instability; mitosis.


Conflict of interest statement

DECLARATION OF INTERESTS

The authors declare no competing interests.

Figures

Figure 1
Figure 1. Measuring the Aneuploidy in Tumors by the Broadening of Allelic Frequency Ratios Calculated from Sequencing Data
(A) 10 examples of FA histograms, each portraying the allelic frequencies of the heterozygous SNPs of human breast tumors. The number in the top right corner of each plot represents the FA ranking based on the broadening of the allele frequency peaks, with 1 being the widest peak and 510 the narrowest peak. Note that the lower the number, the broader the central peak of allelic frequencies. (B) Replots of 5 of the tumors from (A) showing the allele frequency ratios along chromosome positions corresponding to coordinates in the GRCh37 genome (so each chromosome runs p arm to q arm). Note that the LOH events that separate the central peaks into two often span large segments of chromosomes or whole chromosomes, which is consistent with chromosome missegregation driving the LOH event. (C) Plot of the frequency of whole (blue) or partial (red) chromosome LOH for each chromosome. (D and E) The number of chromosomes with an LOH event in breast tumors correlates with the ranking (D) and FA score (E) of the tumors. R2 values were calculated by fitting to a second-order polynomial curve in Excel. Our method of LOH quantification is summarized in Figure S5.
Figure 2
Figure 2. Identification of Genes Mutated in Aneuploid Tumors
(A) Histogram showing the distribution of FA scores of the 522 analyzed human breast tumors. The boxes highlight the distributions of the 100 highest and lowest scoring tumors. (B) The number of chromosomes with LOH events was compared in the 100 highest and lowest aneuploid tumors to demonstrate that the analysis stratifies tumors by aneuploid status. The p value was generated by Welch two-sample t test in R. (C) All genes significantly mutated in the high aneuploid tumor sets were identified by comparing the sequence data from the 100 highest and lowest ranked tumors using the VAAST program. The p values were calculated by VAAST. (D) p53 mutations are correlated with functional aneuploidy in the 250 top ranked tumors.
Figure 3
Figure 3. Regulators of Mitosis Are Overexpressed in Aneuploid Breast Tumors
The 100 most overexpressed genes in the high-FA-ranking tumors (BrFA100) were identified by comparing RNA expression data of the 100 high-FA and low-FA tumors. (A) The overlap of the BrFA100 genes, the CIN70 list, and genes present in 3–6 previously published proliferation signatures (Multiple Proliferation Signatures). (B) STRING diagrams (http://string-db.org) of the BrFA100 list show a highly noded grouping of mitotic regulators, mitotic cell-cycle genes, and DNA replication and repair proteins. The top 10 GO terms of the BrFA100 list shows a strong enrichment of cell-cycle genes, which is driven by a high M-phase gene enrichment (Table S4). (C) Specifically, we plotted the relative fold enrichment of genes in the chromosome segregation GO term in the BrFA100, CIN70, and six different proliferation signatures. See also Table S4.
Figure 4
Figure 4. Mutations in TP53 and Overexpression of E2F1, MYB2L, and FOXM1 Are Highly Associated in Breast Tumors
(A) The overlap of BrFA100 and target genes of mitotic transcriptional regulation complexes DREAM, FoxM1-MuvB/MMB, and Rb-E2F. (B) The percentage of tumors in each group of 50 (ranked by aneuploid status) with 1, 2, or 3 of the transcription factors MYBL2, FOXM1, and E2F1. (C) Venn diagram of the overlap of the BrFA100 with the top 400 genes downregulated by TP53 (p53 expression score of less than −10, as listed in Fischer et al., 2016). (D) Venn diagram to show the overlap of ChIP-seq datasets for E2F1, MYB2L, and FOXM1 with the BrFA100 list. Gene lists are shown in Table S3. (E) Association p values of TP53, E2F1, MYB2L, and FOXM1 as individual pairs. p values were obtained through Fisher exact tests with Benjamini-Hochberg multiple test corrections. (F) The percentage of tumors in each group of 50 that have a TP53 mutation and 1, 2, or 3 overexpressed transcription factors. (G) Association of TP53, MYBL2, E2F1, and FOXM1 in 960 human breast tumors of the TCGA. Plots were generated at the cBioPortal (www.cbioportal.org). (G’) The percentage of the 960 tumors with a TP53 mutation and either an amplification (AMP) of the gene as defined by a positive GISTIC score or an upregulation (Up) of the mRNA as defined by a Z score > 2. TF, transcription factor. See also Table S3.
Figure 5
Figure 5. Overexpression of hE2F1, hFOXM1, and hMYBL2 Is Sufficient to Generate CIN Phenotypes in Xenopus Embryos
(A) 2-cell-stage embryos were injected with either RNA containing stop codon after 33 nt (−) or functional hE2F1, hFoxM1, and hMybL2 (+), as detected by western blot. (B) Representative images of TOPRO-stained normally dividing animal caps and two of the most common CIN phenotypes seen in triple-overexpressing embryos. Yellow arrows indicate a lagging chromatid; blue arrow indicates a micronucleus. (C and D) Quantification of lagging chromatids (C) and micronuclei (D) in control, triply overexpressing, or singly injected embryos through fixed-animal cap analysis. (E) Representative time-lapse series of an animal cap expressing H2B:GFP with normally dividing control cells (co-injected with Ruby-Dextran) or CIN-like phenotypes seen in neighboring triple-overexpressing cells. Blue arrows indicate abnormal divisions seen as lagging chromatids and micronuclei. Time points chosen to show anaphase events. (F) Quantification of lagging chromatid events as seen in time-lapse videos of control embryos, triply overexpressing embryos, and overexpression of only xMYBL2. Full supplemental videos are available upon request. Scale bars represent 40 μm in all images. **p < 0.01; ***p < 0.001; ****p < 0.0001, one-way ANOVA and Bonferroni post-test statistics,. Error bars represent ±SEM. 8 hpf, 8 hr post-fertilization.
Figure 6
Figure 6. Characterization of the Tumors Scored as High and Low FA
(A) Tumor subtype distribution of the 100 tumors scored as the highest FA and lowest FA. (B) Kaplan-Meier curve demonstrating that FA status indicates good prognosis for the luminal B subtype of tumors. (C) Our two-hit model for the generation and propagation of functional aneuploidy; note that we do not indicate which event takes place first.

References

    1. Agresti A. An Introduction to Categorical Data Analysis. 2. Wiley-Interscience Publications; 2007.
    1. Bakhoum SF, Compton DA. Chromosomal instability and cancer: a complex relationship with therapeutic potential. J Clin Invest. 2012;122:1138–1143. - PMC - PubMed
    1. Bakhoum SF, Genovese G, Compton DA. Deviant kinetochore microtubule dynamics underlie chromosomal instability. Curr Biol. 2009;19:1937–1942. - PMC - PubMed
    1. Banerjee B, Kestner CA, Stukenberg PT. EB1 enables spindle microtubules to regulate centromeric recruitment of Aurora B. J Cell Biol. 2014;204:947–963. - PMC - PubMed
    1. Barber TD, McManus K, Yuen KW, Reis M, Parmigiani G, Shen D, Barrett I, Nouhi Y, Spencer F, Markowitz S, et al. Chromatid cohesion defects may underlie chromosome instability in human colorectal cancers. Proc Natl Acad Sci USA. 2008;105:3443–3448. - PMC - PubMed

Publication types

Substances