

NUP155 insufficiency recalibrates a pluripotent transcriptome with network remodeling of a cardiogenic signaling module
- PMID: 29848314
- PMCID: PMC5977756
- DOI: 10.1186/s12918-018-0590-x
NUP155 insufficiency recalibrates a pluripotent transcriptome with network remodeling of a cardiogenic signaling module
Abstract
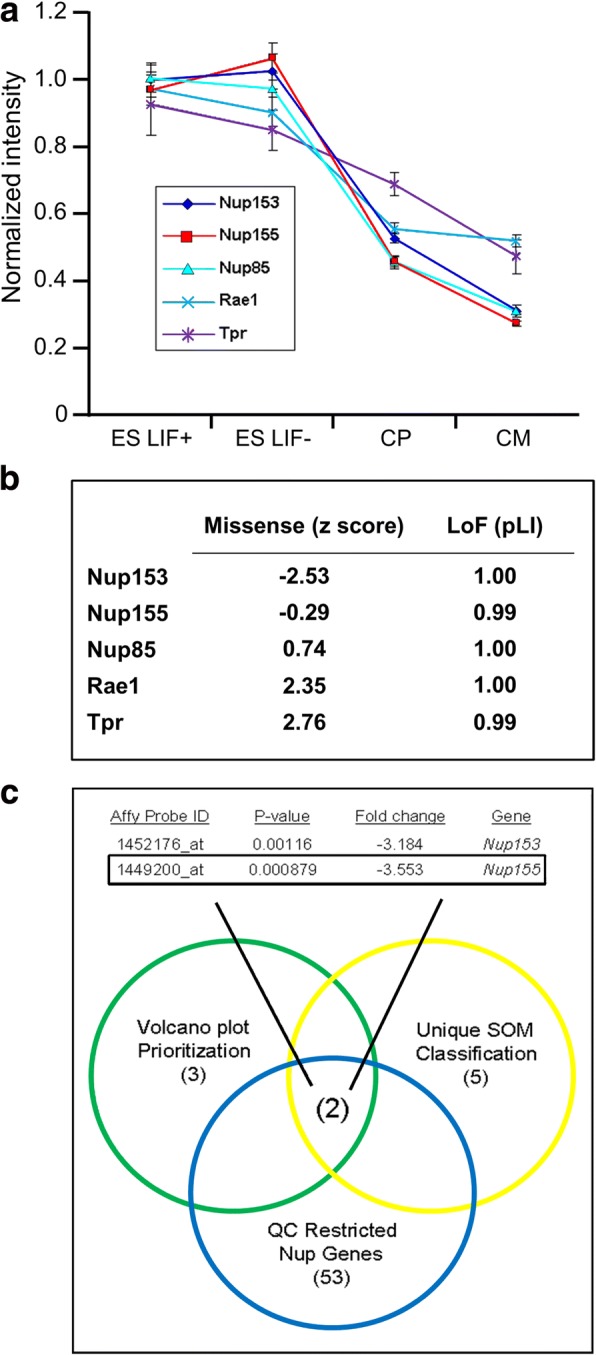
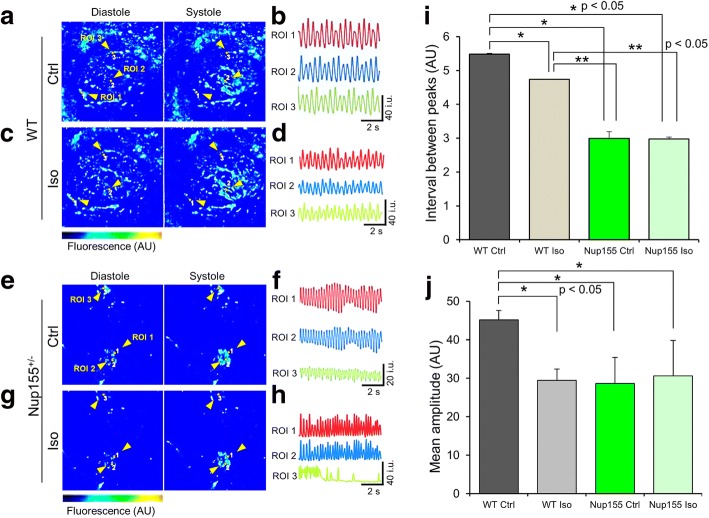
Background: Atrial fibrillation is a cardiac disease driven by numerous idiopathic etiologies. NUP155 is a nuclear pore complex protein that has been identified as a clinical driver of atrial fibrillation, yet the precise mechanism is unknown. The present study employs a systems biology algorithm to identify effects of NUP155 disruption on cardiogenicity in a model of stem cell-derived differentiation.
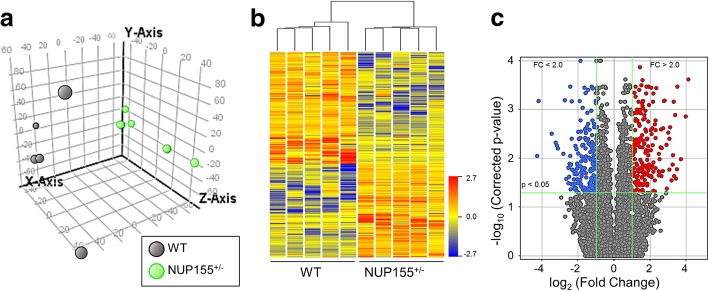
Methods: Embryonic stem (ES) cell lines (n = 5) with truncated NUP155 were cultured in parallel with wild type (WT) ES cells (n = 5), and then harvested for RNAseq. Samples were run on an Illumina HiSeq 2000. Reads were analyzed using Strand NGS, Cytoscape, DAVID and Ingenuity Pathways Analysis to deconvolute the NUP155-disrupted transcriptome. Network topological analysis identified key features that controlled framework architecture and functional enrichment.
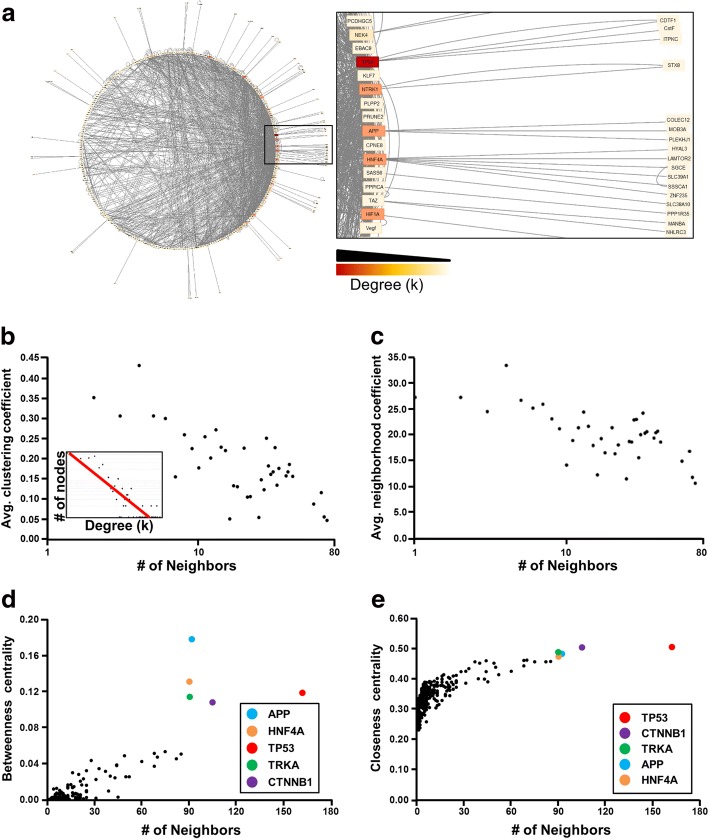
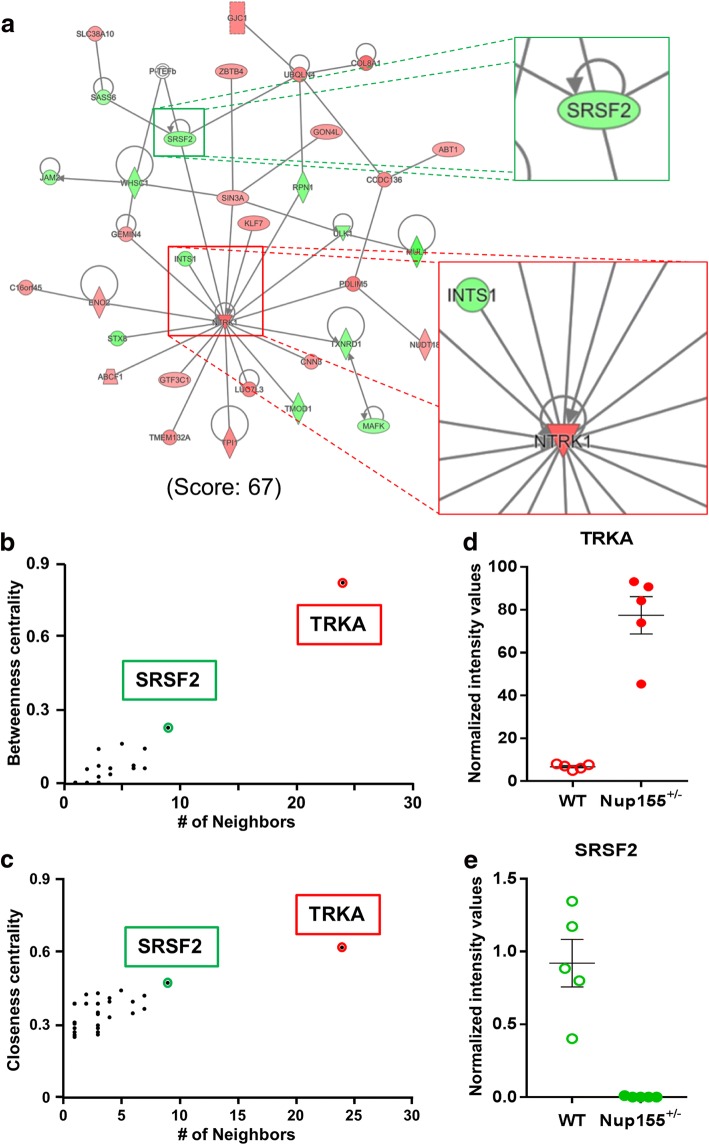
Results: In NUP155 truncated ES cells, significant expression changes were detected in 326 genes compared to WT. These genes segregated into clusters that enriched for specific gene ontologies. Deconvolution of the collective framework into discrete sub-networks identified a module with the highest score that enriched for Cardiovascular System Development, and revealed NTRK1/TRKA and SRSF2/SC35 as critical hubs within this cardiogenic module.
Conclusions: The strategy of pluripotent transcriptome deconvolution used in the current study identified a novel association of NUP155 with potential drivers of arrhythmogenic AF. Here, NUP155 regulates cardioplasticity of a sub-network embedded within a larger framework of genome integrity, and exemplifies how transcriptome cardiogenicity in an embryonic stem cell genome is recalibrated by nucleoporin dysfunction.
Keywords: Atrial fibrillation; Embryonic stem cells; NUP155; Network bioinformatics; RNAseq.
Conflict of interest statement
Ethics approval and consent to participate
Not applicable.
Competing interests
The authors declare that they have no competing interests.
Publisher’s Note
Springer Nature remains neutral with regard to jurisdictional claims in published maps and institutional affiliations.
Figures
Similar articles
-
Nucleoporin insufficiency disrupts a pluripotent regulatory circuit in a pro-arrhythmogenic stem cell line.Sci Rep. 2019 Sep 3;9(1):12691. doi: 10.1038/s41598-019-49147-4. Sci Rep. 2019. PMID: 31481660 Free PMC article.
-
Mutation in nuclear pore component NUP155 leads to atrial fibrillation and early sudden cardiac death.Cell. 2008 Dec 12;135(6):1017-27. doi: 10.1016/j.cell.2008.10.022. Cell. 2008. PMID: 19070573
-
Systems biology surveillance decrypts pathological transcriptome remodeling.BMC Syst Biol. 2015 Jul 17;9:36. doi: 10.1186/s12918-015-0177-8. BMC Syst Biol. 2015. PMID: 26179794 Free PMC article.
-
Protein Subdomain Enrichment of NUP155 Variants Identify a Novel Predicted Pathogenic Hotspot.Front Cardiovasc Med. 2020 Feb 7;7:8. doi: 10.3389/fcvm.2020.00008. eCollection 2020. Front Cardiovasc Med. 2020. PMID: 32118046 Free PMC article.
-
The role of Hippo signaling pathway and mechanotransduction in tuning embryoid body formation and differentiation.J Cell Physiol. 2020 Jun;235(6):5072-5083. doi: 10.1002/jcp.29455. Epub 2020 Jan 17. J Cell Physiol. 2020. PMID: 31951024 Review.
Cited by
-
Nucleoporin insufficiency disrupts a pluripotent regulatory circuit in a pro-arrhythmogenic stem cell line.Sci Rep. 2019 Sep 3;9(1):12691. doi: 10.1038/s41598-019-49147-4. Sci Rep. 2019. PMID: 31481660 Free PMC article.
-
Ten simple rules to create biological network figures for communication.PLoS Comput Biol. 2019 Sep 26;15(9):e1007244. doi: 10.1371/journal.pcbi.1007244. eCollection 2019 Sep. PLoS Comput Biol. 2019. PMID: 31557157 Free PMC article.
-
Interdependent changes of nuclear lamins, nuclear pore complexes, and ploidy regulate cellular regeneration and stress response in the heart.Nucleus. 2023 Dec;14(1):2246310. doi: 10.1080/19491034.2023.2246310. Nucleus. 2023. PMID: 37606283 Free PMC article. Review.
-
Cytoskeletal Protein Variants Driving Atrial Fibrillation: Potential Mechanisms of Action.Cells. 2022 Jan 25;11(3):416. doi: 10.3390/cells11030416. Cells. 2022. PMID: 35159226 Free PMC article. Review.
-
Gene set enrichment analysis and meta-analysis to identify six key genes regulating and controlling the prognosis of esophageal squamous cell carcinoma.J Thorac Dis. 2018 Oct;10(10):5714-5726. doi: 10.21037/jtd.2018.09.55. J Thorac Dis. 2018. PMID: 30505479 Free PMC article.
References
-
- January CT, Wann LS, Alpert JS, Calkins H, Cigarroa JE, Cleveland JC, Jr, et al. 2014 AHA/ACC/HRS guideline for the management of patients with atrial fibrillation: executive summary: a report of the American College of Cardiology/American Heart Association task force on practice guidelines and the Heart Rhythm Society. Circulation. 2014;130(23):2071–2104. doi: 10.1161/CIR.0000000000000040. - DOI - PubMed
Publication types
MeSH terms
Substances
LinkOut - more resources
Full Text Sources
Other Literature Sources
Molecular Biology Databases
Miscellaneous
