. 2018 Jul 2;8(7):2501-2511.
doi: 10.1534/g3.118.200401.

Bayesian Networks Predict Neuronal Transdifferentiation

Affiliations

Bayesian Networks Predict Neuronal Transdifferentiation

Richard I Ainsworth et al. G3 (Bethesda). .

Abstract

We employ the language of Bayesian networks to systematically construct gene-regulation topologies from deep-sequencing single-nucleus RNA-Seq data for human neurons. From the perspective of the cell-state potential landscape, we identify attractors that correspond closely to different neuron subtypes. Attractors are also recovered for cell states from an independent data set confirming our models accurate description of global genetic regulations across differing cell types of the neocortex (not included in the training data). Our model recovers experimentally confirmed genetic regulations and community analysis reveals genetic associations in common pathways. Via a comprehensive scan of all theoretical three-gene perturbations of gene knockout and overexpression, we discover novel neuronal trans-differrentiation recipes (including perturbations of SATB2, GAD1, POU6F2 and ADARB2) for excitatory projection neuron and inhibitory interneuron subtypes.

Keywords: gene regulation network; neuroscience; systems biology.


Figures

Figure 1
Figure 1
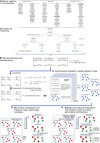
Workflow pipeline. A.ii. Hierarchical clustering of 3,227 quality-filtered single neuron data sets from previous single-nucleus RNA sequencing study. Number of 10-fold up-() and down-regulated (↓) DEGs given at each junction. These are defined as up-regulated in the subsequent left hand branch and down-regulated in the left hand branch each relative to the right hand branch. Terminal clusters I - IV at Level 2 used in this work.(Lake et al. 2016). A.i. 77 ten-fold DEGs (of which 74 are unique) used to train networks. Splits refer to junctions in the hierachical tree in Figure 1 A.ii. Genes in bold occur in multiple splits. B. Data discretization on the weighted arithmetic mean of the log2(TPM) for each gene across 3,203 Level 2 single neurons. Data downsampled to 1,920 samples. C. Structure learning directed acyclic gene reulation networks using the discretized downsampled data with local and global optimization routines. 20 random seeds used to generate 20 different structures. 5 structures randomly chosen for further calculations. D.i. 450,000 random initialisations of the nodes in the continuous interval [0,1] for the 5 network structures. 2 TBN DBN inference performed for each network in each initial state. Converged attractor states subsequently clustered. D.ii. Nodes in 5 network structures initialised in the continuous interval [0,1] corresponding to the four neuronal subtype cell states. For each network structure in each initial state, 2 TBN DBN inference carried out for all 3-gene perturbation combinations (clamping nodes as overexpressed or knocked out for duration of inference). Subsequent node probabilities averaged over the 5 structures for each 3-gene perturbation in each initial state.
Figure 2
Figure 2
Experimental barcodes for clusters I - IV post data processing. For gene expression probabilities 0.5 code displayed as green and for gene expression probabilities <0.5 code displayed as red. Genes that display the same pattern across all four clusters are displayed on the same row. Genes are colored red, purple, green and blue for those expressed in clusters I - IV respectively. DEG that are expressed in both PN subtypes I and II are colored magenta and DEG expressed in both IN subtypes III and IV are colored cyan.
Figure 3
Figure 3
Acceptance criterion for edges that are unfavorable to BIC score during simulated annealing stage of structure learning. Representative temperatures in the range 0.1T20 plotted.
Figure 4
Figure 4
Convergence of ΔBIC (referenced from structure with 1.1M Nsteps) with NSteps (defined as number of steps during simulated annealing phase). Each value is the arithmetic mean over 5 independent structure runs.
Figure 5
Figure 5
Attractor heat map for all 1082 unique attractors of the unperturbed network model. Cell states defined using quaternary intervals 0.000.25,0.250.50,0.500.75,0.751.00 and hierarchically clustered using the heatmap.2 function in R. Basin sizes for the 3 representative cell state clusters A, B and C given in legend.
Figure 6
Figure 6
Merged GRN for 20 independent BN structures. 228 unique edges with frequency >0.40 included (from a total of 870 unique edges summed over all 20 BN). Displayed using Yifan Hu algorithm as implemented in Gephi version 0.9.1. Node size proportional to out-degree and edge width proportional to frequency. Community detection algorithm (Blondel et al. 2008) run with resolution of 1.55. Modularity = 0.421. Number of communities = 4.
Figure 7
Figure 7
The 3 best transdifferentiaion recipes as ranked by RMSD between source cluster I perturbed states and experimental target states. Subplots are target state node probabilities vs. source state node probabilities in the unperturbed (experimental vs. experimental) and perturbed (target experimental vs. source theoretical perturbed) states, represented by cyan and dark blue data points respectively. Best recipes are highlighted in green (overexpression clamp) and red (knockout clamp) and arrows are drawn to show the direction and magnitude of node probability for the given clamp.
Figure 8
Figure 8
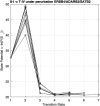
Cell state potential changes along a representative path for a single structure under perturbed conditions. Each line represents a different sampling of the conditional probabilities. The best 3-gene recipe for the interconversion between S-I→ T-IV, ERBB4↑ / ADARB2↑ / SATB2↓, is shown.

References

    1. Adams B. D., Claffey K. P., White B. A., 2009. Argonaute-2 expression is regulated by epidermal growth factor receptor and mitogen-activated protein kinase signaling and correlates with a transformed phenotype in breast cancer cells. Endocrinology 150: 14–23. 10.1210/en.2008-0984 - DOI - PMC - PubMed
    1. Alcamo E. A., Chirivella L., Dautzenberg M., Dobreva G., Farias I., et al. , 2008. Satb2 regulates callosal projection neuron identity in the developing cerebral cortex. Neuron 57: 364–377. 10.1016/j.neuron.2007.12.012 - DOI - PubMed
    1. Amamoto R., Arlotta P., 2014. Development-inspired reprogramming of the mammalian central nervous system. Science 343: 1239882 10.1126/science.1239882 - DOI - PMC - PubMed
    1. Blondel V. D., Guillaume J.-L., Lambiotte R., Lefebvre E., 2008. Fast unfolding of communities in large networks. J. Stat. Mech. 2008: P10008 10.1088/1742-5468/2008/10/P10008 - DOI
    1. Britanova O., de Juan Romero C., Cheung A., Kwan K. Y., Schwark M., et al. , 2008. Satb2 is a postmitotic determinant for upper-layer neuron specification in the neocortex. Neuron 57: 378–392. 10.1016/j.neuron.2007.12.028 - DOI - PubMed