. 2018 Jun 12;115(24):6297-6302.
doi: 10.1073/pnas.1801351115. Epub 2018 May 30.

Navigation of brain networks

Affiliations

Navigation of brain networks

Caio Seguin et al. Proc Natl Acad Sci U S A. .

Abstract

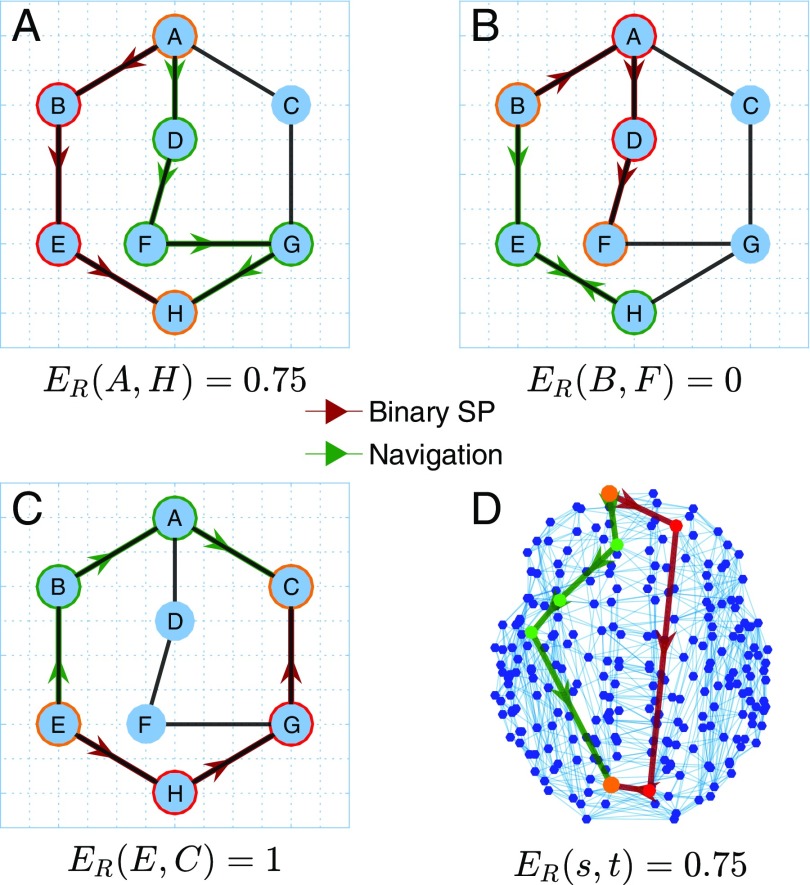
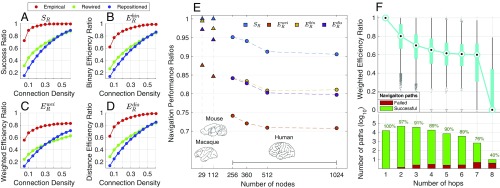
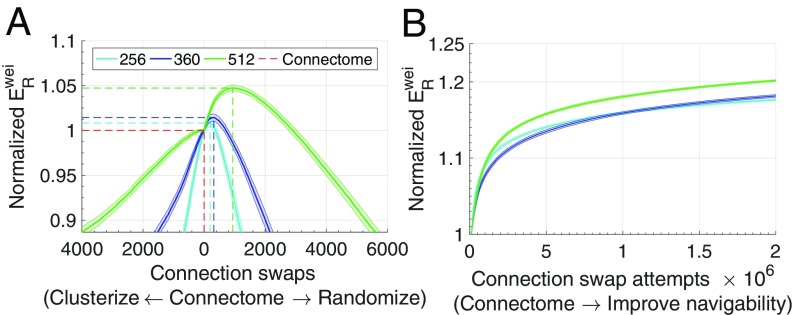
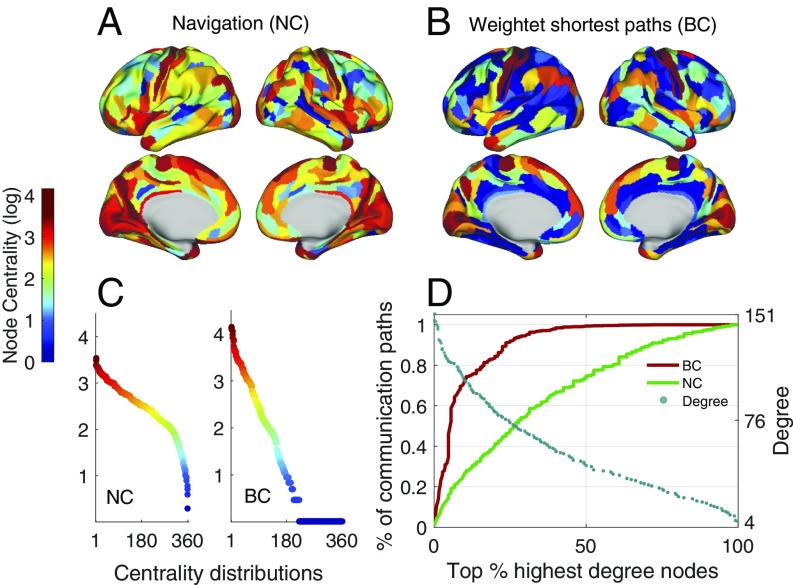
Understanding the mechanisms of neural communication in large-scale brain networks remains a major goal in neuroscience. We investigated whether navigation is a parsimonious routing model for connectomics. Navigating a network involves progressing to the next node that is closest in distance to a desired destination. We developed a measure to quantify navigation efficiency and found that connectomes in a range of mammalian species (human, mouse, and macaque) can be successfully navigated with near-optimal efficiency (>80% of optimal efficiency for typical connection densities). Rewiring network topology or repositioning network nodes resulted in 45-60% reductions in navigation performance. We found that the human connectome cannot be progressively randomized or clusterized to result in topologies with substantially improved navigation performance (>5%), suggesting a topological balance between regularity and randomness that is conducive to efficient navigation. Navigation was also found to (i) promote a resource-efficient distribution of the information traffic load, potentially relieving communication bottlenecks, and (ii) explain significant variation in functional connectivity. Unlike commonly studied communication strategies in connectomics, navigation does not mandate assumptions about global knowledge of network topology. We conclude that the topology and geometry of brain networks are conducive to efficient decentralized communication.

Keywords: complex networks; connectome; network navigation; neural communication.


Conflict of interest statement

The authors declare no conflict of interest.

Figures

Fig. 1.
Fig. 1.
Illustrative examples of navigation (green) and shortest (red) paths from a source to the target node (circled in orange) in a binary network. Grid indicates spatial embedding of the networks. Efficiency ratios (ER(i,j)) are the ratio of the number of hops in the navigation path to the number of hops in the shortest path. (A) The shortest path between A and H has three hops (A-B-E-H) while navigation leads to a four-hop path (A-D-F-G-H). Navigation routes information from A to H at 75% of optimal efficiency. (B) Navigation fails to find a path from B to F, becoming trapped between E and H. (C) Both strategies lead to three-hop paths, and navigation routes information from G to B at 100% of optimal efficiency. (D) Example of a successful navigation path in the human connectome that achieves 75% efficiency.
Fig. 2.
Fig. 2.
Navigability of mammalian connectomes. (A–D) Success ratio (SR), binary efficiency ratio (ERbin), weighted efficiency ratio (ERwei), and distance efficiency ratio (ERdis) for human connectomes (N=360) at several connection density thresholds. Empirical measures (red) for group-averaged connectomes were compared with 1,000 rewired (green) and spatially repositioned (blue) null networks. Shading indicates 95% confidence intervals. (E) The same performance metrics shown across different parcellation resolutions of mammalian structural networks (SR shown in blue, ERwei in orange, ERbin in yellow, and ERdis in purple). Triangles denote nonhuman species while circles denote human data. Dashed lines denote the same connection density (15%) across all human networks. (F) Navigability stratified by hop count (N=360 at 15% connection density). Blue box plots indicate the quartiles of ERwei navigation paths benchmarked against shortest paths with matching hop count. Bar plots show the number of shortest paths for a given hop count, with colors indicating the proportion of successful (green) and failed (red) navigation paths. Brain diagrams reproduced from ref. , with permission from Elsevier.
Fig. 3.
Fig. 3.
Navigation performance (ERwei) of progressively rewired connectome topologies (at 15% connection density). The ERwei of rewired topologies was normalized by the empirical value found for the human connectome. Curves indicate the mean values (inner line) and 95% confidence intervals (outer shadow) obtained from several runs of the rewiring routines. (A) Normalized ERwei of clusterized and randomized networks for 100 runs of the randomization–clusterizing procedure and different parcellation resolutions. Dashed lines show performance peaks (vertical axis) and number of connection swaps (horizontal axis), with red indicating the values obtained for the empirical brain. (B) Normalized ERwei obtained from direct optimization of the connectome’s empirical ERwei, as a function of connection swap attempts, for 50 (N=256), 50 (N=360), and 30 (N=512) independent rewiring runs.
Fig. 4.
Fig. 4.
Comparison between navigation (NC) and weighted betweenness (BC) node centralities for N=360 at 15% connection density. Centrality values are logarithmically scaled. (A and B) NC (A) and BC (B) projected onto the cortical surface. (C) NC (Left) and BC (Right) sorted from highest to lowest values. (D) Relationship between the cumulative sum of centrality measures and degree. The horizontal axis is a percentage ranking of nodes from highest to lowest degree (e.g., for N=360, the 10% most connected nodes are the 36 nodes with highest degree). Solid curves (left-hand vertical axis) represent the cumulative sum of BC (red) and NC (green) over all nodes ordered from most to least connected, divided by the total number of communication paths in the network, indicating the fraction of communication paths mediated by nodes. Blue dots (right-hand vertical axis) show the original degree associated with each percentage of most-connected nodes.

Comment in

References

    1. Watts DJ, Strogatz SH. Collective dynamics of ‘small-world’ networks. Nature. 1998;393:440–442. - PubMed
    1. Bassett DS, Bullmore E. Small-world brain networks. Neuroscientist. 2006;12:512–523. - PubMed
    1. Meunier D, Lambiotte R, Bullmore ET. Modular and hierarchically modular organization of brain networks. Front Neurosci. 2010;4:200. - PMC - PubMed
    1. van den Heuvel MP, Kahn RS, Goñi J, Sporns O. High-cost, high-capacity backbone for global brain communication. Proc Natl Acad Sci USA. 2012;109:11372–11377. - PMC - PubMed
    1. Oh SW, et al. A mesoscale connectome of the mouse brain. Nature. 2014;508:207–214. - PMC - PubMed

Publication types

LinkOut - more resources