. 2018 Jun 12;115(24):E5614-E5623.
doi: 10.1073/pnas.1719433115. Epub 2018 May 30.

A theta rhythm in macaque visual cortex and its attentional modulation

Affiliations

A theta rhythm in macaque visual cortex and its attentional modulation

Georgios Spyropoulos et al. Proc Natl Acad Sci U S A. .

Abstract

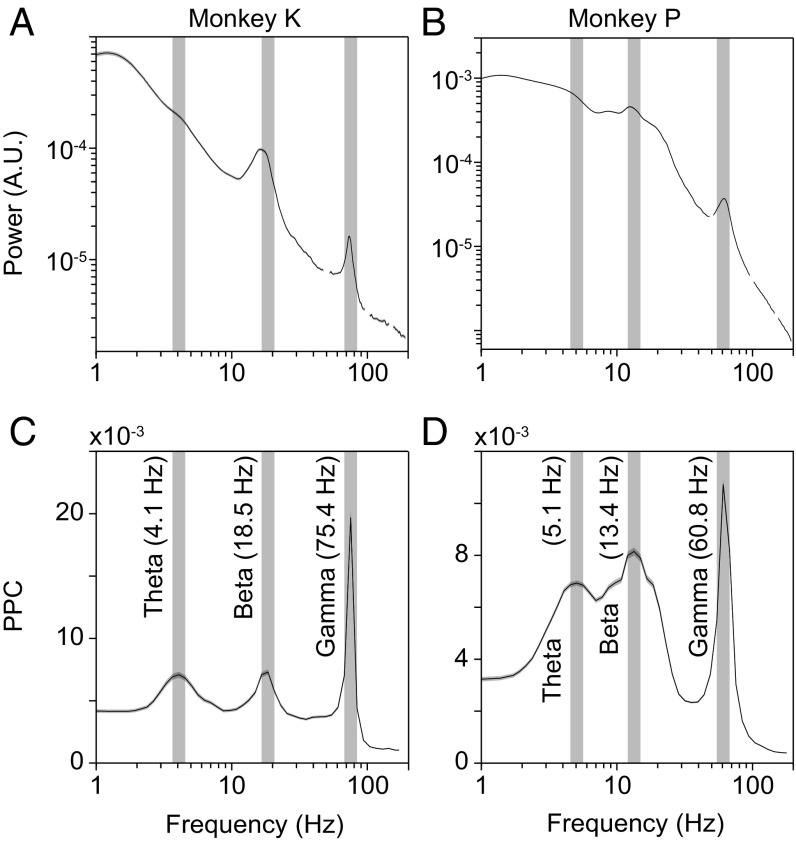
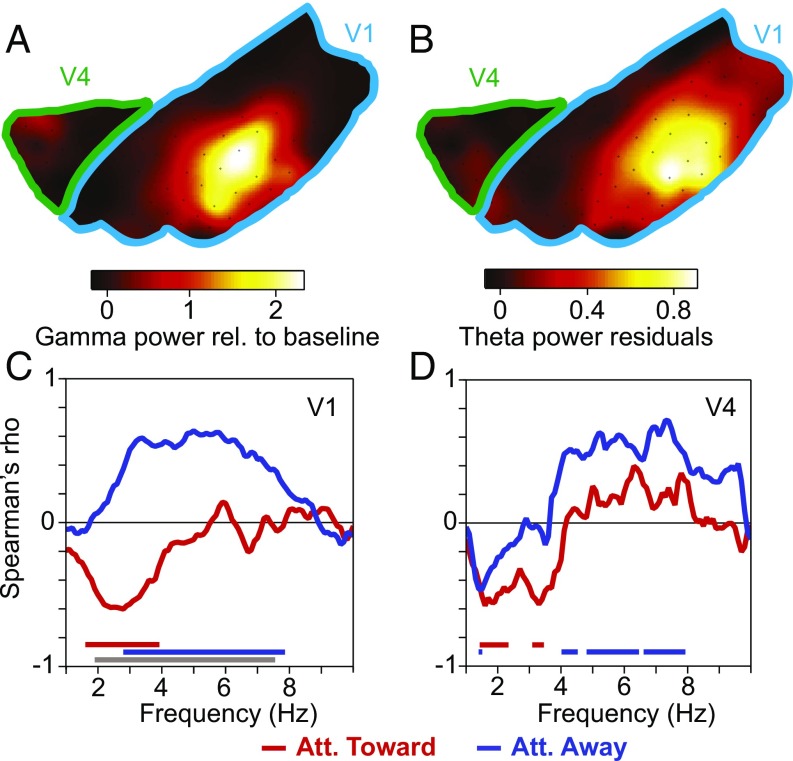
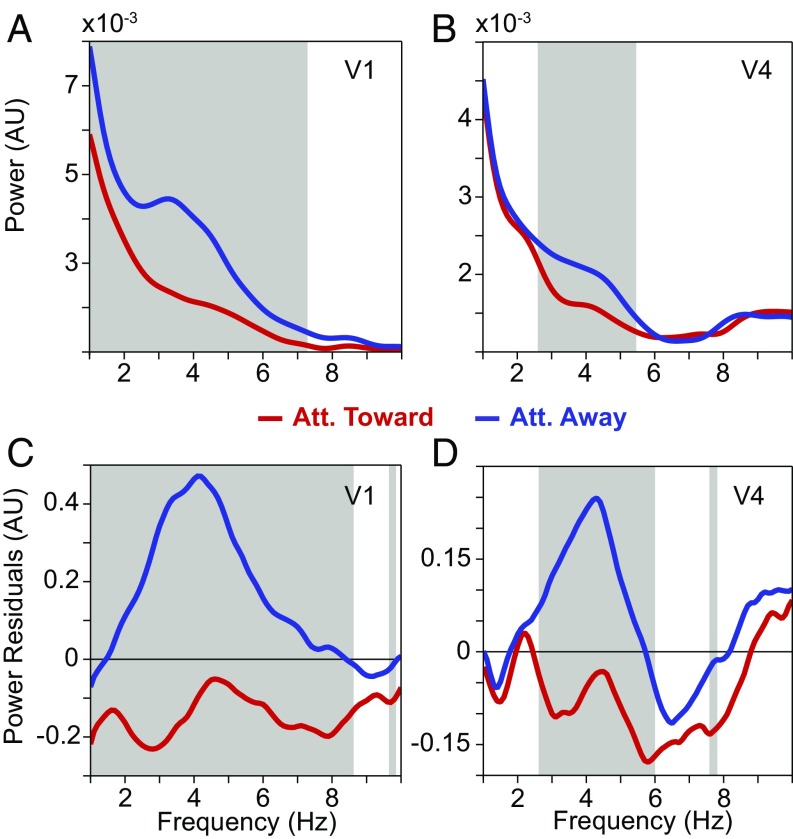
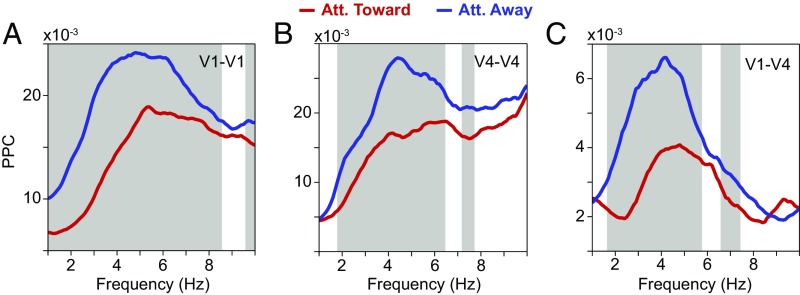
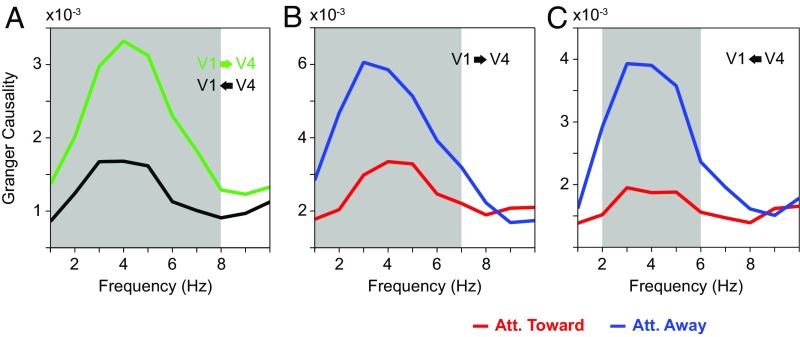
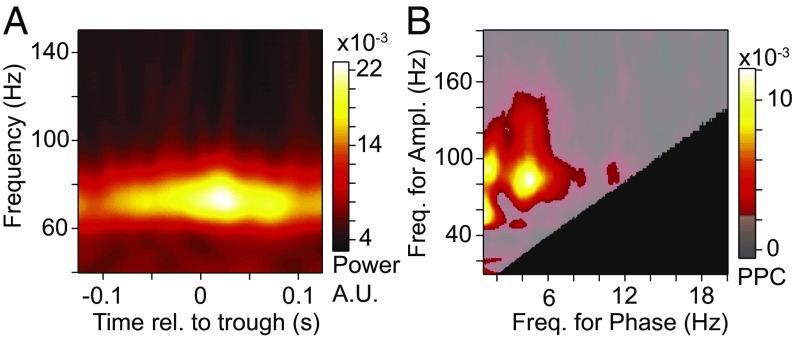
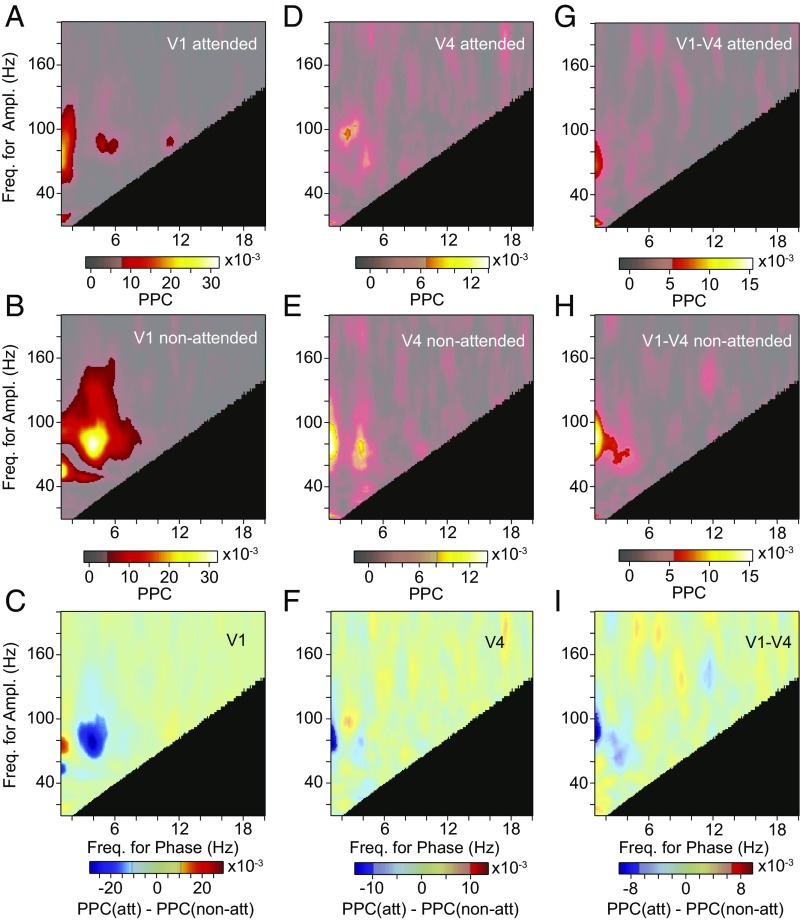
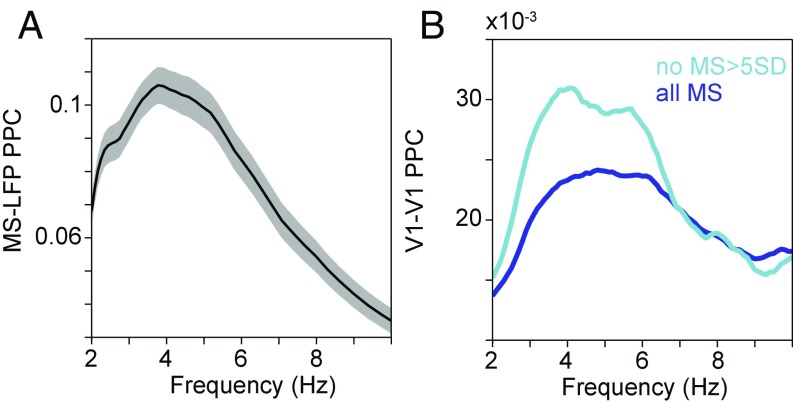
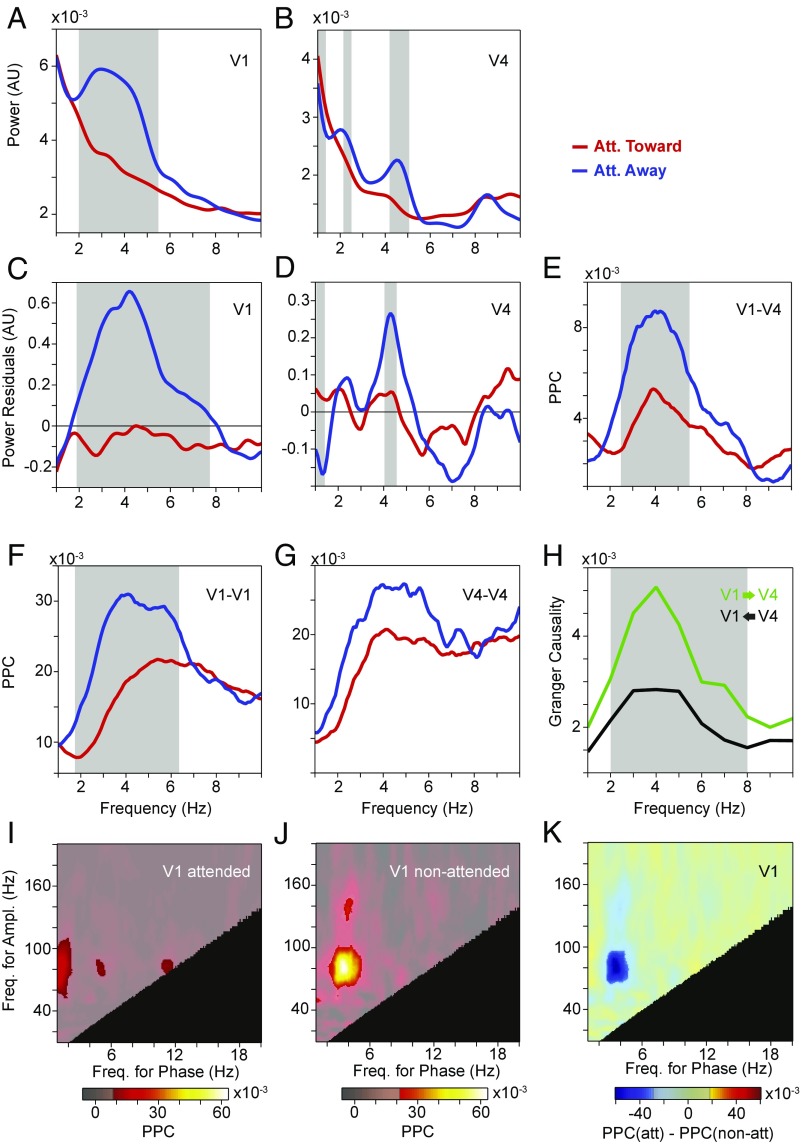
Theta rhythms govern rodent sniffing and whisking, and human language processing. Human psychophysics suggests a role for theta also in visual attention. However, little is known about theta in visual areas and its attentional modulation. We used electrocorticography (ECoG) to record local field potentials (LFPs) simultaneously from areas V1, V2, V4, and TEO of two macaque monkeys performing a selective visual attention task. We found a ≈4-Hz theta rhythm within both the V1-V2 and the V4-TEO region, and theta synchronization between them, with a predominantly feedforward directed influence. ECoG coverage of large parts of these regions revealed a surprising spatial correspondence between theta and visually induced gamma. Furthermore, gamma power was modulated with theta phase. Selective attention to the respective visual stimulus strongly reduced these theta-rhythmic processes, leading to an unusually strong attention effect for V1. Microsaccades (MSs) were partly locked to theta. However, neuronal theta rhythms tended to be even more pronounced for epochs devoid of MSs. Thus, we find an MS-independent theta rhythm specific to visually driven parts of V1-V2, which rhythmically modulates local gamma and entrains V4-TEO, and which is strongly reduced by attention. We propose that the less theta-rhythmic and thereby more continuous processing of the attended stimulus serves the exploitation of this behaviorally most relevant information. The theta-rhythmic and thereby intermittent processing of the unattended stimulus likely reflects the ecologically important exploration of less relevant sources of information.

Keywords: attention; gamma; phase-amplitude coupling; theta; visual cortex.


Conflict of interest statement

The authors declare no conflict of interest.

Figures

Fig. 1.
Fig. 1.
Average power and phase locking spectra for the two macaques. (A) Average power spectrum of the ECoG LFP in V1, V2, V4, and TEO for monkey K. Data around 50 Hz and harmonics were affected by line noise and are therefore masked. (B) Same as A, but for monkey P. (C) Average phase locking (PPC) spectrum across all possible site pairs within and between V1, V2, V4, and TEO for monkey K. (D) Same as C, but for monkey P. The error regions (hardly visible for A and B) show the 95% confidence interval based on a bootstrap procedure across data epochs. Vertical gray bars are shown at the peaks of the two macaques’ respective PPC spectra and are copied into A and B. A.U., arbitrary units.
Fig. 2.
Fig. 2.
The theta rhythm coextends with the visually induced gamma rhythm. (A) Visually induced LFP gamma-band power, as a function of spatial location in V1–V2 (indicated by blue outline) and V4–TEO (indicated by green outline). (B) Same as A, but showing LFP theta-band power after removing the 1/fn component. (C) Correlation between (i) visually induced gamma-band power and (ii) the power (1/fn removed) at the frequency indicated on the x axis, across sites in V1–V2. Colored lines on the bottom indicate frequencies with significant correlations with attention toward (red) or away from (blue) the activating stimulus (P < 0.05; nonparametric permutation test with correction for multiple comparisons across frequencies). The gray line on the bottom indicates frequencies with a significant difference in correlation between the attention conditions (same test). (D) Same as C, but for area V4. Att., attention.
Fig. 3.
Fig. 3.
Average low-frequency LFP power spectra and their modulation by selective attention. (A) Average LFP power spectra in area V1 with attention toward (red) and away (blue) from the activating stimulus. The gray-shaded region indicates frequencies with a significant difference between attention conditions (P < 0.05; nonparametric permutation test with correction for multiple comparisons across frequencies). (B) Same as A, but for area V4. (C) Same as A, but showing the power residuals after removing the 1/fn component of the power spectrum through robust regression (Methods). (D) Same as C, but for area V4. Att., attention; A.U., arbitrary units.
Fig. 4.
Fig. 4.
Average low-frequency LFP phase-locking (PPC) spectra and their modulation by selective attention. (A) Average LFP phase locking between sites within area V1 with attention toward (red) and away from (blue) the activating stimulus. The gray-shaded region indicates frequencies with a significant difference between attention conditions (P < 0.05; nonparametric permutation test with correction for multiple comparisons across frequencies). (B) Same as A, but between sites within area V4. (C) Same as A, but between sites in area V1 and sites in area V4. Att., attention.
Fig. 5.
Fig. 5.
Average low-frequency GC spectra between V1 and V4 sites. (A) Average GC-influence spectra between V1 and V4 in the feedforward (green) and feedback directions (black). The gray-shaded regions indicate frequencies with a significant difference between bottom-up and top-down (P < 0.05; nonparametric permutation test with correction for multiple comparisons across frequencies). (B) Average GC-influence spectra between V1 and V4 in the feedforward direction, with attention toward (red) and away from (blue) the activating stimulus. The gray-shaded regions indicate frequencies with a significant difference between attention conditions (P < 0.05; nonparametric permutation test with correction for multiple comparisons across frequencies). (C) Same as B, but for the feedback direction. Att., attention.
Fig. 6.
Fig. 6.
Theta–gamma PAC in visual cortex. (A) LFP power of one example site in the 40- to 150-Hz range (y axis) as a function of time relative to the theta trough (x axis). (B) Grand-average PAC as a function of the frequency defining the power (y axis) and the frequency defining the phase (x axis). The semitransparent gray mask exposes frequency pairs with significant PAC (P < 0.05; nonparametric permutation test with correction for multiple comparisons across frequency pairs). The black area indicates frequency pairs excluded from the analysis (Methods). Ampl., amplitude; Freq., frequency; rel., relative.
Fig. 7.
Fig. 7.
Modulation of PAC by selective attention. (A and B) Average PAC in area V1 with attention toward (A) and away from (B) the activating stimulus. (C) Average PAC difference in area V1 between the two attention conditions shown in A and B. The semitransparent gray mask exposes frequency pairs with significant PAC or PAC difference, respectively (P < 0.05; nonparametric permutation test with correction for multiple comparisons across frequency pairs). The black area indicates frequency pairs excluded from the analysis (Methods). (DF) Same as AC, but for area V4. (GI) Same as AC, but using the phase in area V1 and the amplitude in area V4. Ampl., amplitude; att, attended; Freq., frequency; non-att, nonattended.
Fig. 8.
Fig. 8.
Visual theta remains after MS removal. (A) MS-LFP PPC as a function of frequency, showing a clear theta peak. The shading shows the 95% confidence interval based on a bootstrap procedure across MSs. (B) V1–V1 PPC in the attend-away condition, as a sensitive metric of V1 theta rhythmicity, calculated after removing epochs with MSs. Dark blue line, all available epochs (n = 1,917); light blue line, epochs excluding MSs that exceeded the mean eye speed by 5 SD (n = 827).
Fig. 9.
Fig. 9.
Attention contrast, excluding epochs with MSs. (A) Average LFP power spectra in area V1, with attention toward (red) and away from (blue) the activating stimulus. (B) Same as A, but for area V4. (C and D) Same as A and B, after removing the 1/fn component. (E) Average LFP phase locking between sites in area V1 and sites in area V4, with attention toward (red) and away from (blue) the activating stimulus. (F and G) Same as E, but for pairs of sites within area V1 (F) and area V4 (G). (H) Average GC influence spectra between V1 and V4 in the feedforward (green) and feedback directions (black). (A–H) The gray-shaded region indicates frequencies with a significant difference between attention conditions (A–G) or between feedforward and feedback directions (H) (P < 0.05; nonparametric permutation test with correction for multiple comparisons across frequencies). (I and J) Average PAC in area V1 with attention toward (I) and away from (J) the activating stimulus. (K) Average PAC difference in area V1 between the two attention conditions. (I–K) The semitransparent gray mask exposes frequency pairs with significant PAC or PAC difference, respectively (P < 0.05; nonparametric permutation test with correction for multiple comparisons across frequency pairs). The black area indicates frequency pairs excluded from the analysis (Methods). Ampl., amplitude; Att., attention; A.U., arbitrary units; Freq., frequency.

Similar articles

Cited by

References

    1. Luo H, Poeppel D. Phase patterns of neuronal responses reliably discriminate speech in human auditory cortex. Neuron. 2007;54:1001–1010. - PMC - PubMed
    1. O’Keefe J, Recce ML. Phase relationship between hippocampal place units and the EEG theta rhythm. Hippocampus. 1993;3:317–330. - PubMed
    1. Buzsáki G. 2006. Rhythms of the Brain (Oxford Univ Press, Oxford), p xiv, 448 p.
    1. Gupta AS, van der Meer MA, Touretzky DS, Redish AD. Segmentation of spatial experience by hippocampal θ sequences. Nat Neurosci. 2012;15:1032–1039. - PMC - PubMed
    1. Moore JD, et al. Hierarchy of orofacial rhythms revealed through whisking and breathing. Nature. 2013;497:205–210. - PMC - PubMed

Publication types

LinkOut - more resources