

Dynamics of multiple resistance mechanisms in plasma DNA during EGFR-targeted therapies in non-small cell lung cancer
- PMID: 29848757
- PMCID: PMC5991591
- DOI: 10.15252/emmm.201707945
Dynamics of multiple resistance mechanisms in plasma DNA during EGFR-targeted therapies in non-small cell lung cancer
Abstract
Tumour heterogeneity leads to the development of multiple resistance mechanisms during targeted therapies. Identifying the dominant driver(s) is critical for treatment decision. We studied the relative dynamics of multiple oncogenic drivers in longitudinal plasma of 50 EGFR-mutant non-small-cell lung cancer patients receiving gefitinib and hydroxychloroquine. We performed digital PCR and targeted sequencing on samples from all patients and shallow whole-genome sequencing on samples from three patients who underwent histological transformation to small-cell lung cancer. In 43 patients with known EGFR mutations from tumour, we identified them accurately in plasma of 41 patients (95%, 41/43). We also found additional mutations, including EGFR T790M (31/50, 62%), TP53 (23/50, 46%), PIK3CA (7/50, 14%) and PTEN (4/50, 8%). Patients with both TP53 and EGFR mutations before treatment had worse overall survival than those with only EGFR Patients who progressed without T790M had worse PFS during TKI continuation and developed alternative alterations, including small-cell lung cancer-associated copy number changes and TP53 mutations, that tracked subsequent treatment responses. Longitudinal plasma analysis can help identify dominant resistance mechanisms, including non-druggable genetic information that may guide clinical management.
Keywords: circulating tumour DNA; liquid biopsy; lung cancer; resistance mechanisms; targeted therapy.
© 2018 The Authors. Published under the terms of the CC BY 4.0 license.
Figures
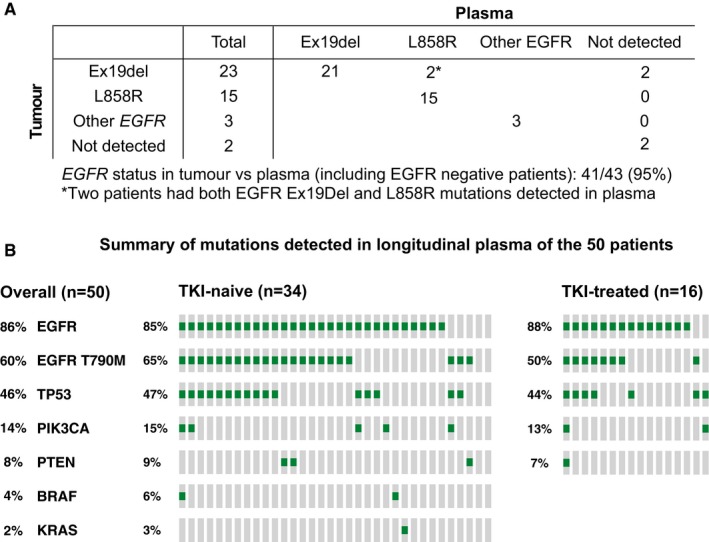
Detection of tumour EGFR mutations in plasma. EGFR mutation status in tumour samples was documented in the clinical record for 43 patients (Appendix Table S1), of which 38 had verified hotspot activating mutations (deletion in exon 19 for 23 patients and the L858R mutation for 15 patients), three patients had other mutations in EGFR (one of these patients had two different mutations detected in the tumour sample), and two patients were wild‐type for EGFR according to tumour analysis and confirmed by plasma analysis.
Summary of the mutations identified in any of the plasma samples during longitudinal follow‐up in the 50 patients. TKI‐naïve (n = 34) and TKI‐treated (n = 16) patients are presented separately.
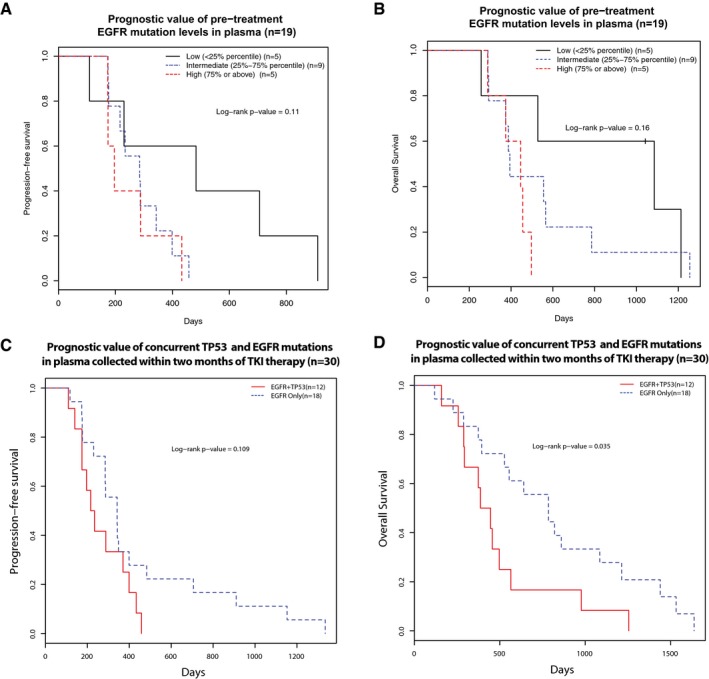
- A, B
The relationship of pre‐treatment EGFR‐activating mutation levels (allele fractions) with progression‐free survival (PFS) and overall survival (OS) of 19 first‐line TKI‐treated patients where baseline plasma samples (collected before the start of treatment) were available. Patients were grouped into three groups according to their pre‐treatment ctDNA levels, as measured by EGFR‐activating mutation allele fractions: low (< 25% quartile), intermediate (25–75% quartile) and high (> 75% quartile) ctDNA levels. Kaplan–Meier survival curves indicated that patients with high baseline pre‐treatment EGFR‐activating mutant allele fractions were non‐significantly associated with unfavourable (A) PFS (log‐rank P‐value = 0.11) and (B) OS (log‐rank P‐value = 0.16), Cox P‐value of 0.06 for either PFS or OS.
- C, D
The prognostic value of concurrent TP53 and EGFR mutations in pre‐treatment plasma samples before EGFR‐TKI therapy. This analysis was performed in 30 first‐line EGFR‐TKI patients where plasma samples were available within 2 months of start of treatment. The presence of both TP53 and EGFR mutations in plasma was associated with a trend of worse PFS (log‐rank P‐value = 0.109, hazard ratio and 95% confidence interval: 0.53 [0.24–1.17]) and significantly worse OS (log‐rank P‐value = 0.035, hazard ratio and 95% confidence interval: 0.43 [0.20–0.97]).
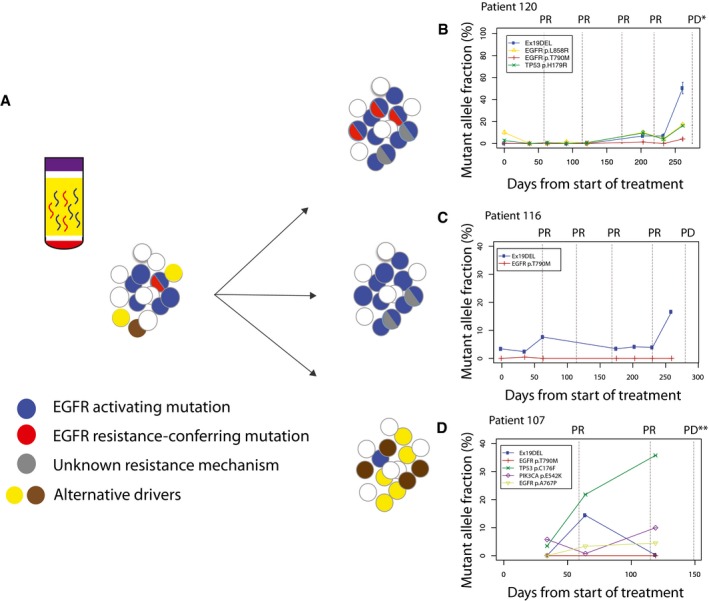
Longitudinal analysis of ctDNA dynamics in 45 NSCLC patients revealed three main groups of concurrent heterogeneous resistance mechanisms.
In the first group (n = 28/45, 62%), patients retained EGFR‐sensitizing mutations before and after disease progression, with the development of T790M in their plasma samples, indicating that at least some of the progressing clones developed resistance to TKI by acquiring T790M.
In the second group (n = 10/45, 22%), patients retained EGFR‐sensitizing mutations but progressed without developing T790M in their plasma samples, suggesting that resistance arose due to other mechanisms which were not analysed in this dataset.
In the third group (n = 7/45, 15%), patients progressed without EGFR‐sensitizing nor resistance‐conferring T790M mutations detected in their plasma samples. Resistance possibly develops through dependence on alternative cancer driver pathways.
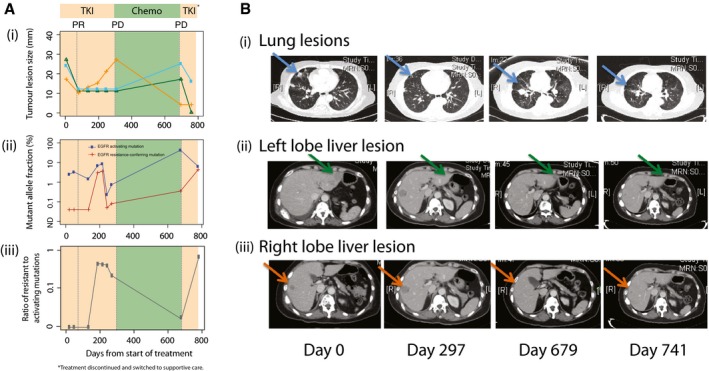
(i) Sizes of three different lesions in patient 103 over time, measured from the start of first‐line TKI treatment. Shading indicates duration of treatment with TKI (days 0–297), chemotherapy (days 297–679), and TKI re‐challenge (days 679–783). From day 783, the patient was treated with supportive care. Dotted lines indicate the CT imaging assessment at select timepoints. (ii) Levels of activating EGFR mutations (exon 19 deletion) and resistance‐conferring EGFR T790M mutations for patient 103 (Dataset EV1). (iii) Ratio of resistance‐conferring/activating mutations, calculated from data shown in Appendix Table S1 (excluding the data at T = 300 days).
CT imaging scans performed at the start of TKI treatment (day 0), at the change of treatment to chemotherapy (day 297), at the end of chemotherapy and start of TKI re‐challenge (day 679), and after initiating TKI re‐challenge (day 741). Sizes are assessed from CT imaging scans, and indicated by blue (i, lung), green (ii, left lobe liver) and orange (iii, right lobe liver) lines. Lesions identified in the lung (blue arrow), left lobe liver (green arrow) and right lobe liver (orange arrow) are indicated. PR, partial responses; PD, progressive disease.
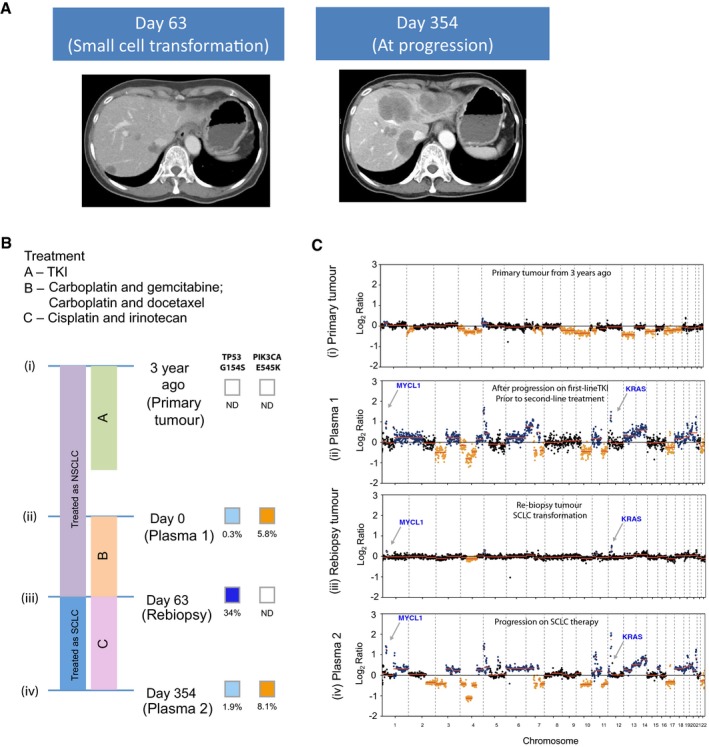
CT liver scans are shown: At day 63, the patient had progressed on platinum‐based chemotherapy, and CT of the liver showed appearance of new liver lesions. Liver biopsy at that point confirmed small‐cell lung cancer in new lesions in the liver. CT of the liver at day 354 shows marked growth in the liver lesions, after a period of transient response to cisplatin and irinotecan.
The timeline of the patient's treatment is charted, alongside the timepoints where plasma and tumour samples are available for molecular analyses. Per diagram timeline, tumour samples were available from diagnosis (3 years prior to recruitment for study) (i) and at day 63 (iii). Plasma samples were available at day 0 (ii) and day 354 (iv). The mutations allele fractions for TP53 and PIK3CA are shown.
Global copy number profiles in plasma samples collected prior to small‐cell transformation (ii) and after SCLC transformation and progression on cisplatin and irinotecan (iv). Global copy number profiles in tumour samples collected at diagnosis of NSCLC (i) and at small‐cell transformation (iii). CNA events that were significantly identified and coincide with literature‐reported SCLC events are denoted in colours: blue for gain and orange for loss.
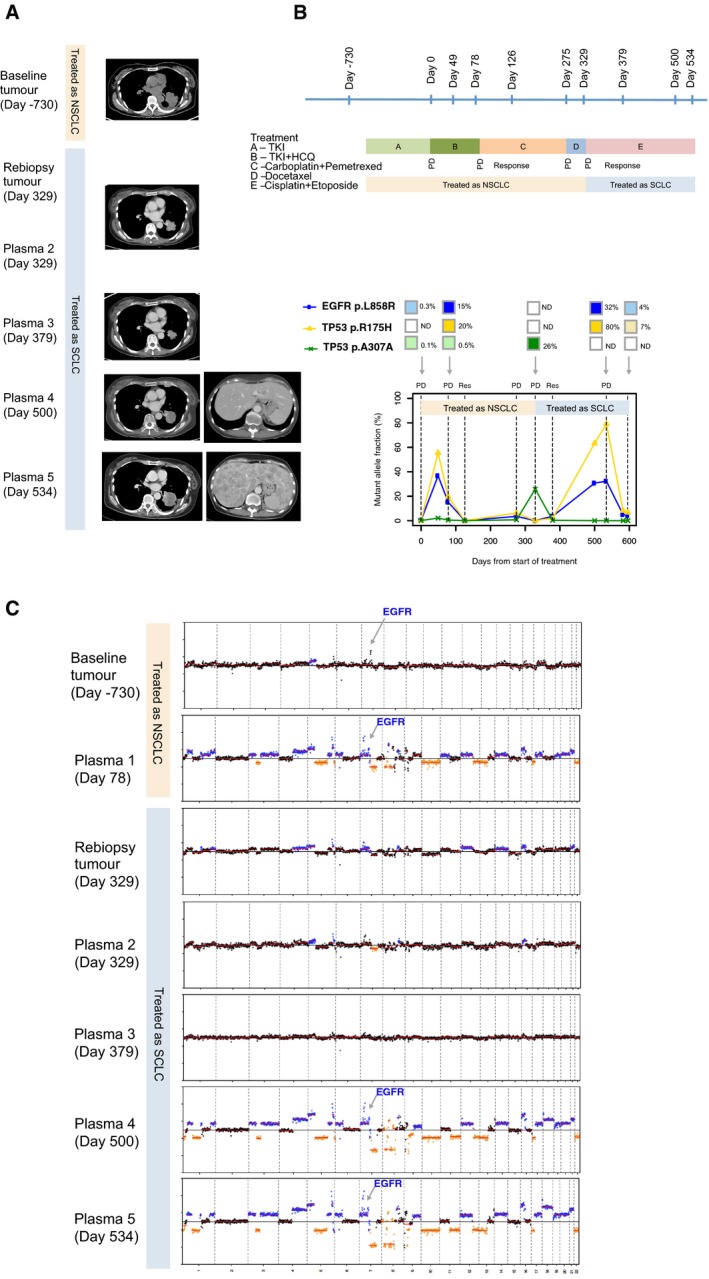
CT images of the left lung tumour at baseline (day −730), and upon progression on EGFR‐TKI (day 78). The patient was treated for non‐small‐cell lung cancer from days 78 to 329 with two lines of chemotherapy: initially carboplatin and pemetrexed, followed by docetaxel. The CT image corresponding to plasma 2 and re‐biopsy of the tumour at day 329 was upon progression on the above two lines of chemotherapy. CT image corresponding to plasma 3 at day 379 was upon response to small‐cell lung cancer chemotherapy. CT corresponding to days 500 and 524 are upon progression on cisplatin and etoposide. Marked growth of the lung and liver lesions are demonstrated, and this corresponds to marked CNA changes on plasma drawn on those respective days.
The timeline of the patient's treatment is shown, alongside timepoints where tumour and plasma samples were available for analyses. The bottom chart shows the respective mutations that were found, and the changes to the mutation allele fractions in a longitudinal timeline.
Global copy number profiles in tumour and plasma samples are shown: Tumour samples at baseline diagnosis of non‐small‐cell lung cancer (day −730) and at transformation to small‐cell lung cancer (day 329). For plasma samples, the following were available: days 78 (upon progression on EGFR‐TKI); 329 (at transformation to small‐cell lung cancer); 379 (at response to small‐cell lung cancer); 500 and 534 (progression on small‐cell lung cancer treatment).
References
-
- Camidge DR, Pao W, Sequist LV (2014) Acquired resistance to TKIs in solid tumours: learning from lung cancer. Nat Rev Clin Oncol 11: 473–481 - PubMed
-
- Couraud S, Vaca‐Paniagua F, Villar S, Oliver J, Schuster T, Blanche H, Girard N, Tredaniel J, Guilleminault L, Gervais R et al (2014) Noninvasive diagnosis of actionable mutations by deep sequencing of circulating free DNA in lung cancer from never‐smokers: a proof‐of‐concept study from BioCAST/IFCT‐1002. Clin Cancer Res 20: 4613–4624 - PubMed
Publication types
MeSH terms
Substances
Grants and funding
LinkOut - more resources
Full Text Sources
Other Literature Sources
Medical
Research Materials
Miscellaneous
