. 2018 May 30;8(1):8431.
doi: 10.1038/s41598-018-26151-8.

The A/T/N biomarker scheme and patterns of brain atrophy assessed in mild cognitive impairment

Affiliations

The A/T/N biomarker scheme and patterns of brain atrophy assessed in mild cognitive impairment

Urban Ekman et al. Sci Rep. .

Abstract

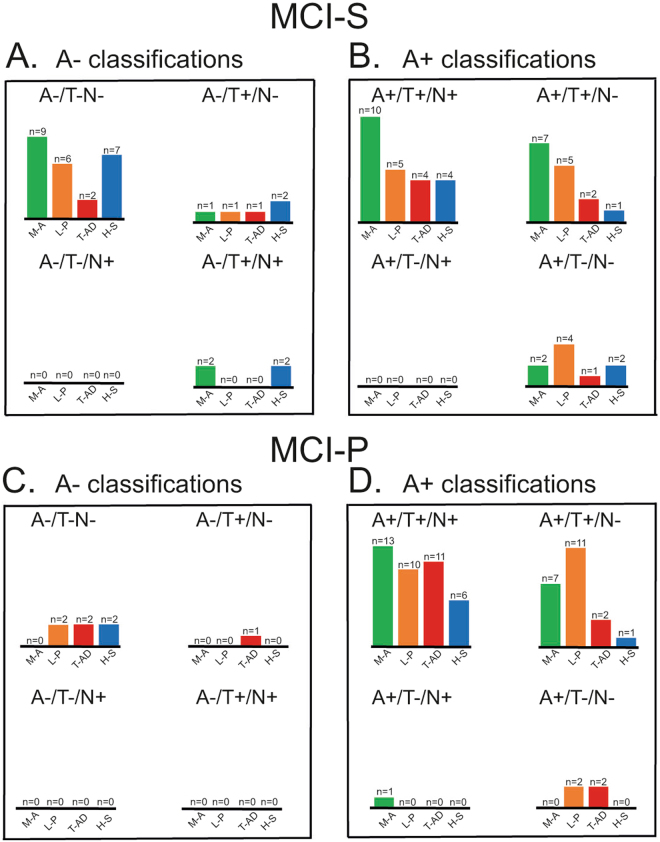
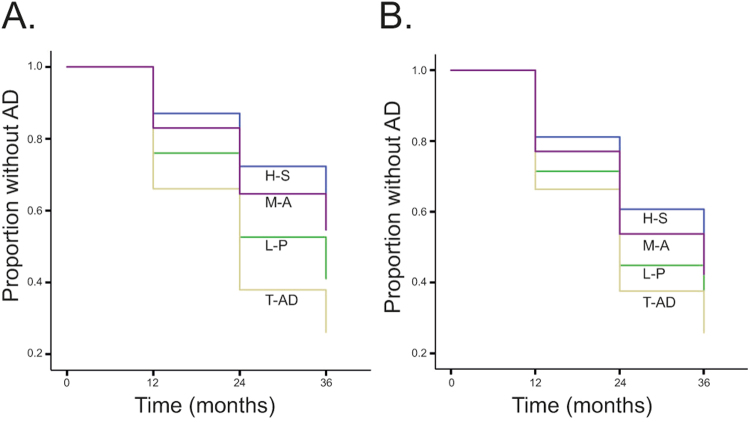
The objective of this study was to evaluate the A/T/N biomarker scheme in relation with brain atrophy patterns in individuals with mild cognitive impairment (MCI). Of the 154 participants with MCI, 74 progressed to AD within 36-months, and 80 remained stable. In addition, 101 cognitively healthy participants and 102 participants with AD were included. The A/T/N classification was assessed with cerebrospinal fluid markers. Each individual was rated as either positive (abnormal) or negative (normal) on each biomarker. Brain atrophy was assessed with visual ratings from magnetic resonance imaging. None of the individuals with MCI progressed to AD if they had a negative "A" biomarker in conjunction with minimal atrophy. In contrary, several individuals with MCI progressed to AD if they had a positive "A" biomarker in conjunction with minimal atrophy. Numerous individuals with MCI showed inconsistency in the neurodegeneration domain ("N") regarding t-tau and atrophy. The assessment of the A/T/N classification scheme in addition with brain atrophy patterns in MCI, increases the knowledge of the clinical trajectories and the variability within the neurodegeneration domain. This emphasises that individuals with MCI display heterogeneous longitudinal patterns closely connected to their biomarker profiles, which could have important clinical implications.


Conflict of interest statement

The authors declare no competing interests.

Figures

Figure 1
Figure 1
Subtypes of brain atrophy patterns in MCI from visual rating scales Atrophy was measured with the medial temporal atrophy (MTA) scale, the global cortical atrophy-frontal (GCA-F) sub-scale, and the posterior atrophy (PA) scale. The visual rating scales were based on MRI. A score of zero indicates no atrophy. A score from one to four (MTA), and from one to three (GCA-F, and PA) indicates an increasing degree of atrophy. The minimal atrophy group was defined as normal scores on all visual rating scales. The limbic-predominant group was defined as abnormal MTA and normal GCA-F and PA. The typical AD group was defined as abnormal MTA in conjunction with either an abnormal PA or GCA-F, or an abnormal MTA in conjunction with both an abnormal PA and GCA-F. The hippocampal-sparing group was defined as abnormal GCA-F and/or abnormal PA, but normal MTA. AD = Alzheimer’s disease. L = left. R = right. A = anterior. P = posterior.
Figure 2
Figure 2
Prevalence of each A/T/N group Percentages of participants in each ATN group for healthy controls, MCI-S, MCI-P, and AD. HC = healthy controls. MCI-S = MCI participants that are clinically stable across time. MCI-P = MCI participants that progress to AD. AD = Alzheimer’s disease. MCI = mild cognitive impairment. CSF = cerebrospinal fluid. A − = CSF Aβ normal. A + = CSF Aβ abnormal. T − = CSF p-tau normal. T + = CSF p-tau abnormal. N− = CSF t-tau normal. N + = t-tau abnormal.
Figure 3
Figure 3
Survival curves of different A/T/N groups in MCI Showing survival curves that illustrate time of progression to AD for participants with MCI at baseline with either (A) an A−/T−/N− (blue; n = 30; mean duration = 28.8 months, SD = 9.8) or an A+/T+/N+ (green; n = 63; mean duration = 25.5 months, SD = 9.8) pattern, or (B) a negative (blue; n = 40; mean duration = 28.8 months, SD = 10.1) or a positive (green; n = 114; mean duration = 25.0, SD = 9.9) “A” biomarker (irrespective of “T” and “N” classification).
Figure 4
Figure 4
Number of A/T/N classified MCI-participants with different atrophy patterns Number of participants with MCI-S and an A- classifications (A), MCI-S and an A+ classification (B), MCI-P and an A- classifications (C), and MCI-P and an A+ classification (D) pattern. MCI-S = MCI participants that are clinically stable across time. MCI-P = MCI participants that progress to AD. A = Aβ biomarker. T = tau pathology biomarker. N = the biomarker of neurodegeneration. M-A = Minimal atrophy. L-P = Limbic Predominant. T-AD = Typical Alzheimer’s disease. H-S = Hippocampal-sparing.
Figure 5
Figure 5
Survival curves of different brain atrophy patterns in MCI (A) Showing survival curves that illustrate time to AD for participants with MCI at baseline with either M-A = Minimal atrophy (purple), L-P = Limbic Predominant atrophy (green), T-AD = Typical Alzheimer’s disease atrophy (beige), or H-S = Hippocampal-sparing pattern (blue). (B) Showing survival curves as in A, but only including individuals with A+ biomarkers in the model.

Similar articles

Cited by

References

    1. Winblad B, et al. Mild cognitive impairment–beyond controversies, towards a consensus: report of the International Working Group on Mild Cognitive Impairment. J. Intern. Med. 2004;256:240–246. doi: 10.1111/j.1365-2796.2004.01380.x. - DOI - PubMed
    1. Beach TG, Monsell SE, Phillips LE, Kukull W. Accuracy of the Clinical Diagnosis of Alzheimer Disease at National Institute on Aging Alzheimer Disease Centers, 2005–2010. J. Neuropathol. Exp. Neurol. 2012;71:266–273. doi: 10.1097/NEN.0b013e31824b211b. - DOI - PMC - PubMed
    1. Gamberger D, Lavrač N, Srivatsa S, Tanzi RE, Doraiswamy PM. Identification of clusters of rapid and slow decliners among subjects at risk for Alzheimer’s disease. Sci. Rep. 2017;7:1–12. doi: 10.1038/s41598-017-06624-y. - DOI - PMC - PubMed
    1. Hinrichs C, Singh V, Xu G, Johnson SC. Predictive markers for AD in a multi-modality framework: An analysis of MCI progression in the ADNI population. Neuroimage. 2011;55:574–589. doi: 10.1016/j.neuroimage.2010.10.081. - DOI - PMC - PubMed
    1. Mangialasche F, et al. Classification and prediction of clinical diagnosis of Alzheimer’s disease based on MRI and plasma measures of α-/γ-tocotrienols and γ-tocopherol. J. Intern. Med. 2013;273:602–621. doi: 10.1111/joim.12037. - DOI - PubMed

Publication types