. 2018 May 30;9(1):2134.
doi: 10.1038/s41467-018-04608-8.

Exploring patterns enriched in a dataset with contrastive principal component analysis

Affiliations

Exploring patterns enriched in a dataset with contrastive principal component analysis

Abubakar Abid et al. Nat Commun. .

Abstract

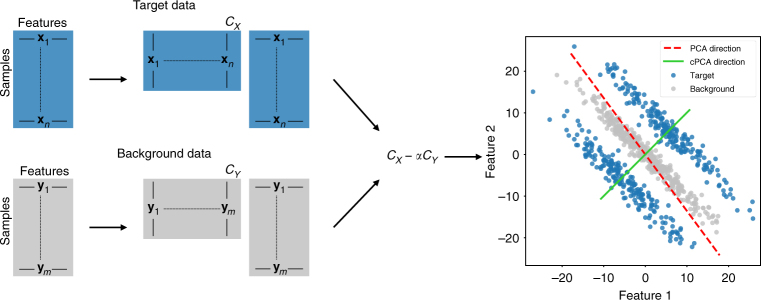
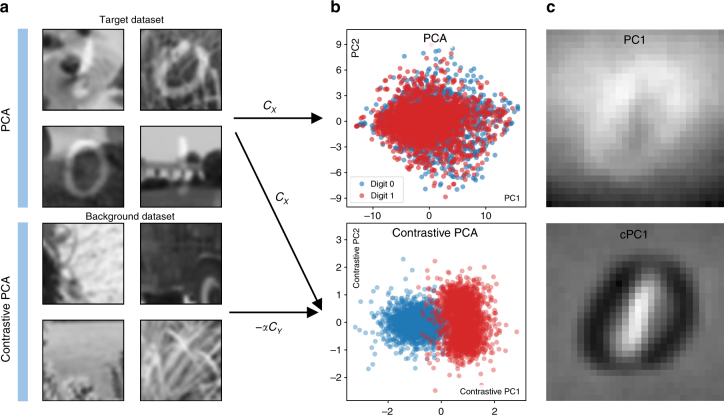
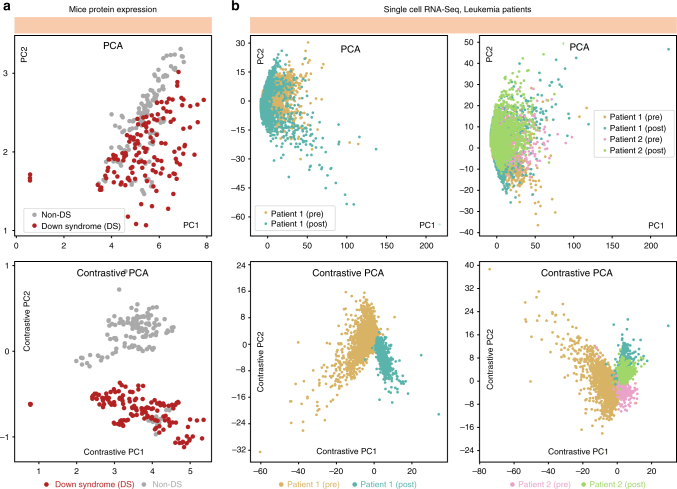
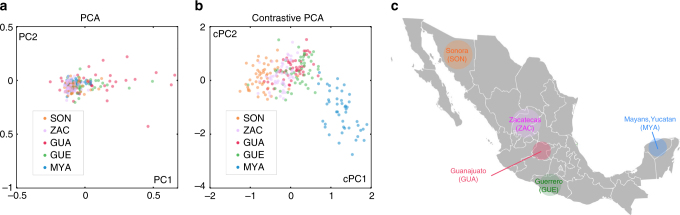
Visualization and exploration of high-dimensional data is a ubiquitous challenge across disciplines. Widely used techniques such as principal component analysis (PCA) aim to identify dominant trends in one dataset. However, in many settings we have datasets collected under different conditions, e.g., a treatment and a control experiment, and we are interested in visualizing and exploring patterns that are specific to one dataset. This paper proposes a method, contrastive principal component analysis (cPCA), which identifies low-dimensional structures that are enriched in a dataset relative to comparison data. In a wide variety of experiments, we demonstrate that cPCA with a background dataset enables us to visualize dataset-specific patterns missed by PCA and other standard methods. We further provide a geometric interpretation of cPCA and strong mathematical guarantees. An implementation of cPCA is publicly available, and can be used for exploratory data analysis in many applications where PCA is currently used.


Conflict of interest statement

The authors declare no competing interests.

Figures

Fig. 1
Fig. 1
Schematic Overview of cPCA. To perform cPCA, compute the covariance matrices CX, CY of the target and background datasets. The singular vectors of the weighted difference of the covariance matrices, CX − α · CY, are the directions returned by cPCA. As shown in the scatter plot on the right, PCA (on the target data) identifies the direction that has the highest variance in the target data, while cPCA identifies the direction that has a higher variance in the target data as compared to the background data. Projecting the target data onto the latter direction gives patterns unique to the target data and often reveals structure that is missed by PCA. Specifically, in this example, reducing the dimensionality of the target data by cPCA would reveal two distinct clusters
Fig. 2
Fig. 2
Contrastive PCA on Noisy Digits. a, Top: We create a target dataset of 5,000 synthetic images by randomly superimposing images of handwritten digits 0 and 1 from MNIST dataset on top of images of grass taken from ImageNet dataset belonging to the synset grass. The images of grass are converted to grayscale, resized to be 100 × 100, and then randomly cropped to be the same size as the MNIST digits, 28 × 28. b, Top: Here, we plot the result of embedding the synthetic images onto their first two principal components using standard PCA. We see that the points corresponding to the images with 0’s and images with 1’s are hard to distinguish. a, Bottom: A background dataset is then introduced consisting solely of images of grass belonging to the same synset, but we use images that are different than those used to create the target dataset. b, Bottom: Using cPCA on the target and background datasets (with a value of the contrast parameter α set to 2.0), two clusters emerge in the lower-dimensional representation of the target dataset, one consisting of images with the digit 0 and the other of images with the digit 1. c We look at the relative contribution of each pixel to the first principal component (PC) and first contrastive principal component (cPC). Whiter pixels are those that carry a more positive weight, while darker denotes those pixels that carry negative weights. PCA tends to emphasize pixels in the periphery of the image and slightly de-emphasize pixels in the center and bottom of the image, indicating that most of the variance is due to background features. On the other hand, cPCA tends to upweight the pixels that are at the location of the handwritten 1’s, negatively weight pixels at the location of handwritten 0’s, and neglect most other pixels, effectively discovering those features useful for discriminating between the superimposed digits
Fig. 3
Fig. 3
Discovering subgroups in biological data. a We use PCA to project a protein expression dataset of mice with and without Down Syndrome (DS) onto the first two components. The lower-dimensional representation of protein expression measurements from mice with and without DS are seen to be distributed similarly (top). But, when we use cPCA to project the dataset onto its first two cPCs, we discover a lower-dimensional representation that clusters mice with and without DS separately (bottom). b Furthermore, we use PCA and cPCA to visualize a high-dimensional single-cell RNA-Seq dataset in two dimensions. The dataset consists of four cell samples from two leukemia patients: a pre-transplant sample from patient 1, a post-transplant sample from patient 1, a pre-transplant sample from patient 2, and a post-transplant sample from patient 2. b, left: The results using only the samples from patient 1, which demonstrate that cPCA (bottom) more effectively separates the samples than PCA (top). When the samples from the second patient are included, in b, right, again cPCA (bottom) is more effective than PCA (top) at separating the samples, although the post-transplant cells from both patients are similarly-distributed. We show plots of each sample separately in Supplementary Fig. 5, where it is easier to see the overlap between different samples
Fig. 4
Fig. 4
Relationship between Mexican ancestry groups. a PCA applied to genetic data from individuals from 5 Mexican states does not reveal any visually discernible patterns in the embedded data. b cPCA applied to the same dataset reveals patterns in the data: individuals from the same state are clustered closer together in the cPCA embedding. c Furthermore, the distribution of the points reveals relationships between the groups that matches the geographic location of the different states: for example, individuals from geographically adjacent states are adjacent in the embedding. c Adapted from a map of Mexico that is originally the work of User:Allstrak at Wikipedia, published under a CC-BY-SA license, sourced from https://commons.wikimedia.org/wiki/File:Mexico_Map.svg
Fig. 5
Fig. 5
Geometric Interpretation of cPCA. The set of target–background variance pairs U is plotted as the teal region for some randomly generated target and background data. The lower-right boundary, as colored in gold, corresponds to the set of most contrastive directions Sλ. The blue triangles are the variance pairs for the cPCs selected with α values 0.92 and 0.29 respectively. We note that they correspond to the points of tangency of the gold curve and the tangent lines with slope 1α = 1.08, 3.37, respectively

Comment in

  • Contrasting PCA across datasets.
    Nawy T. Nawy T. Nat Methods. 2018 Aug;15(8):572. doi: 10.1038/s41592-018-0093-0. Nat Methods. 2018. PMID: 30065385 No abstract available.

Similar articles

Cited by

References

    1. Hotelling H. Analysis of a complex of statistical variables into principal components. J. Educ. Psychol. 1933;24:417. doi: 10.1037/h0071325. - DOI
    1. Jolliffe, I. T (ed.). Principal Component Analysis, 115–128 (Springer, New York, NY, 1986).
    1. Maaten L, Hinton G. Visualizing data using t-sne. J. Mach. Learn. Res. 2008;9:2579–2605.
    1. Cox, M. A. & Cox, T. F. Multidimensional Scaling. Handbook of Data Visualization 315–347 (Springer, Berlin, 2008).
    1. Chen W, Ma H, Yu D, Zhang H. SVD-based technique for interference cancellation and noise reduction in NMR measurement of time-dependent magnetic fields. Sensors. 2016;16:323. doi: 10.3390/s16030323. - DOI - PMC - PubMed

Publication types