. 2018 May 30;8(1):8403.
doi: 10.1038/s41598-018-26720-x.

Dynamic Visual Cues for Differentiating Mirror and Glass

Affiliations

Dynamic Visual Cues for Differentiating Mirror and Glass

Hideki Tamura et al. Sci Rep. .

Abstract

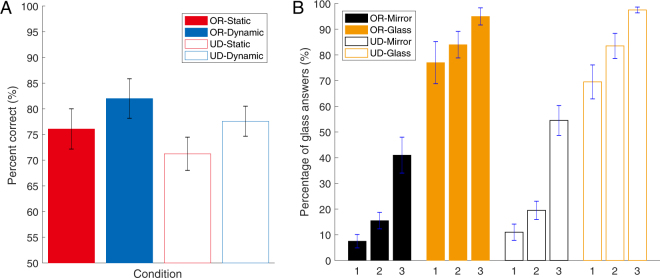
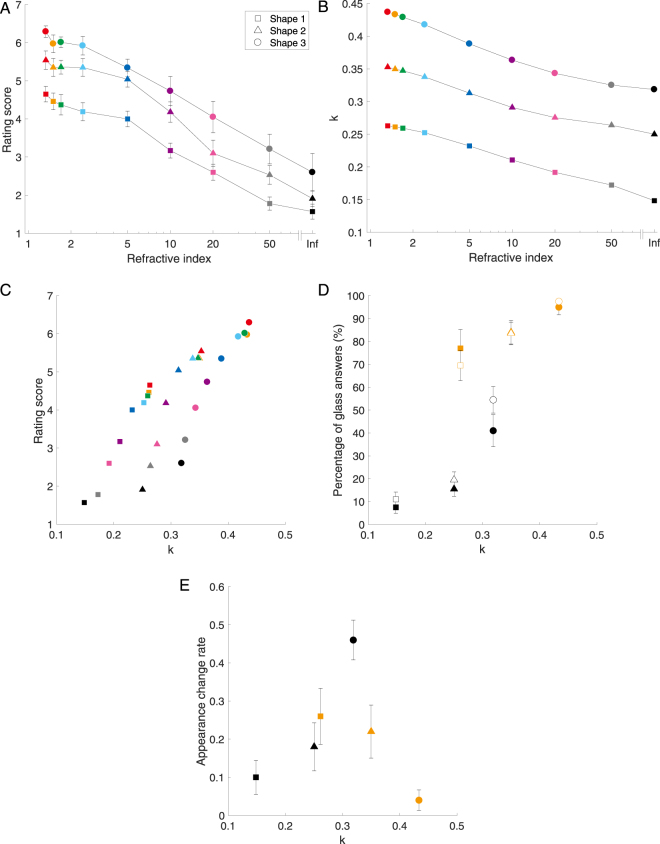
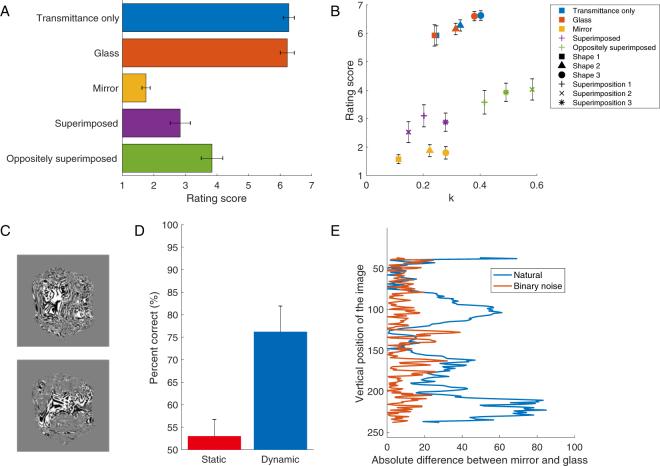
Mirror materials (perfect specular surfaces such as polished metal) and glass materials (transparent and refraction media) are quite commonly encountered in everyday life. The human visual system can discriminate these complex distorted images formed by reflection or transmission of the surrounding environment even though they do not intrinsically possess surface colour. In this study, we determined the cues that aid mirror and glass discrimination. From video analysis, we found that glass objects have more opposite motion components relative to the direction of object rotation. Then, we hypothesised a model developed using motion transparency because motion information is not only present on the front side, but also on the rear side of the object surface in the glass material object. In materials judging experiments, we found that human performance with rotating video stimuli is higher than that with static stimuli (simple images). Subsequently, we compared the developed model derived from motion coherency to human rating performance for transparency and specular reflection. The model sufficiently identified the different materials using dynamic information. These results suggest that the visual system relies on dynamic cues that indicate the difference between mirror and glass.


Conflict of interest statement

The authors declare no competing interests.

Figures

Figure 1
Figure 1
Differences between mirror and glass materials in video stimuli. (A) Examples of stimuli (see Movie 1 for the dynamic condition). The top row contains the mirror material objects and the bottom row contains the glass material objects. The left block shows three different shapes under illumination 1 (environment light field). The right block shows five different illuminations with object shape 1. (B) Visualisations of motion components in object rotation direction. The top column shows the mirror material objects and the bottom column shows the glass material objects. Colour maps indicate the magnitude of the motion components in each pixel. Red indicates the left direction and blue indicates the right direction. We selected three examples, frames 1–2, 11–12, and 21–22, for shape 1 under illumination 1. (C) Histogram indicating the directions motion of the optic flows of mirror and glass materials. The horizontal axis indicates the direction in radians (right is zero and left is pi). The vertical axis indicates the probability of appearance frequency. The optic flows were included for all frames and the five natural illuminations. Note that these components only move in the horizontal direction because the object was rotated around the vertical axis.
Figure 2
Figure 2
Perceptual material discrimination between mirror and glass. (A) Results for perceptual material discrimination under two presenting conditions, along with the rotating conditions. The horizontal axis indicates each condition combined with the rotating and presenting conditions. The vertical axis indicates the percentage of correct answers. ‘OR’ signifies original, and ‘UD’ signifies upside-down stimuli. Averages and standard errors among observers were obtained. The error bars represent the standard error of the mean across all ten observers. (B) Percentage of glass answers for different shapes. The horizontal axis indicates the shape number and the vertical axis indicates the percentage of glass answers. Different numbers along the horizontal axis indicate different shapes. The symbols are the same as in A.
Figure 3
Figure 3
Model description.
Figure 4
Figure 4
Developed model and its performance. (A) Rating score of the perceived specular reflection and transparency. The horizontal axis indicates the refractive index of the stimuli on a log scale. The vertical axis indicates the rating score on a seven-point rating system, where perceived specular reflection is one and transparency is seven. Averages and standard errors among observers were obtained. The error bars represent the standard error of the mean across all ten observers. (B) Model output. The horizontal axis is the same as in A. The vertical axis indicates the model output k. (C) Correlation between model output and ratings given by human observers. (D) Correlation between the model output k and the percentage of glass answers for original and upside-down stimuli under dynamic conditions. The horizontal axis indicates the model output k. The vertical axis indicates the percentage of glass answers; this axis is the same as in Fig. 2B. The filled and open symbols indicate the original and upside-down stimuli, respectively. Averages and standard errors among observers were obtained. The error bars represent the standard error of the mean across all ten observers. (E) The appearance change rate. The horizontal axis is the same as in (C and D). The vertical axis shows the rate indicating how much the material appearance changes. In (BE) the symbols are the same as in A.
Figure 5
Figure 5
Validation of the proposed model with new stimuli. (A) Rating scores of perceived specular reflection and transparency for new stimuli. The horizontal axis indicates the rating score corresponding to the vertical axis of Fig. 4A. The vertical axis indicates the stimulus conditions. The error bars represent the standard error of the mean across all ten observers. (B) Relationship between model output and rating score. (C) Stimuli rendered in random binary noise illumination (top: mirror, bottom: glass). See also, Movie 4A and B. (D) Result of perceptual material discrimination using the binary noise condition. The horizontal axis indicates each condition. The vertical axis indicates the percentage of correct answers. Averages and standard errors among observers were obtained. The error bars represent the standard error of the mean across all seven observers. (E) Different luminance distributions between original and the binary noise conditions. The horizontal axis indicates the absolute differences of the image pixel intensities (luminance) between mirror and glass. The pixel intensities were averaged along each row in the image, excluding the background. The vertical axis indicates the vertical position of the image.

References

    1. Doerschner K, et al. Visual motion and the perception of surface material. Curr. Biol. 2011;21:2010–2016. doi: 10.1016/j.cub.2011.10.036. - DOI - PMC - PubMed
    1. Dövencioğlu DN, Ben-Shahar O, Barla P, Doerschner K. Specular motion and 3D shape estimation. J. Vis. 2017;17:1–15. - PubMed
    1. Doerschner K, Yilmaz O, Kucukoglu G, Fleming RW. Effects of surface reflectance and 3D shape on perceived rotation axis. J. Vis. 2013;13:1–23. doi: 10.1167/13.11.8. - DOI - PubMed
    1. Dövencioğlu DN, Wijntjes MW, Ben-Shahar O, Doerschner K. Effects of surface reflectance on local second order shape estimation in dynamic scenes. Vision Res. 2015;115:218–230. doi: 10.1016/j.visres.2015.01.008. - DOI - PubMed
    1. Sakano Y, Ando H. Effects of head motion and stereo viewing on perceived glossiness. J. Vis. 2010;10:1–14. doi: 10.1167/10.9.15. - DOI - PubMed

Publication types

LinkOut - more resources