

Association of tumor-infiltrating T-cell density with molecular subtype, racial ancestry and clinical outcomes in prostate cancer
- PMID: 29849114
- PMCID: PMC6168349
- DOI: 10.1038/s41379-018-0083-x
Association of tumor-infiltrating T-cell density with molecular subtype, racial ancestry and clinical outcomes in prostate cancer
Abstract
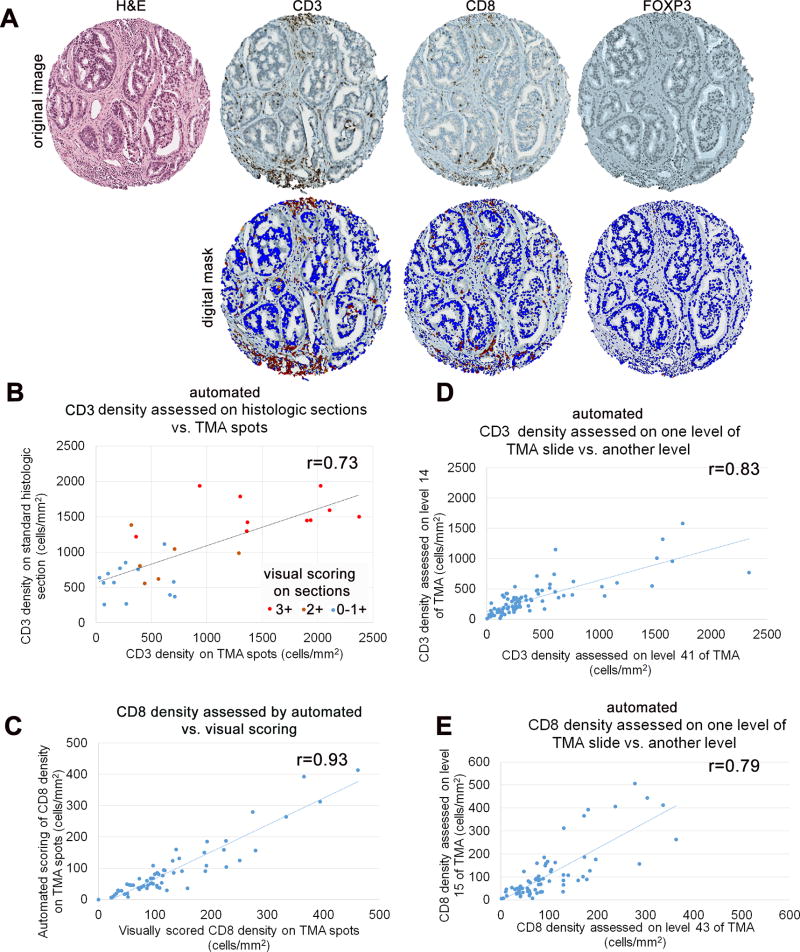
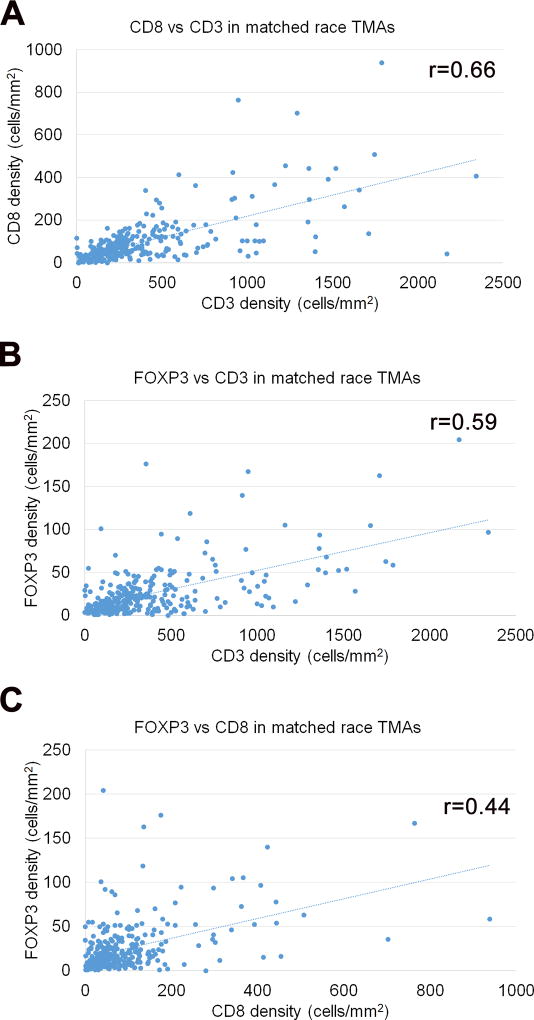
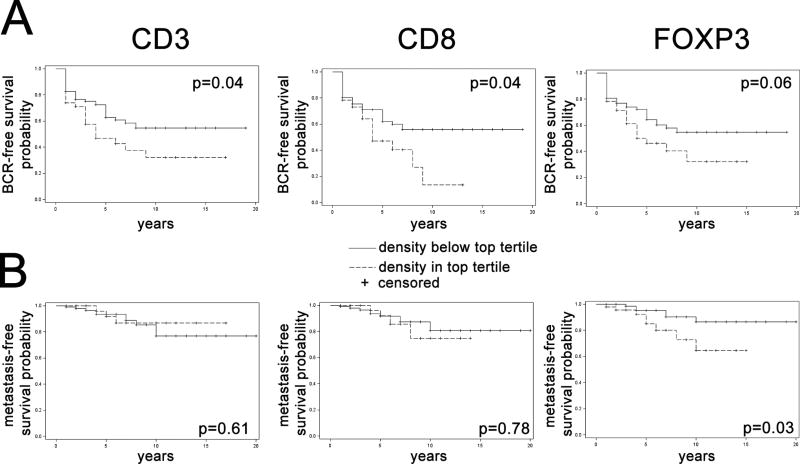
The inflammatory microenvironment plays an important role in the pathogenesis and progression of tumors and may be associated with somatic genomic alterations. We examined the association of tumor-infiltrating T-cell density with clinical-pathologic variables, tumor molecular subtype, and oncologic outcomes in surgically treated primary prostate cancer occurring in patients of European-American or African-American ancestry. We evaluated 312 primary prostate tumors, enriched for patients with African-American ancestry and high grade disease. Tissue microarrays were immunostained for CD3, CD8, and FOXP3 and were previously immunostained for ERG and PTEN using genetically validated protocols. Image analysis for quantification of T-cell density in tissue microarray tumor spots was performed. Automated quantification of T-cell densities in tumor-containing regions of tissue microarray spots and standard histologic sections were correlated (r = 0.73, p < 0.00001) and there was good agreement between visual and automated T-cell density counts on tissue microarray spots (r = 0.93, p < 0.00001). There was a significant correlation between CD3+, CD8+, and FOXP3+ T-cell densities (p < 0.00001), but these were not associated with most clinical or pathologic variables. Increased T-cell density was significantly associated with ERG positivity (median 309 vs. 188 CD3+ T cells/mm2; p = 0.0004) and also with PTEN loss (median 317 vs. 192 CD3+ T cells/mm2; p = 0.001) in the combined cohort of matched European-American and African-American ancestry patients. The same association or a similar trend was present in patients of both ancestries when analyzed separately. When the African-American patients from the matched race set were combined with a separate high grade set of African-American cases, there was a weak association of increased FOXP3+ T-cell densities with increased risk of metastasis in multivariable analysis. Though high T-cell density is associated with specific molecular subclasses of prostate cancer, we did not find an association of T-cell density with racial ancestry.
Figures
Similar articles
-
TP53 missense mutation is associated with increased tumor-infiltrating T cells in primary prostate cancer.Hum Pathol. 2019 May;87:95-102. doi: 10.1016/j.humpath.2019.02.006. Epub 2019 Mar 6. Hum Pathol. 2019. PMID: 30851334 Free PMC article.
-
SPINK1 expression is enriched in African American prostate cancer but is not associated with altered immune infiltration or oncologic outcomes post-prostatectomy.Prostate Cancer Prostatic Dis. 2019 Dec;22(4):552-559. doi: 10.1038/s41391-019-0139-0. Epub 2019 Mar 8. Prostate Cancer Prostatic Dis. 2019. PMID: 30850708
-
PTEN-deficient prostate cancer is associated with an immunosuppressive tumor microenvironment mediated by increased expression of IDO1 and infiltrating FoxP3+ T regulatory cells.Prostate. 2019 Jun;79(9):969-979. doi: 10.1002/pros.23808. Epub 2019 Apr 18. Prostate. 2019. PMID: 30999388
-
Racial differences in CD8+ T cell infiltration in breast tumors from Black and White women.Breast Cancer Res. 2020 Jun 9;22(1):62. doi: 10.1186/s13058-020-01297-4. Breast Cancer Res. 2020. PMID: 32517730 Free PMC article.
-
Biological determinants of health disparities in prostate cancer.Curr Opin Oncol. 2013 May;25(3):235-41. doi: 10.1097/CCO.0b013e32835eb5d1. Curr Opin Oncol. 2013. PMID: 23399519 Free PMC article. Review.
Cited by
-
Immune mechanisms behind prostate cancer in men of African ancestry: A review.Prostate. 2022 Jun;82(8):883-893. doi: 10.1002/pros.24333. Epub 2022 Mar 7. Prostate. 2022. PMID: 35254710 Free PMC article. Review.
-
Inflammation in Prostate Cancer: Exploring the Promising Role of Phenolic Compounds as an Innovative Therapeutic Approach.Biomedicines. 2023 Nov 24;11(12):3140. doi: 10.3390/biomedicines11123140. Biomedicines. 2023. PMID: 38137361 Free PMC article. Review.
-
Inflammation and Prostate Cancer: A Multidisciplinary Approach to Identifying Opportunities for Treatment and Prevention.Cancers (Basel). 2022 Mar 8;14(6):1367. doi: 10.3390/cancers14061367. Cancers (Basel). 2022. PMID: 35326519 Free PMC article. Review.
-
Racial differences in prostate tumor microenvironment: implications for disparate clinical outcomes and potential opportunities.Cancer Health Disparities. 2022;6:214. Epub 2022 Dec 31. Cancer Health Disparities. 2022. PMID: 36777283 Free PMC article.
-
Empirical identification and validation of tumor-targeting T cell receptors from circulation using autologous pancreatic tumor organoids.J Immunother Cancer. 2021 Nov;9(11):e003213. doi: 10.1136/jitc-2021-003213. J Immunother Cancer. 2021. PMID: 34789550 Free PMC article.
References
-
- Schreiber RD, Old LJ, Smyth MJ. Cancer immunoediting: integrating immunity’s roles in cancer suppression and promotion. Science. 2011;331:1565–70. - PubMed
-
- Galon J, Costes A, Sanchez-Cabo F, et al. Type, density, and location of immune cells within human colorectal tumors predict clinical outcome. Science. 2006;313:1960–4. - PubMed
-
- Eerola AK, Soini Y, Paakko P. Tumour infiltrating lymphocytes in relation to tumour angiogenesis, apoptosis and prognosis in patients with large cell lung carcinoma. Lung Cancer. 1999;26:73–83. - PubMed
-
- Al-Shibli K, Al-Saad S, Andersen S, et al. The prognostic value of intraepithelial and stromal CD3-, CD117- and CD138-positive cells in non-small cell lung carcinoma. APMIS. 2010;118:371–82. - PubMed
Publication types
MeSH terms
Grants and funding
LinkOut - more resources
Full Text Sources
Other Literature Sources
Medical
Research Materials
