Case Reports
. 2018 Jun;558(7709):307-312.
doi: 10.1038/s41586-018-0178-z. Epub 2018 May 30.

Disruption of TET2 promotes the therapeutic efficacy of CD19-targeted T cells

Affiliations
Case Reports

Disruption of TET2 promotes the therapeutic efficacy of CD19-targeted T cells

Joseph A Fraietta et al. Nature. 2018 Jun.

Abstract

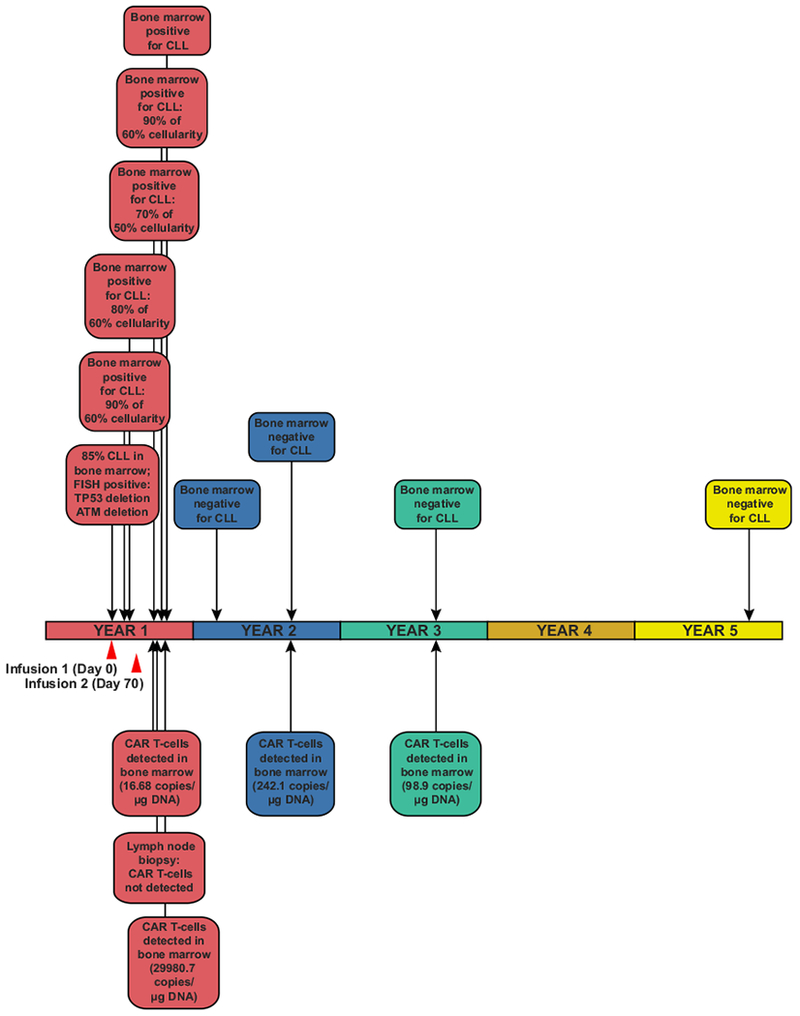
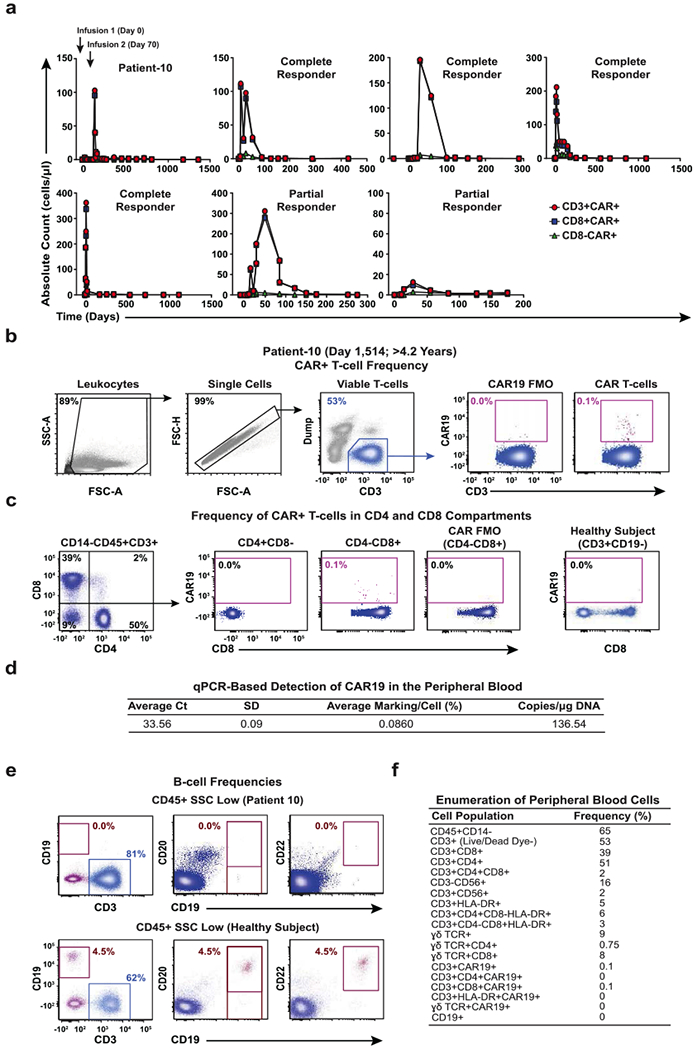
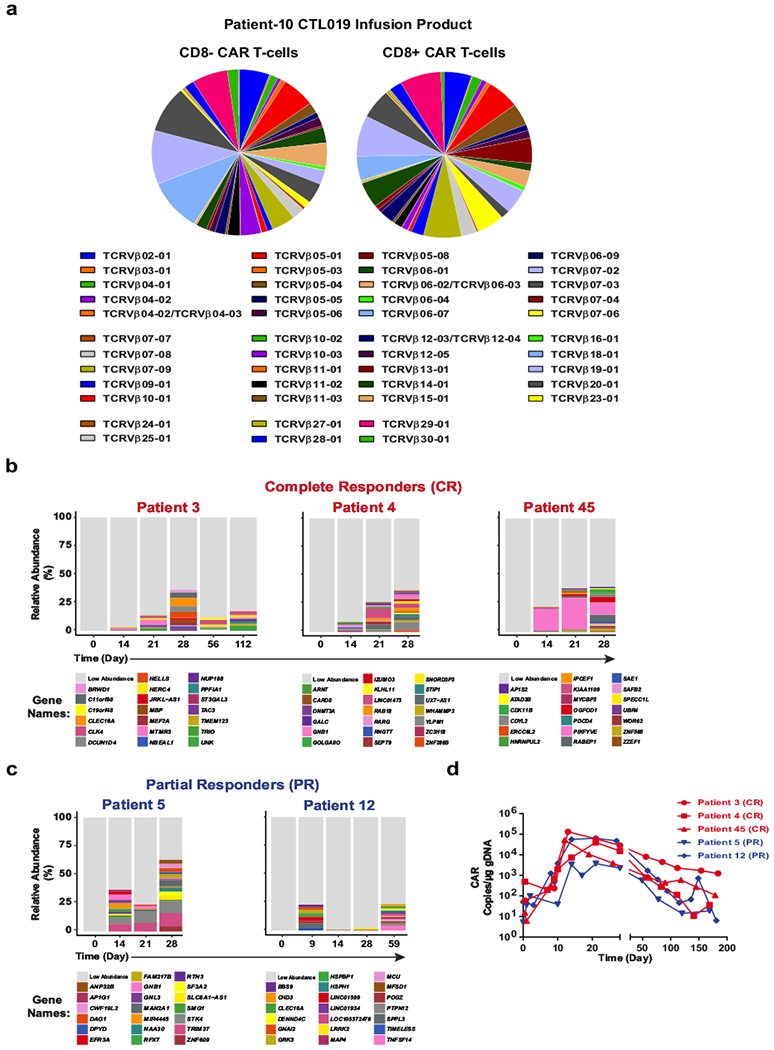
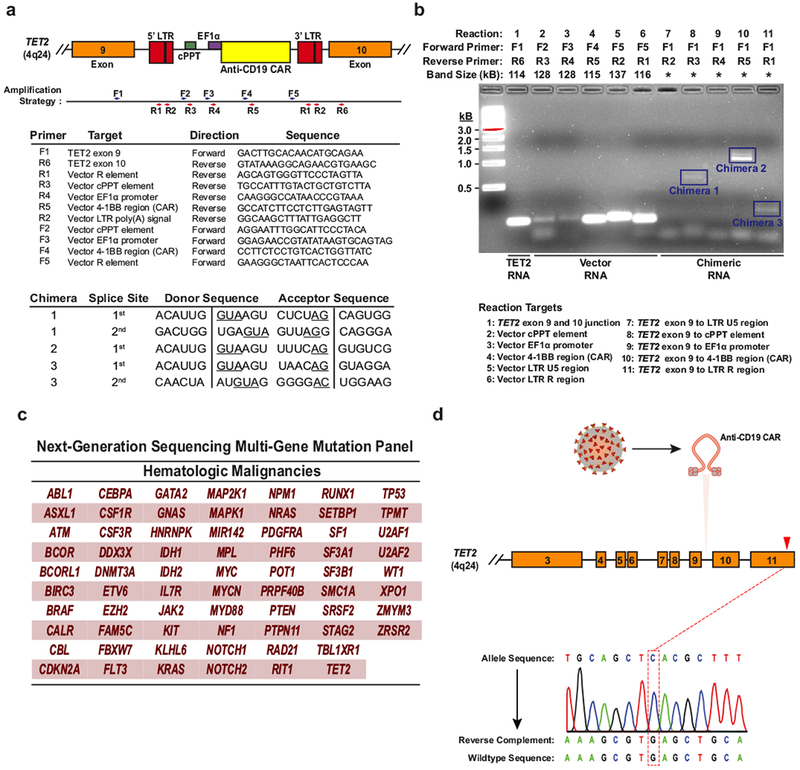
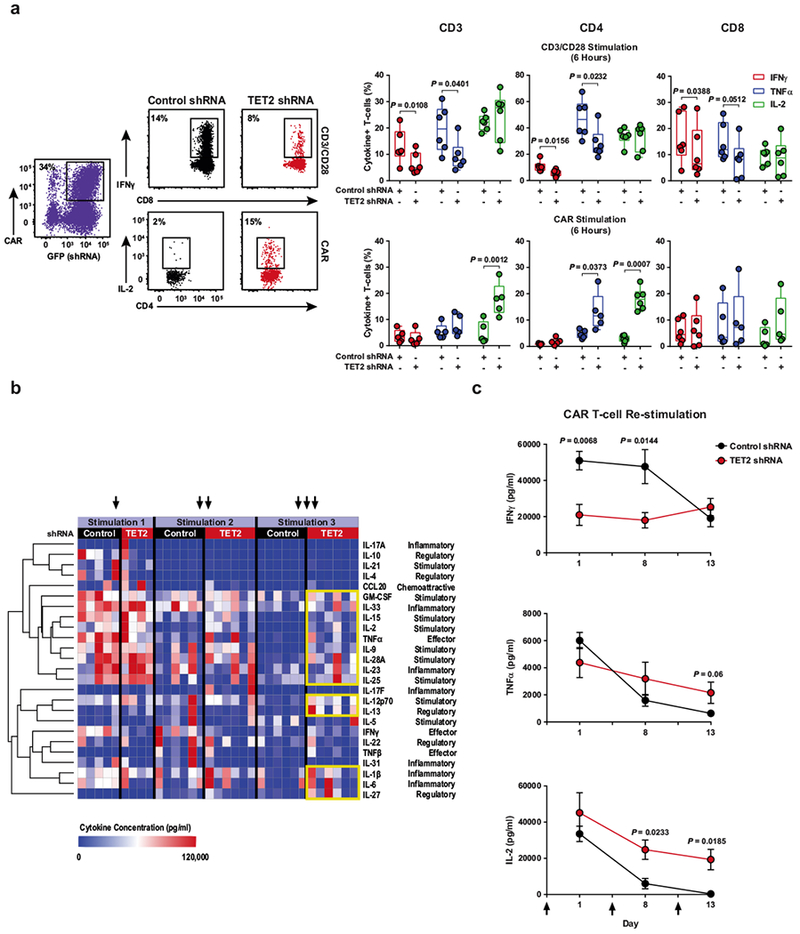
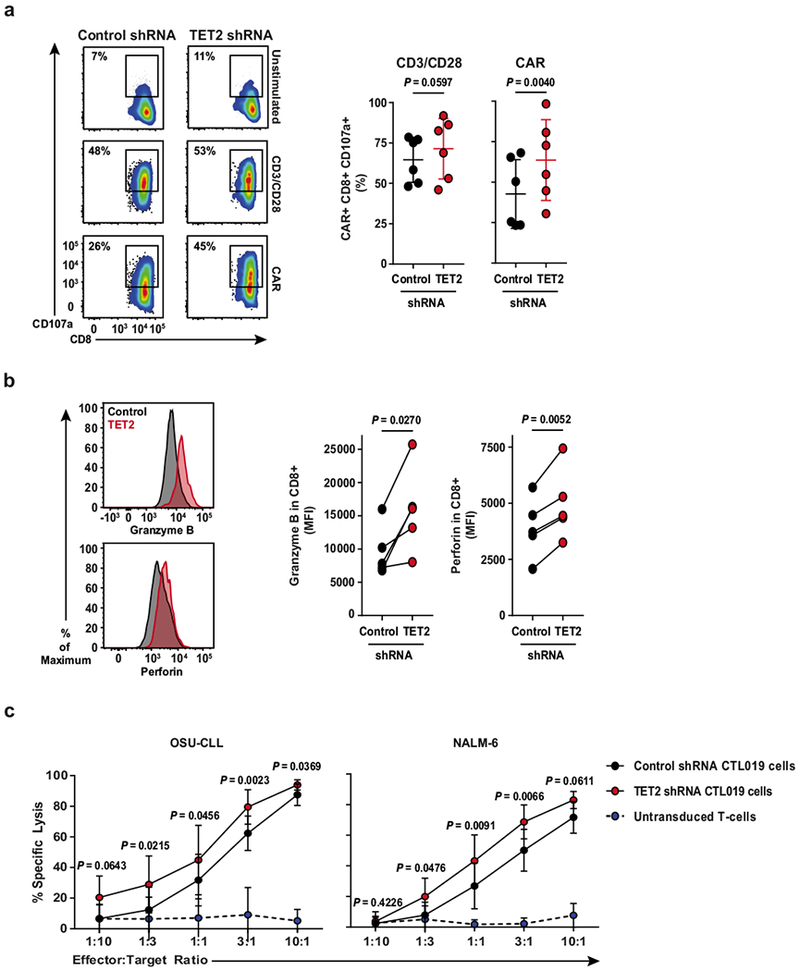
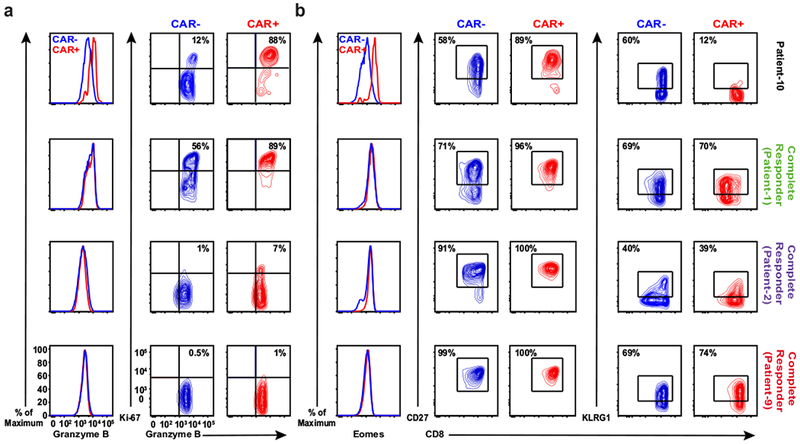
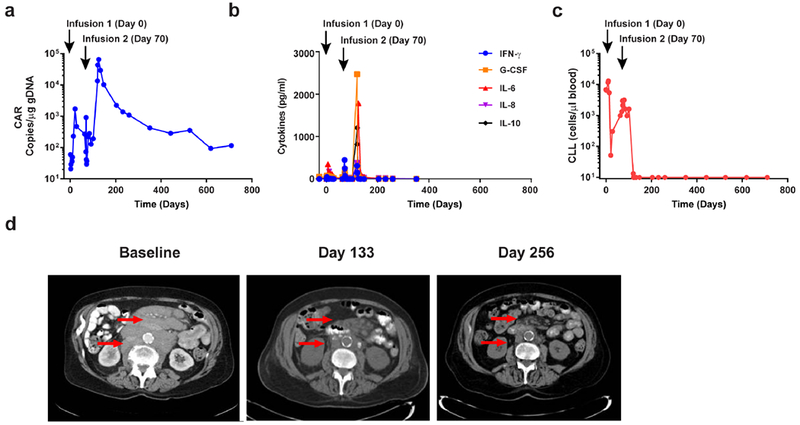
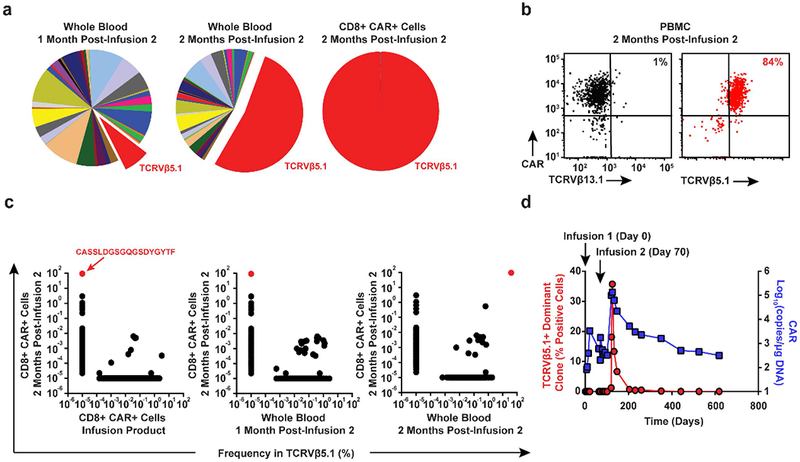
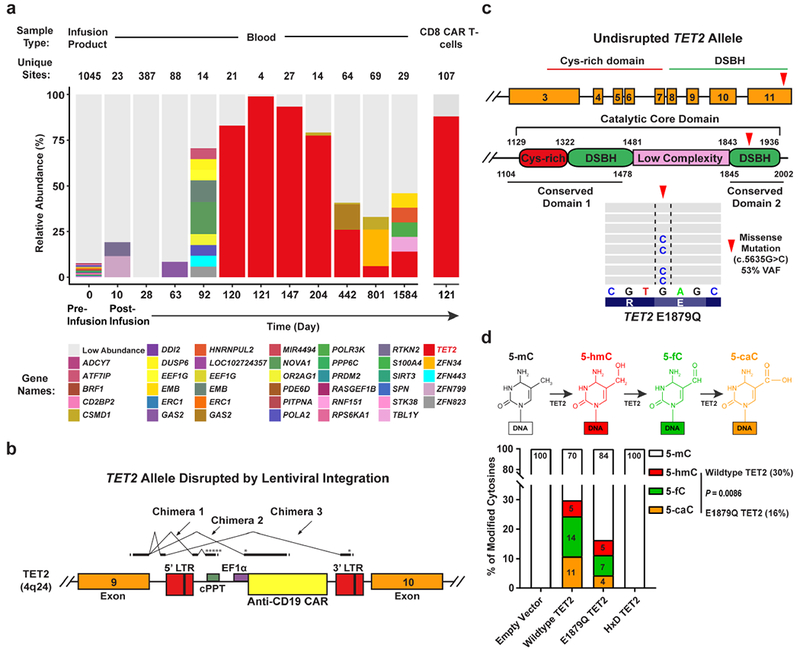
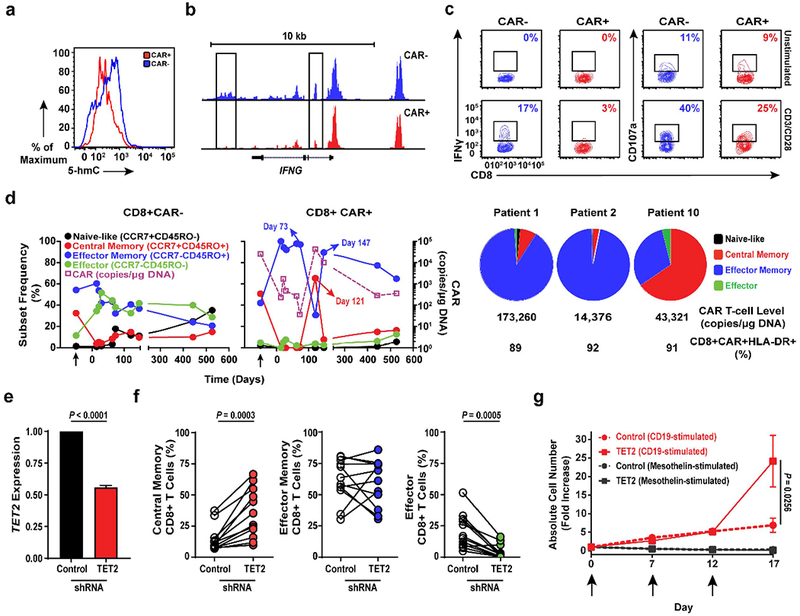
Cancer immunotherapy based on genetically redirecting T cells has been used successfully to treat B cell malignancies1-3. In this strategy, the T cell genome is modified by integration of viral vectors or transposons encoding chimaeric antigen receptors (CARs) that direct tumour cell killing. However, this approach is often limited by the extent of expansion and persistence of CAR T cells4,5. Here we report mechanistic insights from studies of a patient with chronic lymphocytic leukaemia treated with CAR T cells targeting the CD19 protein. Following infusion of CAR T cells, anti-tumour activity was evident in the peripheral blood, lymph nodes and bone marrow; this activity was accompanied by complete remission. Unexpectedly, at the peak of the response, 94% of CAR T cells originated from a single clone in which lentiviral vector-mediated insertion of the CAR transgene disrupted the methylcytosine dioxygenase TET2 gene. Further analysis revealed a hypomorphic mutation in this patient's second TET2 allele. TET2-disrupted CAR T cells exhibited an epigenetic profile consistent with altered T cell differentiation and, at the peak of expansion, displayed a central memory phenotype. Experimental knockdown of TET2 recapitulated the potency-enhancing effect of TET2 dysfunction in this patient's CAR T cells. These findings suggest that the progeny of a single CAR T cell induced leukaemia remission and that TET2 modification may be useful for improving immunotherapies.


Conflict of interest statement

Competing Financial Interests

J.A.F., C.L.N., R.M.Y., B.L.L. M.K., D.L.P., S.F.L., F.D.B., C.H.J. and J.J.M. hold patents related to CTL019 cell therapy. These authors declare no additional financial interests. The remaining authors declare no competing financial interests.

Figures

Extended Data Fig. 1 |
Extended Data Fig. 1 |. Timeline of disease clearance by CAR T cells in Patient-10.
An outline of clinical findings in Patient-10, including the results of bone marrow assessments, tumour cytogenetics and CAR T cell persistence. CTL019 cell infusion time points are indicated by red arrows.
Extended Data Fig. 2 |
Extended Data Fig. 2 |. CAR T cell detection and profiling of immune cell populations in Patient-10 and other responders.
a, Pre- and post-infusion kinetics of CAR T cell expansion (CD3+, CD8+ and CD8) are shown in Patient-10 compared to other responders. The number of circulating CTL019 cells was calculated based on frequencies of CD3+, CD8+ and CD8 CAR T cell populations and absolute cell counts. b, Flow cytometry gating strategy to identify peripheral blood CAR T cells in Patient-10. c, Relative percentages of CTL019 cells in the CD4 and CD8 compartments of this patient. T cells from a healthy subject served as a negative control. d, The persistence of CAR T cells in the peripheral blood of Patient-10 was determined by qPCR. The average threshold cycle (Ct) value obtained from three replicates and a standard deviation (SD) is listed. Calculations of CAR T cell abundance are reported as average marking per cell as well as transgene copies per microgram of genomic DNA. e, Frequencies of circulating B cells in Patient-10 compared to a healthy subject. Pre-gating was performed to exclude dead cells as well as doublets, and all gating thresholds were based on fluorescence minus one (FMO) controls (representative of two independent experiments). f, Enumeration of various immune cell populations in the blood of Patient-10. The frequency of each population is listed in a separate column that corresponds to its phenotypic marker.
Extended Data Fig. 3 |
Extended Data Fig. 3 |. Clonal composition of CAR T cells from Patient-10 and other subjects treated with CTL019.
a, TCRVβ distribution in CD8 (left) and CD8+ (right) CAR T cells in the cellular infusion product of Patient-10. b, Relative frequencies of CAR T cell clones in three patients who had complete responses to CTL019 therapy, summarized as stacked bar graphs. Each colour (horizontal bar) denotes a major cell clone, as marked by lentiviral integration sites. c, Integration site analysis in CAR T cells from two partially responding patients. d, In vivo expansion of CAR T cells in the above patients as determined by quantifying the average CAR transgene copies per microgram DNA at each time point.
Extended Data Fig. 4 |
Extended Data Fig. 4 |. Detection of TET2 chimaeric transcripts in Patient-10 CAR T cells and DNA sequencing for mutation detection.
a, The strategy for detection of polyadenylated RNA corresponding to truncated TET2 transcripts is depicted. Boxes represent the genomic regions between TET2 exons 9 and 10 with the integrated vector present. Blue and red arrows indicate general locations of the forward and reverse primers, which are listed below the diagram. LTR, long terminal repeat; cPPT, polypurine tract; EF1α, elongation factor 1-α promoter. Sequences corresponding to the splice junctions for the three chimaeric messages (five total junctions) are listed in the bottom chart. Underlines indicate consensus splice donors and acceptors. b, Visualization of chimaeric TET2 RT–PCR products. PCR products were separated on a native agarose gel and stained with ethidium bromide. Expected sizes of amplicons are listed above the gel. Truncated transcripts are highlighted by blue boxes. A key to the RT–PCR reactions is shown below the diagram. *Band size not determined (two independent experiments). c, Genes interrogated by the next generation sequencing panel used to analyse DNA isolated from CD8+CAR+ T cells and CAR T cells in Patient-10 at the peak of his response. d, Sanger sequencing of specific amplifications corresponding to the allele that was disrupted by integration of the CAR lentivirus is shown. The mutation that was detected by next generation sequencing of total genomic DNA from CAR+ T cells (Fig. 3c) is not present in the TET2 allele hosting the lentiviral integration site.
Extended Data Fig. 5 |
Extended Data Fig. 5 |. Analysis of DNA methylation variants from HEK293T cells overexpressing TET2.
a, Depiction of sequential oxidations of 5-mC to 5-hmC, 5-fC and 5-caC catalysed by TET2 (top). Dot blots for 5-mC, 5-hmC, 5-fC and 5-caC in genomic DNA (gDNA) isolated from HEK293T cells transfected with the E1879Q TET2 mutant are shown. Assay controls include an empty vector, wild-type TET2 and a catalytically inactive (HxD) TET2 mutant (bottom left). A western blot using anti-FLAG antibody to detect hTET2 in the above cells is also shown. Hsp90α/β was used as a loading control (bottom right). Brightness and contrast were adjusted evenly across blots. b, Original, uncropped DNA (left) and western (right) blots. A dilution series was used for semiquantitative analysis of DNA methylation variants. Representative results of three independent experiments are shown. c, Validation of anti-FLAG and anti-Hsp90α/β antibodies. Serial dilutions of lysates (0.008, 0.04, 0.2, 0.8, 4.0 μg μl−1) obtained from HEK293T cells transfected with wild-type TET2. Gels were probed by western blot. Both chemiluminescence (left) and digital (right) images were captured, demonstrating that these antibodies exhibit specificity for the expected FLAG tag and Hsp90 based on molecular weight markers. d, 5-mC, 5-hmC, 5-fC and 5-caC nucleosides were analysed at fixed concentrations using LC–MS/MS to generate standard curves. The area under the curve (AUC) was calculated for each MS/MS fragment. In the case of 5-hmC, the slope was further adjusted because of quality control analysis of an equimolar mixture of oligonucleotides, each containing a single modification. e, Analysis of gDNA from individual biological replicates within each HEK293T cell group. The top chart lists the raw AUCs that were converted to relative amounts of modified cytosine (middle) according to their signal intensities from the respective standard curves. The percentage of each modified cytosine calculated for each sample is shown in the bottom chart. Results are from three independent experiments.
Extended Data Fig. 6 |
Extended Data Fig. 6 |. Global chromatin profiling of CAR+ and CAR T cells from Patient-10.
a, Venn diagrams of high-confidence differential ATAC–seq regions (left) and enrichment of those peaks in regions of the diagrams (right) in CAR+ and CARCD8+ T cells expanded from Patient-10 (two biological replicates analysed in two independent experiments). Boxes extend from the 25th to 75th percentiles, the middle line denotes the median and whiskers show minimum and maximum. b, Gene Ontology terms associated with chromatin regions that are significantly more open in CD8+CAR+ T cells from Patient-10 compared to their matched CD8+CAR T cell counterparts. c, Ontology analysis for chromatin regions that are less accessible in CD8+CAR+ T cells than in CD8+CAR T cells. d, Enrichment of transcription factor (TF) binding motifs in chromatin regions gained or lost in CAR+ compared to CART cells from Patient-10. Transcription factor motifs that were potentially more accessible in increased ATAC–seq peaks of CAR+ T cells included E26 transformation-specific (ETS) (GABPα, ELF1, Elk4) and zinc finger (ZF) transcription factor (Sp1) binding sites that are known to be enriched in human CD8+ T cells before differentiation occurs. Transcription factor motifs that were potentially less accessible owing to reduced ATAC–seq peaks in CAR+ T cells from Patient 10 (NF-κB, IRF1, NFAT–AP1 and CTCF) are enriched in terminally differentiated effector and exhausted T cells and have known key roles in forming the epigenetic landscape that programs their biology.
Extended Data Fig. 7 |
Extended Data Fig. 7 |. The differentiation state of CAR T cells in Patient-10 compared to other responders over time.
a, Representative contour plots of flow cytometric data depicting the frequency of CAR+ and CARCD8+ T cells in Patient-10 that express HLA-DR. The proportions of these cells that express CD45RO and CCR7 as determinants of differentiation status are shown. Contour plot insets indicate the frequencies of the gated cell populations. b, Example gating strategy used to determine the differentiation phenotype of CD8+CAR+ and CAR T cells from a complete responder (top left). Line graphs depict the differentiation state of these cell populations in other responding patients over time and are plotted with corresponding CAR T cell levels in the blood, as determined by qPCR.
Extended Data Fig. 8 |
Extended Data Fig. 8 |. Effect of TET2 expression on T cell differentiation and viability.
a, Representative flow cytometry plots showing the differentiation state of healthy donor CD8+CAR+ T cells after transduction with a scrambled shRNA (control) or shRNA targeting TET2. Insets define frequencies of gated populations. b, Frequencies of healthy subject CAR+CD8+ (top) and CAR+CD4+ (bottom) T cells according to differentiation phenotype following control or TET2 shRNA transduction (n = 10; pooled results from four independent experiments). P values were determined using a two-tailed, paired Student’s t-test. c, Comparison of the expression levels of TET2 in naive and memory CD8+ T cell subsets from three healthy donors. Two variants encoding different isoforms have been identified for this gene in humans. Expression levels of each TET2 variant were estimated by measuring the probe intensity from microarray analysis. d, Viability of CAR+ T cells transduced with a TET2 shRNA or scrambled control and restimulated with K562 cells expressing CD19 (n = 12; pooled results from three independent experiments). Each arrow indicates the time point at which CAR T cells were exposed to antigen. Error bars depict s.e.m.
Extended Data Fig. 9 |
Extended Data Fig. 9 |. CAR T cell cytokine profiles following TET2 inhibition.
a, Representative flow cytometry of acute intracellular cytokine production by healthy donor (n = 6; three independent experiments) CAR T cells transduced with a TET2 shRNA or a scrambled control shRNA (left). Production of IFNγ, TNFα and IL-2 by total CD3+, CD4+ and CD8+ CAR T cells is shown. These cells were stimulated with beads coated with anti-CD3 and anti-CD28 antibodies (top right) or CAR anti-idiotypic antibodies (bottom right). Boxes represent the 25th to 75th percentiles, the middle line denotes the median and whiskers depict minimum and maximum. b, Heat map and cluster analysis of cytokine profiles for CAR T cells transduced with a TET2 shRNA or scrambled control and serially restimulated with irradiated K562 cells expressing CD19 are shown. Colours represent scaled cytokine data corresponding to each stimulation time point. Hierarchal clustering was used to generate the cluster dendrogram and cytokine response groups. c, Production of IFNγ (top), TNFα (middle) and IL-2 (bottom) by TET2 knockdown or control CAR T cells (n = 6; three independent experiments) following restimulation with CD19 antigen. Black arrows indicate when CAR T cells were exposed to CD19-expressing K562 cells. Error bars denote s.e.m. All P values were determined using a two-tailed, paired Student’s t-test.
Extended Data Fig. 10 |
Extended Data Fig. 10 |. Effect of TET2 knockdown on the cytotoxic machinery of CAR T cells.
a, Flow cytometry plots showing the frequency of TET2 knockdown or control CAR T cells expressing CD107a (a marker of cytolysis) following CD3 and CD28 or CAR-specific stimulation (left). Summarized data from analysis of CAR T cells manufactured from n = 6 different healthy donors is shown (right). b, Representative histograms illustrating expression levels of granzyme B and perforin in CAR T cells in the setting of TET2 inhibition as compared to its counterpart control (left). Pooled data from CAR T cells of n = 5 healthy donors are summarized on the right. c, Cytotoxic capacity of CTL019 cells (transduced with a TET2 or scrambled control shRNA) after overnight co-culture with luciferase-expressing OSU-CLL (left) or NALM-6 (right) cells. Untransduced T cells were included as an additional group to control for non-specific lysis. P values were determined using a two-tailed, paired Student’s t-test. All data were pooled from three independent experiments.
Extended Data Fig. 11 |
Extended Data Fig. 11 |. Effector and memory molecule expression by CAR T cells from Patient-10 compared to those from other responding subjects.
a, Expression of granzyme B (left) and the frequency of CARand CAR+ T cells co-expressing granzyme B/Ki-67 (right panel) at the peak of in vivo CTL019 expansion in Patient-10 compared to three other complete responders. b, Representative histograms of intracellular Eomes expression (left), and contour plots depicting frequencies of CD27-(middle) and KLRG1-expressing (right) lymphocytes in the same cell populations of these patients. These results are representative of three experiments repeated independently with comparable findings.
Figure 1.
Figure 1.. Evaluation of clinical responses following adoptive transfer of CAR T-cells in a CLL patient.
a, In vivo expansion and persistence of CAR T-cells. b, Longitudinal measurements of serum cytokines before and after CAR T-cell infusions. c, Total number of circulating B-CLL cells before and after CTL019 therapy. d, Sequential computed tomography imaging of chemotherapy-refractory lymphadenopathy. Red arrows indicate masses that were progressively reduced following the second CAR T-cell infusion.
Figure 2.
Figure 2.. Analysis of CAR T-cell clonal expansion in a CLL patient who had a delayed therapeutic response.
a, Frequency of TCRVβ gene segment usage in the blood of Patient-10 1-month (left pie chart) and 2-months (middle pie chart) following the second CAR T-cell infusion. TCRVβ clonotype frequencies in sorted CAR T-cells at the peak of expansion following are also shown (rightmost pie chart). b, Flow cytometric proportions of TCRVβ5.1 versus TCRVβ13.1 (negative control) positive CAR T-cells. c, Abundance of different TCRVβ5.1 clones in CAR+ T-cells at the peak of activity relative to other time points. Red dots indicate the dominant TCRVβ5.1 clone (representative of 2 independent experiments). d, Expansion kinetics of the TCRVβ5.1+ dominant clone following a second infusion of CAR T-cells plotted in parallel with CTL019 levels. Percentages of positive cells were calculated based on the results of a qPCR assay designed to amplify clonotype-specific sequences.
Figure 3.
Figure 3.. Investigation of CAR lentiviral integration sites and TET2 dysfunction in Patient-10.
a, Longitudinal CAR T-cell clonal abundance as marked by integration sites. Different colors (horizontal bars) indicate major cell clones. A key to the sites, named for the nearest gene, is shown below the graph (abundances < 3% binned as “Low Abundance”). b, Diagram of the vector at the TET2 integration site locus illustrating splicing into the vector provirus to yield truncated transcripts. Asterisks denote ectopic stop codons. Splice junctions 3 chimeric messages (5 total junctions) are listed below the diagram. Splice donors and acceptors are underlined. LTR, long terminal repeat; cPPT, polypurine tract; EF1α, elongation factor 1 alpha promoter. c, Domain organization of TET2 and location of a residue mutated in Patient-10 CAR+ and CAR− T-cells. Cysteine (Cys)-rich and catalytic double-stranded beta-helix (DSBH) domains are also shown (red arrow denotes an amino acid change resulting from a missense mutation). Representative results of next generation sequencing appear beneath the structural diagrams. Each gray bar denotes a DNA fragment. A single-base G/C nucleotide substitution is highlighted by dashed lines above the consensus sequence. d, Diagram of the TET2-catalyzed sequential oxidations of 5-mC to 5-hmC and to 5-fC and 5-caC is shown (top). Genomic levels of 5-mC, 5-hmC, 5-fC, and 5-caC modifications produced by the E1879Q TET2 mutant shown as the percent of total cytosine modifications. Percentages derived from the mean of 3 independent experiments are shown. P-values were determined using a two-tailed, paired student’s t-test.
Figure 4.
Figure 4.. Effect of TET2 alteration on the epigenetic landscape of CAR T-cells.
a, Total 5-hmC levels in CAR+ and CAR− T-cells cultured from Patient-10. Histograms depict the intensity of intracellular 5-hmC staining. b, Genome browser views of ATAC enrichment at the IFNG locus of Patient-10 T-cells. c, Frequencies of IFNγ and CD107a expressing T-cells expanded from Patient-10 unstimulated or stimulated with anti-CD3/CD28 antibodies. Insets indicate frequencies of gated cell populations. d, Longitudinal differentiation phenotypes of CAR+ (left) and CAR− (middle) T-cells from Patient-10. Arrows denote pre-infusion CAR T-cells. Differentiation phenotype at the peak of in vivo activity is shown in two long-term complete responding CLL patients (Patients-1 and -2) compared to Patient-10 (right). Pie slices represent T-cell subset frequencies. The CTL019 cell level and frequencies of activated CAR T-cells expressing HLA-DR at the peak of each patient’s response are listed below the pie charts. e, TET2 expression in healthy donor CD8+ T-cells transduced with a scrambled shRNA (control) or TET2 sequences. Error bars depict s.e.m. f, Frequencies of central memory (left), effector memory (middle) and effector CD8+ T cells following shRNA-mediated knock-down of TET2 (n = 12; pooled results from 4 independent experiments). g, Proliferation of healthy donor CTL019 cells (n = 8; 3 independent experiments) in response to repetitive stimulation (arrows) with K562 cells expressing CD19 or mesothelin (negative control). CAR T-cells were transduced to express either a scrambled control or TET2-specific shRNA. P values were determined using a two-tailed, paired student’s t-test. All error bars depict the s.e.m.

Comment in

  • Tumour tamed by transfer of one T cell.
    Maus MV. Maus MV. Nature. 2018 Jun;558(7709):193-195. doi: 10.1038/d41586-018-05251-5. Nature. 2018. PMID: 29895908 No abstract available.
  • Success stories.
    Harjes U. Harjes U. Nat Rev Cancer. 2018 Aug;18(8):465. doi: 10.1038/s41568-018-0039-y. Nat Rev Cancer. 2018. PMID: 29934503 No abstract available.

References

    1. Porter DL, Levine BL, Kalos M, Bagg A & June CH Chimeric antigen receptor-modified T cells in chronic lymphoid leukemia. The New England journal of medicine 365, 725–733, doi:10.1056/NEJMoa1103849 (2011). - DOI - PMC - PubMed
    1. Schuster SJ et al. Chimeric Antigen Receptor T Cells in Refractory B-Cell Lymphomas. The New England journal of medicine 377, 2545–2554, doi:10.1056/NEJMoa1708566 (2017). - DOI - PMC - PubMed
    1. Maude SL et al. Tisagenlecleucel in Children and Young Adults with B-Cell Lymphoblastic Leukemia. The New England journal of medicine 378, 439–448, doi:10.1056/NEJMoa1709866 (2018). - DOI - PMC - PubMed
    1. Porter DL et al. Chimeric antigen receptor T cells persist and induce sustained remissions in relapsed refractory chronic lymphocytic leukemia. Science translational medicine 7, 303ra139, doi:10.1126/scitranslmed.aac5415 (2015). - DOI - PMC - PubMed
    1. Savoldo B et al. CD28 costimulation improves expansion and persistence of chimeric antigen receptor-modified T cells in lymphoma patients. The Journal of clinical investigation 121, 1822–1826, doi:10.1172/JCI46110 (2011). - DOI - PMC - PubMed

Publication types

MeSH terms