. 2018 Jun;558(7709):288-291.
doi: 10.1038/s41586-018-0163-6. Epub 2018 May 30.

Rapid recovery of life at ground zero of the end-Cretaceous mass extinction

Affiliations

Rapid recovery of life at ground zero of the end-Cretaceous mass extinction

Christopher M Lowery et al. Nature. 2018 Jun.

Abstract

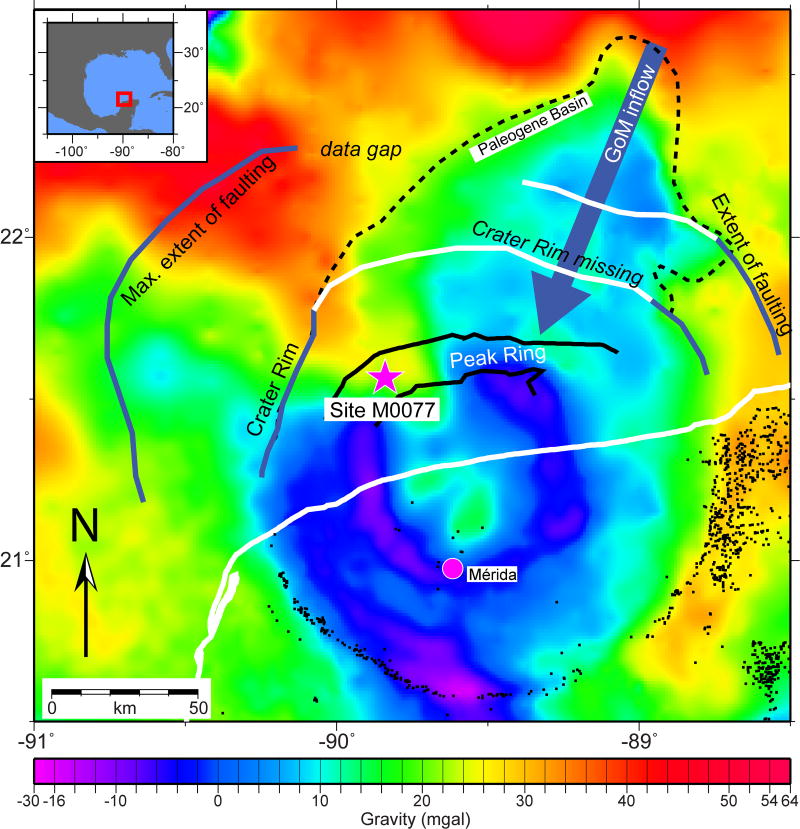
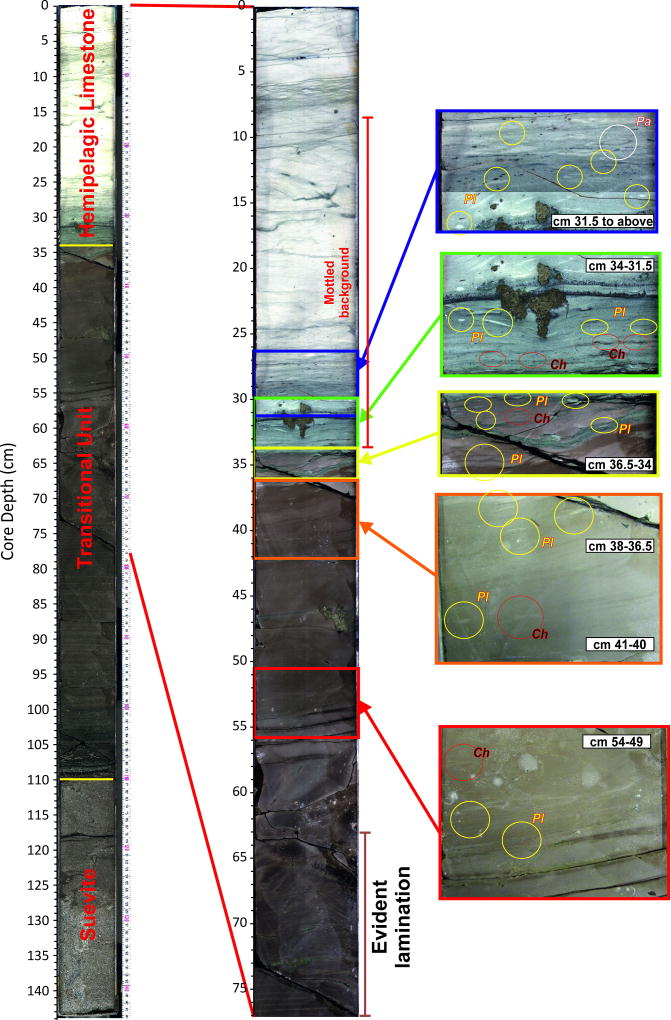
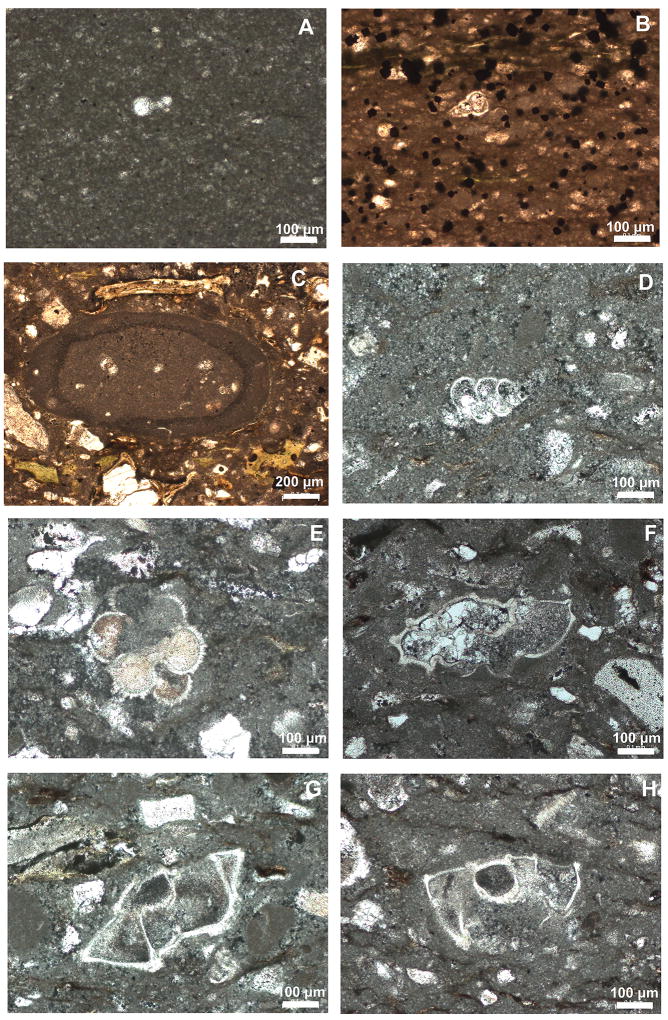
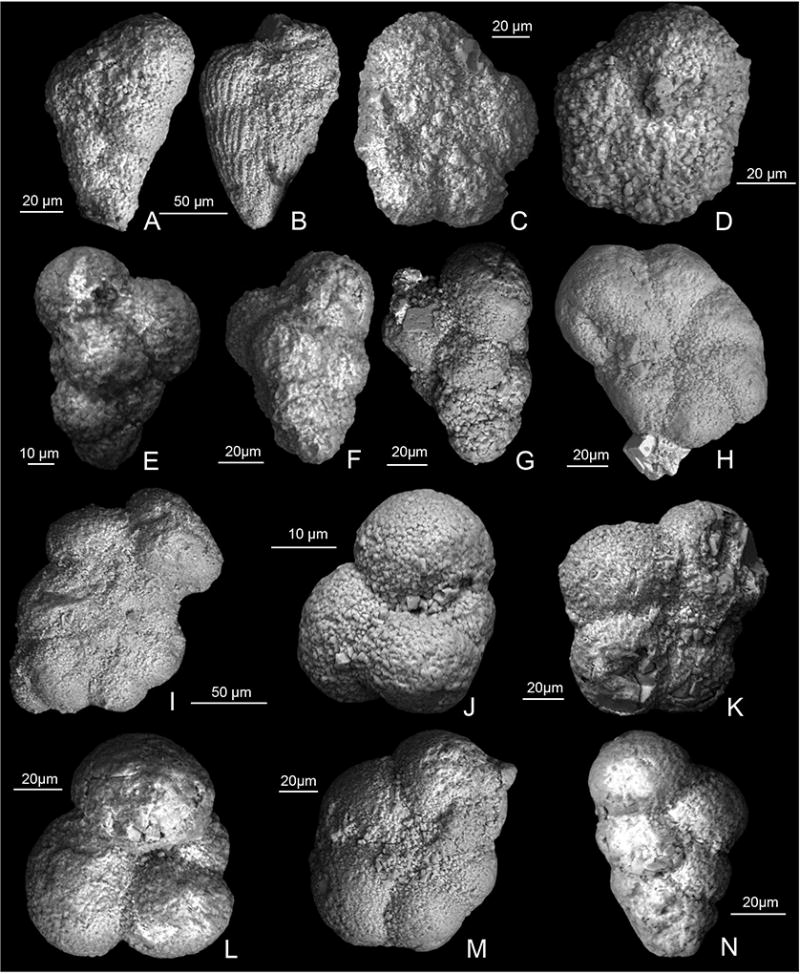
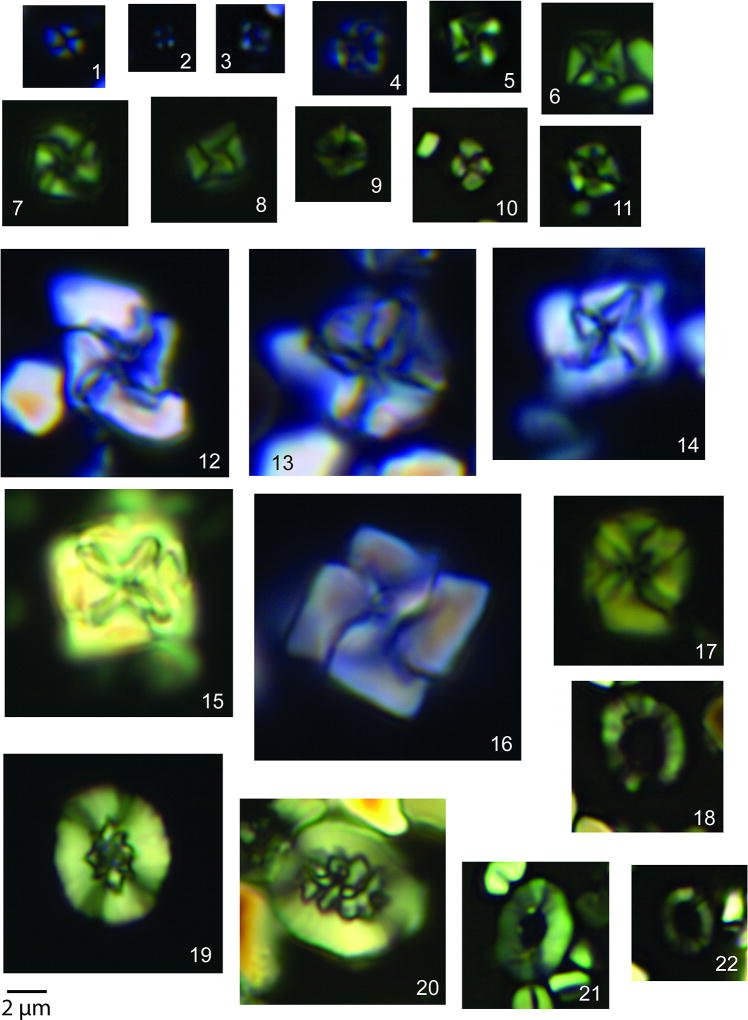
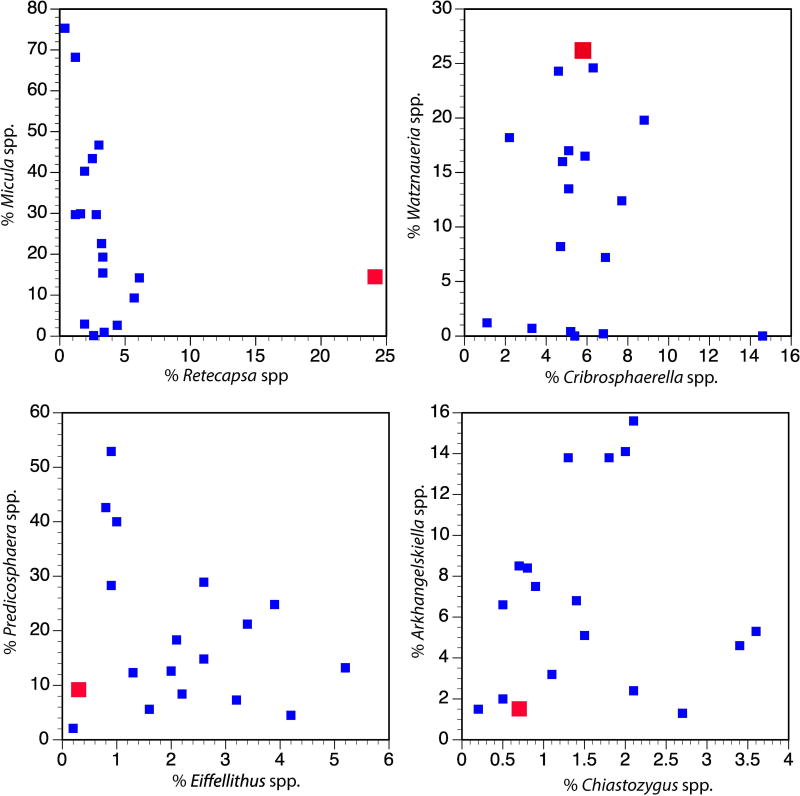
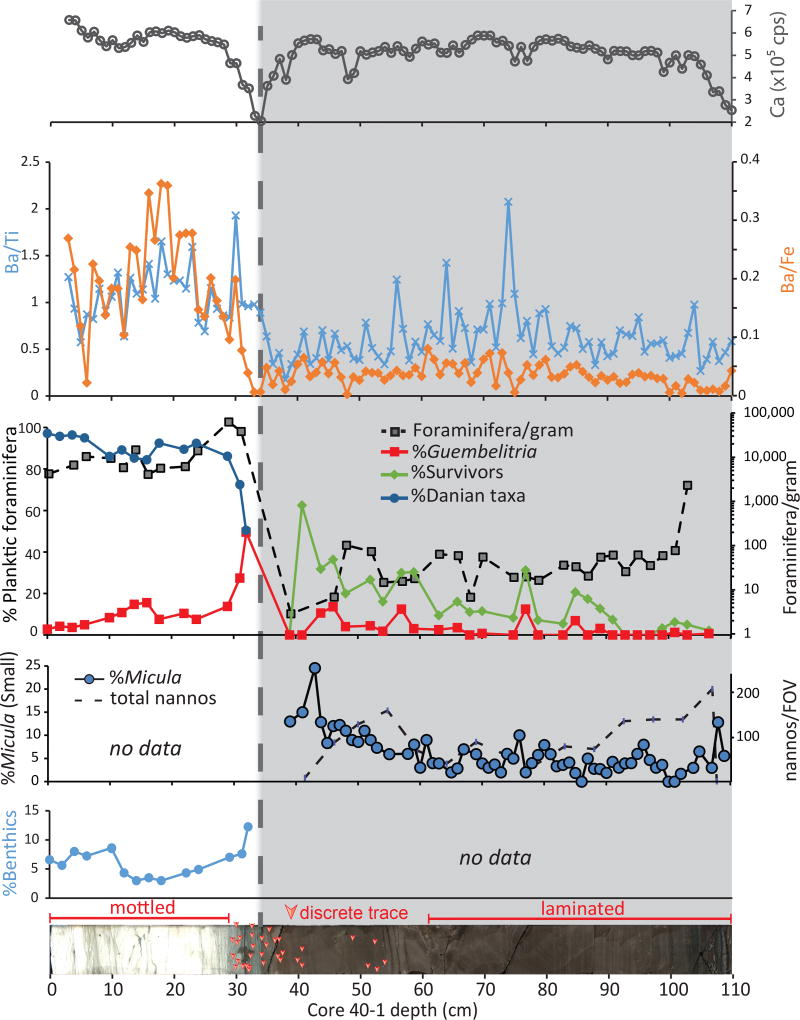
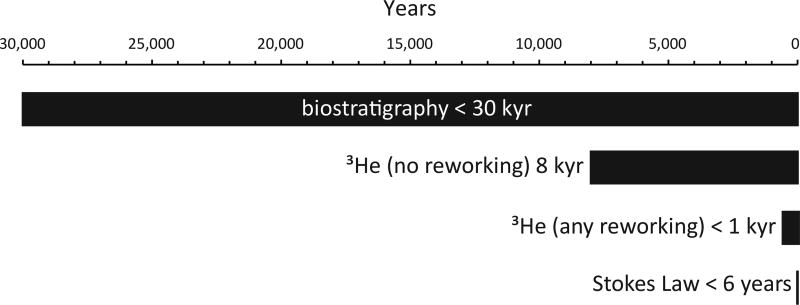
The Cretaceous/Palaeogene mass extinction eradicated 76% of species on Earth1,2. It was caused by the impact of an asteroid3,4 on the Yucatán carbonate platform in the southern Gulf of Mexico 66 million years ago 5 , forming the Chicxulub impact crater6,7. After the mass extinction, the recovery of the global marine ecosystem-measured as primary productivity-was geographically heterogeneous 8 ; export production in the Gulf of Mexico and North Atlantic-western Tethys was slower than in most other regions8-11, taking 300 thousand years (kyr) to return to levels similar to those of the Late Cretaceous period. Delayed recovery of marine productivity closer to the crater implies an impact-related environmental control, such as toxic metal poisoning 12 , on recovery times. If no such geographic pattern exists, the best explanation for the observed heterogeneity is a combination of ecological factors-trophic interactions 13 , species incumbency and competitive exclusion by opportunists 14 -and 'chance'8,15,16. The question of whether the post-impact recovery of marine productivity was delayed closer to the crater has a bearing on the predictability of future patterns of recovery in anthropogenically perturbed ecosystems. If there is a relationship between the distance from the impact and the recovery of marine productivity, we would expect recovery rates to be slowest in the crater itself. Here we present a record of foraminifera, calcareous nannoplankton, trace fossils and elemental abundance data from within the Chicxulub crater, dated to approximately the first 200 kyr of the Palaeocene. We show that life reappeared in the basin just years after the impact and a high-productivity ecosystem was established within 30 kyr, which indicates that proximity to the impact did not delay recovery and that there was therefore no impact-related environmental control on recovery. Ecological processes probably controlled the recovery of productivity after the Cretaceous/Palaeogene mass extinction and are therefore likely to be important for the response of the ocean ecosystem to other rapid extinction events.


Conflict of interest statement

The authors declare no competing financial interests.

Figures

Extended Data Figure 1
Extended Data Figure 1. Location of Site M0077 in the Chicxulub Crater as seen on gravity data
Black dots are cenotes. Modified from Gulick et al..
Extended Data Figure 2
Extended Data Figure 2. Trace fossils in Core 40 Section 1 of IODP Hole M0077A
Discrete burrows in the upper transitional unit and the lower limestone are circled and labelled by the genus. Above the base of the limestone, trace fossils are abundant; representative examples are highlighted in the lower 10 cm of this interval. Ch: Chondrites; Pl: Planolites; Pa: Paleophycus.
Extended Data Figure 3
Extended Data Figure 3. Reworked Cretaceous foraminifera in the transitional unit
A Globigerinelloides sp., 364-M0077A-40R-1-W 55–56 cm; B Heterohelix sp. 364-M0077A-40R-1-W 104–105 cm; C clast of pelagic limestone containing older Cretaceous planktic foraminifera 364-M0077A-40R-1-W 106–110 cm; D Praegublerina pseudotessera 364-M0077A-40R-1-W 118–129cm ; E Racemiguembelina powelli 364-M0077A-40R-1-W 118–129 cm; F Globotruncana bulloides 364-M0077A-40R-1-W 110–118 cm; G Globotruncanita stuartiformis 364-M0077A-40R-1-W 118–129 cm; H Globotruncanita elevata 364-M0077A-40R-1-W 118–129 cm. Scale bars are all 100 µm.
Extended Data Figure 4
Extended Data Figure 4. Scanning electron micrographs of planktic foraminifera from Core 40
A–B, examples of common reworked Cretaceous biserials, 364-M0077A-40R-1 102–103 cm; C Muricohedbergella monmouthensis 364-M0077A-40R-1-W 102–103 cm; D Muricohedbergella holmdelensis 364-M0077A-40R-1-W 44–45 cm; E Guembelitria cretacea 364-M0077A-40R-1-W 44–45; F Guembelitria cretacea 364-M0077A-40R-1-W 29–30 cm; G Guembelitria cretacea 364-M0077A-40R-1-W 29–30 cm; H Parvularugoglobigerina eugubina 364-M0077A-40R-1-W 31–32 cm; I Parvularugoglobigerina eugubina 364-M0077A-40R-1-W 31–32 cm; J Globoconusa daubjergensis 364-M0077A-40R-1-W 31–32 cm; K Eoglobigerina eobulloides 364-M0077A-40R-1-W 29–30 cm; L Eoglobigerina edita 364-M0077A-40R-1-W 29–30 cm; M Praemurica taurica 364-M0077A-40R-1-W 10–11 cm; N Chiloguembelina morsei 364-M0077A-40R-1-W 10–11 cm.
Extended Data Figure 5
Extended Data Figure 5. Small and regular sized nannofossils in the transitional unit
All photographs from Core 364-M0077-40R-1-W. Plates 1–11, small Micula spp. 1. 55–56 cm; 2. 41–42 cm; 3. 95–96 cm; 4. 41–42 cm; 5. 90–91 cm; 6. 94–95 cm; 7. 91–92 cm; 8. 91–92 cm; 9. 45–46 cm; 10. 100–101 cm; 11. 81–82 cm. Plates12–17 Regular-sized Micula spp. 12. 44–45 cm; 13. 41–42 cm; 14. 51–52 cm; 15. 105–106 cm; 16. 97–98 cm; 17. 36–37 cm. Plates 19–20 Regular-sized Retecapsa spp. 19. 85–86 cm; 20. 100–101 cm. 18, 21, 22 Small Retecapsa spp. 21. 71–72 cm, 22. 100–101 cm, 18. 100–101 cm. Scale bar is 2 µm.
Extended Data Figure 6
Extended Data Figure 6. Relative abundance of major Maastrichtian calcareous nannoplankton
Small blue squares are Maastrichtian sites from the global compilation; larger red squares are from the transitional unit at Site M0077. These data demonstrate the unusual abundance of Watznaueria and Retecapsa at our site.
Fig. 1
Fig. 1. Paleoproductivity indicators in the earliest Paleocene at Site M0077
The shaded area is the transitional unit and the dashed line represents the contact with the overlying pelagic limestone. Top to bottom: XRF-derived calcium abundance in counts per second (cps); Ba/Ti and Ba/Fe ratios; %abundances key planktic foraminiferal groups, including %Guembelitria, %survivors (i.e., Cretaceous species known to survive the impact), and % Danian taxa (i.e., species which evolved after the impact), as percentage of total foraminifera; foraminifera per gram of sediment, plotted on a log scale; %Micula smaller than 2µm (against total nannoplankton) and nannoplankton abundance (total occurrences per field of view – FOV); %benthic foraminifera (against total foraminifera); Core image of 364-M0077A-40R-1 0–110 cm Core 40R-1, 34 to 110 cm (616.58 to 617.33 meters below seafloor) with discrete trace fossils highlighted by arrows (see Extended Data Fig. 2 for larger version of this image).
Figure 2
Figure 2. Constraints on the age of the transitional unit
Figure 3
Figure 3. Early Danian foraminifer abundances and I/(Ca+Mg) oxygenation proxy
Left: Key Danian planktic foraminifera. Normal perforate planktics (Eoglobigerina, Globanomalina, Parasubbotina, and Praemurica) are rare throughout the study interval and not plotted here; all are plotted as % total planktic foraminifera. Right: I/(Ca+Mg) redox proxy, indicating well-oxygenated conditions in the Chicxulub crater through this interval.

References

    1. Jablonski D. Extinctions in the fossil record. In: Lawton JH, May RM, editors. Extinction Rates. New York: Oxford University Press; 1995. pp. 25–44.
    1. Schulte P, et al. The Chicxulub asteroid impact and mass extinction at the Cretaceous-Paleogene Boundary. Science. 2010;327:1214–1218. - PubMed
    1. Alvarez LW, Alvarez W, Asaro F, Michel HV. Extraterrestrial cause for the Cretaceous/Tertiary extinction. Science. 1980;208:1095–1108. - PubMed
    1. Smit J, Hertogen J. An extraterrestrial event at the Cretaceous-Tertiary boundary. Nature. 1980;285:198–200.
    1. Renne PR, et al. Time scales of critical events around the Cretaceous-Paleogene Boundary. Science. 2013;339:684–687. - PubMed

Publication types