. 2018 May;557(7707):668-673.
doi: 10.1038/s41586-018-0139-6. Epub 2018 May 30.

Pyramidal cell regulation of interneuron survival sculpts cortical networks

Affiliations

Pyramidal cell regulation of interneuron survival sculpts cortical networks

Fong Kuan Wong et al. Nature. 2018 May.

Abstract

Complex neuronal circuitries such as those found in the mammalian cerebral cortex have evolved as balanced networks of excitatory and inhibitory neurons. Although the establishment of appropriate numbers of these cells is essential for brain function and behaviour, our understanding of this fundamental process is limited. Here we show that the survival of interneurons in mice depends on the activity of pyramidal cells in a critical window of postnatal development, during which excitatory synaptic input to individual interneurons predicts their survival or death. Pyramidal cells regulate interneuron survival through the negative modulation of PTEN signalling, which effectively drives interneuron cell death during this period. Our findings indicate that activity-dependent mechanisms dynamically adjust the number of inhibitory cells in nascent local cortical circuits, ultimately establishing the appropriate proportions of excitatory and inhibitory neurons in the cerebral cortex.


Conflict of interest statement

The authors declare no competing interests.

Figures
Extended Data Figure 1
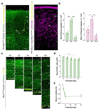
Extended Data Figure 1. Extensive cell death in layer 2-6 pyramidal cells.
a, Coronal sections through the S1 cortex of P4 NexCre/+;Fucci2 (left) and P7 Nkx2-1-Cre;RCLtdTomato (right) mice immunostained for cleaved caspase-3 (yellow) and mCherry (green, left) or tdTomato (magenta, right). b, Quantification of density of cleaved caspase-3 cells in pyramidal neurons (left, green bars) and MGE interneurons (right, magenta bars) during postnatal development (for pyramidal neurons, ANOVA, F = 73.6, ***p = 0.003 [P2 vs P4], ***p = 0.00006 [P4 vs P7], n = 3 animals for all ages; for MGE interneurons, ANOVA, F = 16.91, *p = 0.027 [P5 vs P7], **p = 0.0029 [P7 vs P10], n = 3 animals for all ages). c, Coronal sections through the barrel cortex of NexCre/+;Fucci2 mice during postnatal development immunostained for mCherry (green) and CTGF (yellow). d, Total number of pyramidal cells excluding subplate cells in the neocortex of NexCre/+;Fucci2 mice (ANOVA, F = 4.83 and *p = 0.03; n = 3 animals for P2 and P5, and 4 animals for P3, P4 and P21). e, Temporal variation in the percentage of pyramidal cells excluding the subplate contribution during postnatal development. Data is shown as mean ± SEM. Scale bars, 100 μm.
Extended Data Figure 2
Extended Data Figure 2. Interneuron cell loss in the barrel field during postnatal development.
a, Coronal sections through S1BF of Nkx2-1-Cre;RCLtdTomato mice (magenta, MGE interneurons) during postnatal development counterstained with DAPI (grey). b, Total number of MGE/POA interneurons in S1BF of Nkx2-1-Cre;RCLtdtomato mice during postnatal development (ANOVA, F = 6.40 and *p = 0.03; n = 4 animals for all ages). Data is shown as mean ± SEM. Scale bar, 100 μm.
Extended Data Figure 3
Extended Data Figure 3. Alteration of pyramidal cell activity affects interneuron density but not distribution.
a, Coronal sections through S1BF cortex immunostained for GABA (magenta) and NeuN (green) and counterstained with DAPI (grey) from P21 NexCre/+ mice injected with hM3Dq-mCherry virus followed by vehicle or CNO treatment. b, Quantification of the density of GABA (left) and NeuN+ but GABA- (right) cells in P21 mice injected with hM3Dq-mCherry followed by vehicle (grey bars) or CNO (magenta bars) treatment (2-tailed Student’s unpaired t-test, **p = 0.005 [GABA], p = 0.68 [NeuN+/GABA-], n = 4 animals for vehicle, n = 3 animals for CNO conditions). c, d Quantification of the distribution of PV (left) and SST (right) in P21 NexCre/+ mice injected at P0 with hM3Dq-mCherry (c) or hM4Di-mCherry (d) and treated with vehicle (grey bars) or CNO (magenta bars) during P5-P8 (2-way ANOVA, Ftreatment = 0.48, p = 0.50 [hM3Dq PV], Ftreatment = -0.04, p = 0.99 [hM3Dq SST], Ftreatment = 0.88, p = 0.37 [hM4DI PV], Ftreatment = 0.79, p = 0.39 [hM4DI SST]; for PV, n = 7 animals for hM3Dq and hM4DI -CNO, 6 animals for hM3Dq +CNO, and 5 animals for hM4DI +CNO; for SST, n = 9 animals for hM3Dq -CNO, 7 animals for hM3Dq +CNO and hM4Di -CNO, and 5 animals for hM4DI +CNO). e, Coronal sections through auditory cortex immunostained for parvalbumin (PV, magenta, left) or somatostatin (SST, magenta, right)) and counterstained with DAPI (grey) from P21 NexCre/+ mice injected with hM3Dq-mCherry viruses followed by vehicle or CNO treatment. f, Quantification of the density of PV (right) and SST (left) in auditory cortex in P21 mice injected with hM3Dq-mCherry followed by vehicle (grey bars) or CNO (magenta bars) treatment (2-tailed Student’s unpaired t-test, p = 0.574 [PV], p = 0.419 [SST], n = 4 animals for both). Data is shown as mean ± SEM. Scale bars, 100 μm.
Extended Data Figure 4
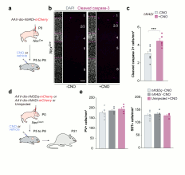
Extended Data Figure 4. CNO control experiments.
a, Schematic of experimental design. b, Coronal sections through S1 of P8 NexCre mice injected with AAV8-dio-hM4Di-mCherry at P0 and treated with (+CNO) or without (-CNO) between P5 and P8, immunostained for cleaved caspase-3 (magenta) and counterstained with DAPI (grey). c, Quantification of the density of cleaved caspase-3 cells in P8 mice injected with hM4Di-mCherry and treated (magenta bar) or not treated (grey bar) with CNO between P5-P8 (2-tailed Student’s unpaired t-test, ***p =0.009, n = 8 animals for -CNO, and n = 7 animals for +CNO). d, Schematic of experimental design for CNO control experiments. e, Quantification of the density of PV (left) and SST (right) cells in P21 mice injected with hM3Dq-mCherry or hM4Di-mCherry and not treated with CNO (grey bars), or not injected with viruses and treated with CNO (magenta bars) between P5-P8 (ANOVA, p = 0.24 [PV] and p = 0.65 [SST] for PV, n = 7 animals for hM3Dq and hM4DI -CNO, 4 animals for non-injected +CNO; for SST, n = 9 animals for hM3Dq -CNO, 7 animals for hM4Di -CNO, and 4 animals for non-injected +CNO). Data is shown as mean ± SEM. Scale bar, 100 µm.
Extended Data Figure 5
Extended Data Figure 5. Alteration of pyramidal cell activity beyond the normal period of interneuron cell death does not affect interneuron survival or distribution.
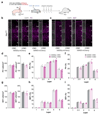
a, Schematic of experimental design. b, c, Coronal sections through S1BF immunostained for parvalbumin (PV, b) or somatostatin (SST, c) and counterstained with DAPI (grey) from P21 NexCre/+ mice injected with hM3Dq-mCherry (left) and hM4Di-mCherry (right) viruses followed by vehicle or CNO treatment. d, g, Quantification of the density of PV (d) and SST (g) cells in P21 hM3Dq-mCherry injected animals (left bars) and hM4Di-mCherry injected animals (right bars) followed by vehicle (grey bars) and CNO (magenta bars) treatment at P10-P13 (2-tailed unpaired Student’s t-test, p = 0.99 and p = 0.087 respectively; for SST, 2-tailed unpaired Student’s t-test, p = 0.56 and p = 0.37 respectively; n = 4 animals for hM3Dq –CNO and 3 animals for all other groups)). e, f, h, i, Quantification of the distribution of PV (e, f) and SST (h, i) in mice injected with hM3Dq-mCherry (e, h) and hM4Di-mCherry (f, i) followed by vehicle (grey bars) or CNO (magenta bars) treatment at P10-P13 (2-way ANOVA, Ftreatment = 0.15, p = 0.71 [hM3Dq PV], Ftreatment = 0.60, p = 0.48 [hM3Dq SST], Ftreatment = 1.00, p = 0.37 [hM4DI PV], Ftreatment = 1.78, p = 0.25 [hM4DI SST]; n = 4 animals for hM3Dq –CNO and 3 animals for all other groups). Data is shown as mean ± SEM. Scale bar, 100 µm.
Extended Data Figure 6
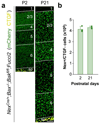
Extended Data Figure 6. Loss of Bak and Bax prevents programmed cell death in pyramidal cells.
a, Coronal sections through S1BF from P2 and P21 NexCre/+;Bak-/-;Baxfl/fl;Fucci2 mice immunostained for mCherry (green) and CTGF (yellow). b, Total number of pyramidal cells (excluding subplate cells) in the neocortex of NexCre/+;Bak-/-;Baxfl/fl;Fucci2 mice (2-tailed Student’s unpaired t-test, p = 0.30; n = 3 animals for both ages). Data is shown as mean ± SEM. Scale bar, 100 µm.
Extended Data Figure 7
Extended Data Figure 7. Loss of Bak and Bax in pyramidal cells or MGE/POA interneurons affects densities but not lamination of MGE/POA interneurons.
a, Quantification of the distribution of PV (left) and SST (right) interneurons in P30 control (grey bars), NexCre/+;Bak-/-;Baxfl/fl (dark magenta bars) and Nkx2-1-Cre;Bak-/-;Baxfl/fl (light magenta bars) mice (2-way ANOVA, Ftreatment = 3.56, p = 0.10 [NexCre/+ PV], Ftreatment = 0.44, p = 0.53 [Nkx2-1-Cre PV], Ftreatment = 0, p = 0.99 [NexCre/+ SST], Ftreatment = 0.44, p = 0.54 [Nkx2-1-Cre SST], n = 4 animals for NexCre/+;Bak-/-;Baxfl/fl [PV] and 5 animals for all other groups). b, Quantification of the fold change in the density of PV (top) and SST (bottom) interneurons in NexCre/+;Bak-/-;Baxfl/fl (dark magenta bars) and Nkx2-1-Cre;Bak-/-;Baxfl/fl (light magenta bars) mice compared to their respective controls (2-tailed Student’s unpaired t-test, p = 0.90 [PV], p = 0.67 [SST], for PV, n = 4 animals for NexCre/+;Bak-/-;Baxfl/fl, 6 animals for Nkx2-1-Cre;Bak-/-;Baxfl/fl, for SST, n = 5 animals for both NexCre/+;Bak-/-;Baxfl/fl and Nkx2-1-Cre;Bak-/-;Baxfl/fl). c, Coronal sections through the motor cortex of P30 Bak+/+;Baxfl/fl and NexCre/+;Bak-/-;Baxfl/fl mice immunostained for parvalbumin (PV, left) and somatostatin (SST, right) and counterstained with DAPI (grey). d, Quantification of the density of PV (left) and SST (right) cells in the motor cortex control and pyramidal cell-specific Bax/Bak double mutant mice at P30 (2-tailed Student’s unpaired t-test, *p = 0.02 [PV], *p = 0.01 [SST], for PV, n = 4 animals for both and for SST, n = 3 animals for both). Data is shown as mean ± SEM. Scale bar, 100 µm.
Extended Data Figure 8
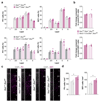
Extended Data Figure 8. PTEN expression in deep layer cortical interneurons and effects of loss of Pten function on neurons and blood vessels.
a, Coronal sections through layer 5 of S1BF from Nkx2-1-Cre;RCLtdTomato mice at P5, P7, P8 and P10, immunostained PTEN and counterstained with DAPI (grey). PTEN expression is shown as a custom LUT in tdTomato-masked cells. b, Cumulative distribution of mean PTEN intensity in layer 5 and 6 MGE/POA interneurons (Kruskal-Wallis test, ***p = 0; n = 7270 cells [P5], 4544 cells [P7], 6780 cells [P8] and 5043 cells [P10] from 3 different animals at each age). c, Coronal sections through S1BF from Ptenfl/fl and Lhx6-Cre;Ptenfl/fl mice at P16 immunostained for GABA (red, left), NeuN (green, middle) and isolectin B4 (IB4, cyan, right) and counterstained with DAPI (grey). d, Quantification of the density of GABA (far left), NeuN+ but GABA- (left) cells, and vessel area (right) and diameter (far right) in P16 Ptenfl/fl (grey bars) and Lhx6-Cre;Ptenfl/fl (magenta bars) animals (2-tailed unpaired Student’s t-test, **p = 0.0035 [GABA], *p = 0.0326 [vessel area], p = 0.0810 [vessel diameter]; Kolmogorov-Smirnov test, p = 0.1000 [NeuN+/GABA- cells], n = 3 animals for both genotypes). e, Quantification of the distribution of PV (left), SST (right) cells in P16 Ptenfl/fl (grey bars) and Lhx6-Cre;Ptenfl/fl (magenta bars) mice (2-way ANOVA, Fgenotype= 0.29, p = 0.61 [PV]; Fgenotype= 0.0004, p = 0.98 [SST]; n = 4 Ptenfl/fl animals and 3 Lhx6-Cre;Ptenfl/fl animals). Data is shown as mean ± SEM. Scale bars, 100 µm.
Extended Data Figure 9
Extended Data Figure 9. Pharmacological PTEN inhibition during the interneuron cell death period increases interneuron survival.
a, f, Schematics of experimental design. b, Coronal sections through S1BF from P10 mice injected at P7-P8 with vehicle (left) or BpV(pic) (right) stained for isolectin B4 (IB4, cyan) and DAPI (grey). c, Quantification of blood vessel area (left) and diameter (right) in P10 mice treated with vehicle (grey bars) or BpV(pic) (magenta bars) (Kolmogorov-Smirnov test [vessel area], p = 0.60; 2-tailed unpaired Student’s t-test [vessel diameter], p = 0.58, n = 3 animals for each group). d, g, Coronal sections through S1BF from P21 mice injected at P7-P8 (d) or P12-P13 (g) with vehicle (left) or BpV(pic) (right) and immunostained for PV and SST and counterstained with DAPI. e, h, Quantification of the density of PV (left) and SST (right) in S1BF from P21 mice injected at P7-P8 (e) or P12-P13 (h) with vehicle (grey bars) or BpV(pic) (magenta bars) (P7-P8 groups: 2-tailed unpaired Student’s t-test, *p = 0.04 [PV], *p = 0.03 [SST]; n = 7 animals for each group, P12-P13 groups: 2-tailed unpaired Student’s t-test, p = 0.84 [PV], p = 0.82 [SST], n = 5 animals for each group). Data is shown as mean ± SEM. Scale bars, 100 µm.
Figure 1
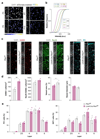
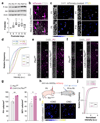
Figure 1. Consecutive waves of programmed cell death for pyramidal cells and interneurons in the early postnatal cortex.
a, c, Coronal sections through the primary somatosensory cortex (S1) of NexCre;Fucci2 (a) and Nkx2-1-Cre;RCLtdTomato (c) mice during postnatal development. b, Total number of pyramidal cells in the entire neocortex of NexCre;Fucci2 mice (ANOVA, F = 4.17, *p = 0.02; n = 4 [P2 and P5], 3 [P7] and 5 [P10 and P21] animals). d, Total number of MGE/POA interneurons in the entire neocortex of Nkx2-1-Cre;RCLtdTomato mice (ANOVA, F = 26.80, *p = 0.01; n = 4 animals for all ages). e, Temporal variation in pyramidal cell and MGE/POA interneuron percentages. f, Total number of MGE/POA interneurons in superficial (L1-L4) and deep layers (L5 and L6) of the neocortex (2-way ANOVA, Finteraction = 1.01,*p = 0.03 and **p = 0.002; n = 3 animals for all ages). Data is shown as mean ± SEM. Scale bars, 100 µm.
Figure 2
Figure 2. Interneuron activity levels predict cell death.
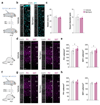
a, Schematic of experimental design. b, Total number of MGE/POA interneurons in layer 2/3 S1BF of Nkx2-1-Cre;RCLtdTomato mice (n = 3 animals for all ages). Data is shown as mean ± SEM. c, ROI imaged at P7 (left) and P8 (right). d, Raster plots showing the occurrence of calcium events at P7 for the four neurons shown in (c). e, Box plots illustrating event rates for P7 interneurons that live past P8 (magenta) and interneurons that die by P8. Two-sided Mann-Whitney test, p = 0.03; n = 18 for cells that die at P8 and 153 for cells that live beyond P8, from 3 different pups. f, ROC analysis showing the ability of P7 event rates to discriminate between cells that die by P8 and cells that live past P8, AUC (area under the curve) = 0.65, *p = 0.025. Scale bar, 15 µm.
Figure 3
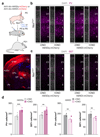
Figure 3. Bidirectional modulation of pyramidal cell activity regulates the extent of interneuron cell death.
a, Schematic of experimental design. mCherry expression at P21 following AAV injection at P0. b, c, Coronal sections through S1BF from P21 NexCre/+ mice injected with hM3Dq-mCherry or hM4Di-mCherry viruses followed by vehicle or CNO treatment. d, Quantification of the density of PV and SST cells at P21. Two-tailed Student’s unpaired t-test, for hM3DQ, ***p = 0.0002, **p = 0.003; for hM4DI, **p = 0.006 [PV], **p = 0.004 [SST]; for hM3DQ, n = 7 and 9 animals for -CNO PV and SST, respectively; 6 and 7 animals for +CNO PV and SST, respectively; for hM4DI, n = 7 animals for -CNO and 5 animals for +CNO for both PV and SST. Data is shown as mean ± SEM. Scale bars, 500 µm (a) and 100 µm (b).
Figure 4
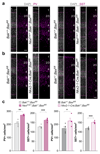
Figure 4. Survival of pyramidal cells rescues interneuron cell death.
a, b, Coronal sections through S1BF from P30 Bak+/+;Baxfl/fl and NexCre/+;Bak-/-;Baxfl/fl (a), and Bak+/-;Baxfl/fl and Nkx2-1-Cre;Bak-/-;Baxfl/fl (b) mice. c, Quantification of the density of PV and SST cells in pyramidal cell-specific Bax/Bak mutant mice, MGE/POA interneuron-specific Bax/Bak mutant mice and their respective controls at P30. Two-tailed Student’s unpaired t-test, for NexCre/+, **p = 0.001, ***p = 0.0002; for Nkx-2-1-Cre, *p = 0.04, ***p = 0.00004; n = 4 animals for NexCre/+;Bak-/-;Baxfl/fl [PV] and 5 animals for all other groups. Data is shown as mean ± SEM. Scale bar, 100 µm.
Figure 5
Figure 5. Pyramidal cell activity controls interneuron cell survival through PTEN inhibition.
a, P-Akt, Akt and Actin protein levels in the neocortex. Friedman test, p = 0.001; *p = 0.03 for P5 vs P8, *p = 0.0101 for P5 vs P9 and ***p = 0 for P5 vs P7; n = 6 animals for all ages. b, Coronal section through layer 2/3 S1BF from Nkx2-1-Cre;RCLtdTomato mice at P8. Some interneurons have much higher PTEN levels (arrowhead) than most (open arrowheads). c, Coronal sections through layer 2/3 S1BF from Nkx2-1-Cre;RCLtdTomato mice at P5, P7, P8 and P10. PTEN expression is shown as a custom LUT in tdTomato-masked cells. d, Cumulative distribution of mean PTEN intensity in layer 2/3 MGE interneurons. Kruskal-Wallis, ***p = 1.7x10-54; n = 223 cells [P5], 184 cells [P7], 394 cells [P8] and 395 cells [P10] from 3 different animals at each age. e, f, Coronal sections through S1BF from Ptenfl/fl and Lhx6-Cre;Ptenfl/fl mice at P16. g, Quantification of the density of PV and SST cells in P16 Ptenfl/fl and Lhx6-Cre;Ptenfl/fl mice. Two-tailed Student’s t-test, *p = 0.04, **p = 0.005; n = 4 Ptenfl/fl and 3 Lhx6-Cre;Ptenfl/fl animals. h, Schematic of experimental paradigm. i, Coronal sections through layer 2/3 S1BF from P8 NexCre/+ mice injected with hM3Dq-mCherry at P0 followed by vehicle or CNO treatment. PTEN expression is shown as a custom LUT in GABA-masked cells. j, Normalised cumulative distribution of PTEN intensity in layer 2/3 S1BF GABAergic cells in vehicle and CNO-treated mice. Kolmogorov-Smirnov test, *** p = 1.05x10-111; n = 1191 cells [vehicle] and 3231 cells [CNO] from 4 vehicle and 8 CNO-treated animals. Data is shown as mean ± SEM. Scale bars, 50 μm (b), 100 μm (c, e, f), and 10 μm (j).

References

    1. Beaulieu C. Numerical data on neocortical neurons in adult rat, with special reference to the GABA population. Brain Res. 1993;609:284–292. - PubMed
    1. Meyer HS, et al. Inhibitory interneurons in a cortical column form hot zones of inhibition in layers 2 and 5A. Proc Natl Acad Sci USA. 2011;108:16807–16812. - PMC - PubMed
    1. Gabbott PL, Somogyi P. Quantitative distribution of GABA-immunoreactive neurons in the visual cortex (area 17) of the cat. Exp Brain Res. 1986;61:323–331. - PubMed
    1. Hendry SH, Schwark HD, Jones EG, Yan J. Numbers and proportions of GABA-immunoreactive neurons in different areas of monkey cerebral cortex. J Neurosci. 1987;7:1503–1519. - PMC - PubMed
    1. DeFelipe J, Alonso-Nanclares L, Arellano JI. Microstructure of the neocortex: comparative aspects. J Neurocytol. 2002;31:299–316. - PubMed

Publication types