. 2018 Apr 4:2018:3242574.
doi: 10.1155/2018/3242574. eCollection 2018.

Apelin-13 Is an Early Promoter of Cytoskeleton and Tight Junction in Diabetic Macular Edema via PI-3K/Akt and MAPK/Erk Signaling Pathways

Affiliations

Apelin-13 Is an Early Promoter of Cytoskeleton and Tight Junction in Diabetic Macular Edema via PI-3K/Akt and MAPK/Erk Signaling Pathways

Yang Li et al. Biomed Res Int. .

Abstract

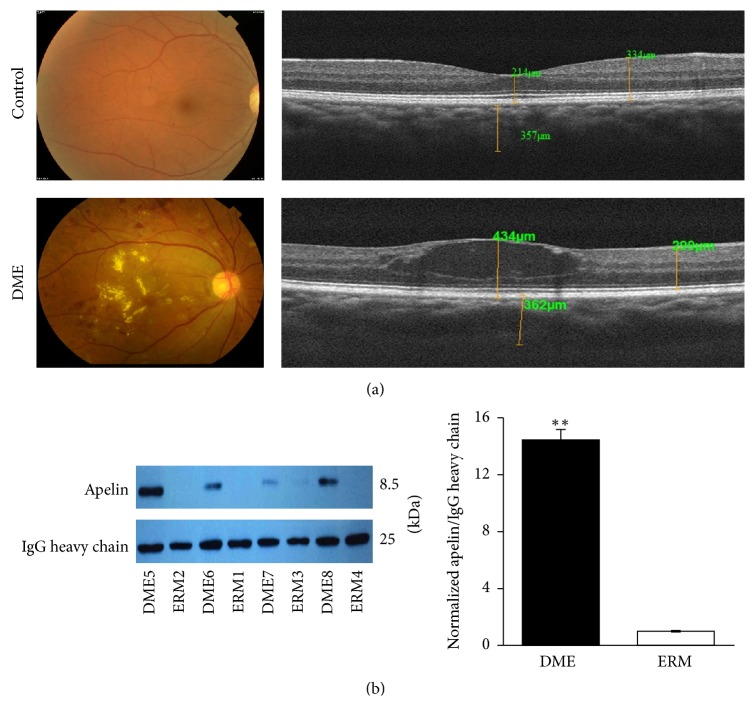
Diabetic macular edema is major cause of vision loss associated with diabetic retinopathy. Breakdown of blood-retinal barrier, especially inner BRB, is an early event in pathogenesis of DR. Apelin, an endogenous ligand of APJ, mediates angiogenesis and is involved in the development of DR. The present study aimed to investigate effects and mechanism of apelin-13 in vascular permeability during DME. We verified apelin-13 was upregulated in DME patients' vitreous. High glucose incubation led to a progressive increase of apelin-13, APJ, cytoskeleton, and tight junction proteins, including VE-Cadherin, FAK, Src, ZO-1, and occludin. Apelin-13 promoted HRMEC proliferation and migration and phosphorylation of both cytoskeleton and tight junction under both normal and high glucose conditions. Besides, apelin-13 activated PI-3K/Akt and MAPK/Erk signaling pathways, including PLCγ1, p38, Akt, and Erk both in HRMEC and in C57BL/6 mice. Meanwhile, F13A performed opposite effects compared with apelin-13. In in vivo study, apelin-13 was also upregulated in retina of db/db mice. Taken together, apelin-13 increased biologic activity of HRMEC, as well as expression of both cytoskeleton and tight junction in DME via PI-3K/Akt and MAPK/Erk signaling pathways. Apelin-13 as an early promoter of vascular permeability may offer a new perspective strategy in early treatment of DR.


Figures

Figure 1
Figure 1
Apelin is elevated in the vitreous of human diabetic patients suffering from diabetic retinopathy. (a) showed significant retinal swelling, especially in the macular and perimacular zones compared to normal control, with ocular fundus color image and SD-OCT. (b) Western blot image and the analysis of human vitreous fluid (equal volume loaded) revealed a pronounced induction of apelin (8.5 kDa) in DME patients. ∗∗P < 0.01 versus control one, repeated measurement analysis of variance.
Figure 2
Figure 2
Apelin induces cell proliferation, migration, and increased expression of cytoskeleton and tight junction proteins in HRMECs. According to the MTS (a) and transwell assay (b-c, 200x magnification) results, HRMECs proliferation and migration capability were increased in a dose-dependent manner, significantly higher in the apelin group, compared with the control one, and the optimum concentration was 100 ng/ml. (d) IF staining showed that the phosphorylation of VE-Cadherin was upregulated after being treated with apelin in HRMECs. Scale bar = 50 μm for (d). (e–g) The western blot results showed that the phosphorylation of cytoskeleton and tight junction were also upregulated in a dose-dependent way after being stimulated with apelin. Protein intensity was quantified by Image J software and expressed as fold of change relative to control (mean ± SD, n = 3). ∗∗∗P < 0.001, ∗∗P < 0.01, P < 0.05 versus control one, Student's t-test.
Figure 3
Figure 3
High glucose increases the expression of apelin, cytoskeleton, and tight junction proteins in HRMECs. (a–e) The PCR results showed that the expression of apelin, its receptor APJ, the phosphorylation of VE-Cadherin, FAK, and Src increased with median and high glucose ECM medium, compared with normal glucose one. IF results revealed that the expression of apelin was increased glucose concentration independently. Scale bar = 50 μm for (f). The protein expression of APJ (g), phosphorylation of VE-Cadherin (h), FAK (i), and Src (j) were higher under median and high glucose conditions using western blot, compared with the control one. Protein intensity was quantified by Image J software and expressed as fold of change relative to control (mean ± SD, n = 3). ∗∗∗P < 0.001, ∗∗P < 0.01, P < 0.05 versus control one, Student's t-test. NG: normal glucose; MG: middle glucose; HG: high glucose.
Figure 4
Figure 4
Inhibition of apelin receptor APJ using F13A decreased cell proliferation, migration, and the expression of cytoskeleton and tight junction proteins in HRMECs under high glucose condition. (a–c) According to the MTS and transwell assay results, the HRMECs proliferation and migration capability were decreased in a dose-dependent manner, significantly lower in the F13A group, compared with the control one, and the optimum concentration was 20 ng/ml. (d-e) IF staining showed that the phosphorylation of occludin and ZO-1 was downregulated after being treated with F13A in HRMECs under high glucose condition. Cells were stained with DAPI for visualization of nuclei (blue). Scale bar = 50 μm for (d and e). (f-g) The western blot results showed that the phosphorylation of cytoskeleton and tight junction were also downregulated in a dose-dependent way after being stimulated with F13A. Protein intensity was quantified by Image J software and expressed as fold of change relative to control (mean ± SD, n = 3). ∗∗∗P < 0.001, ∗∗P < 0.01 versus control one, Student's t-test.
Figure 5
Figure 5
Apelin plays roles on HRMECs via PI-3K/Akt and MAPK/Erk signaling pathways. The protein expression of phosphorylated PLCγ1 (a, e), p38 (b, f), Akt (c, g), and Erk (d, h) was higher under high glucose- and apelin-treated conditions, compared with control one. On the contrary, F13A decreased the phosphorylation of the four proteins under high glucose condition (i–l). Protein intensity was quantified by Image J software and expressed as fold of change relative to control (mean ± SD, n = 3). ∗∗∗P < 0.001, ∗∗P < 0.01, P < 0.05 versus control one, Student's t-test. NG: normal glucose; MG: middle glucose; HG: high glucose.
Figure 6
Figure 6
Apelin induces the expression of cytoskeleton and tight junction proteins in C57/BL6 mice via PI-3K/Akt and MAPK/Erk signaling pathways. (a–e) The western blot results found that the expression of APJ and the phosphorylation of cytoskeleton (VE-Cadherin and FAK) and tight junction proteins (occludin and ZO-1) increased significantly in apelin-treated (10 and 100 ng/ml) C57BL/6J mice. (f–h) The phosphorylation of PI-3K/Akt and MEK/Erk signaling pathways, p38, Akt, and Erk also increased significantly. Protein intensity was quantified by Image J software and expressed as fold of change relative to control (mean ± SD, n = 3). ∗∗∗P < 0.001, ∗∗P < 0.01 versus control one, Student's t-test.
Figure 7
Figure 7
Inhibition of apelin receptor APJ with F13A dramatically reduces pathological vascular permeability in db/db mice. (a-b) The IF results showed that the phosphorylation of tight junction proteins (occluding and ZO-1) decreased in F13A treated groups. Cells were stained with DAPI for visualization of nuclei (blue). Scale bar = 50 μm. Images represent results from 3 individual mice in each group. GCL: ganglion cell layer; INL: inner nuclear layer; ONL: outer nuclear layer. Protein intensity was quantified by Image J software and expressed as fold of change relative to control (mean ± SD, n = 3). 1M: 1 month; 9M: 9 months.
Figure 8
Figure 8
Inhibition of apelin receptor APJ with F13A dramatically reduces pathological vascular permeability in db/db mice via PI-3K/Akt and MAPK/Erk signaling pathways. The western blot results revealed that the expression of apelin receptor APJ (a), phosphorylation of cytoskeleton (VE-Cadherin and FAK) (b and c), tight junction (occludin) (d), and PI-3K/Akt and MEK/Erk signaling pathways proteins (e–h) were higher in diabetic retinopathy mice, compared with the F13A treated groups. Protein intensity was quantified by Image J software and expressed as fold of change relative to control (mean ± SD, n = 3). ∗∗∗P < 0.001, ∗∗P < 0.01, P < 0.05 versus control one, Student's t-test. 1C: one-month control; 1M: one month treated with F13A, 3C: 3-month control; 3M: 3 months treated with F13A; 6C: 6-month control; 6M: 6 months treated with F13A; 9C: 9-month control; 9M: 9 months treated with F13A.

Similar articles

Cited by

References

    1. Nentwich M. M., Ulbig M. W. Diabetic retinopathy - ocular complications of diabetes mellitus. World Journal of Diabetes. 2015;6(3):489–499. doi: 10.4239/wjd.v6.i3.489. - DOI - PMC - PubMed
    1. Cheung N., Mitchell P., Wong T. Y. Diabetic retinopathy. Lancet. 2010;376(9735):124–136. doi: 10.1016/S0140-6736(09)62124-3. - DOI - PubMed
    1. Dedania V. S., Bakri S. J. Novel pharmacotherapies in diabetic retinopathy. Middle East African Journal of Ophthalmology. 2015;22(2):164–173. doi: 10.4103/0974-9233.154389. - DOI - PMC - PubMed
    1. Tatemoto K., Hosoya M., Habata Y., et al. Isolation and characterization of a novel endogenous peptide ligand for the human APJ receptor. Biochemical and Biophysical Research Communications. 1998;251(2):471–476. doi: 10.1006/bbrc.1998.9489. - DOI - PubMed
    1. Wang X. L., Tao Y., Lu Q., Jiang Y. R. Apelin supports primary rat retinal Muller cells under chemical hypoxia and glucose deprivation. Peptides. 2012;33(2):298–306. doi: 10.1016/j.peptides.2011.12.015. - DOI - PubMed

MeSH terms