. 2019 Jan;17(1):206-219.
doi: 10.1111/pbi.12958. Epub 2018 Jun 25.

The developmental dynamics of the Populus stem transcriptome

Affiliations

The developmental dynamics of the Populus stem transcriptome

Qing Chao et al. Plant Biotechnol J. 2019 Jan.

Abstract

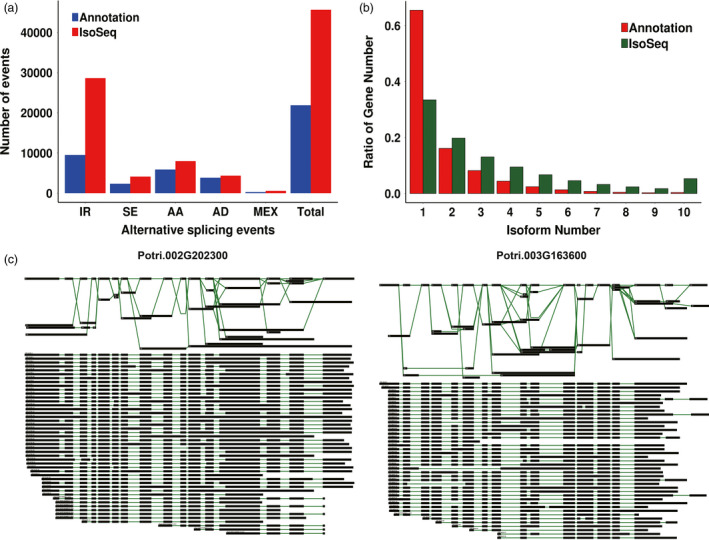
The Populus shoot undergoes primary growth (longitudinal growth) followed by secondary growth (radial growth), which produces biomass that is an important source of energy worldwide. We adopted joint PacBio Iso-Seq and RNA-seq analysis to identify differentially expressed transcripts along a developmental gradient from the shoot apex to the fifth internode of Populus Nanlin895. We obtained 87 150 full-length transcripts, including 2081 new isoforms and 62 058 new alternatively spliced isoforms, most of which were produced by intron retention, that were used to update the Populus annotation. Among these novel isoforms, there are 1187 long non-coding RNAs and 356 fusion genes. Using this annotation, we found 15 838 differentially expressed transcripts along the shoot developmental gradient, of which 1216 were transcription factors (TFs). Only a few of these genes were reported previously. The differential expression of these TFs suggests that they may play important roles in primary and secondary growth. AP2, ARF, YABBY and GRF TFs are highly expressed in the apex, whereas NAC, bZIP, PLATZ and HSF TFs are likely to be important for secondary growth. Overall, our findings provide evidence that long-read sequencing can complement short-read sequencing for cataloguing and quantifying eukaryotic transcripts and increase our understanding of the vital and dynamic process of shoot development.

Keywords: PacBio Iso-Seq; primary growth; secondary growth; stem cell maintenance; transcription factor.


Conflict of interest statement

The authors declare no conflict of interest.

Figures

Figure 1
Figure 1
Anatomic analysis of the poplar apex and stem. (a) Cross section of the shoot apex. (b) Transverse section of internode 1. (c) Transverse section of internode 2. (d) Transverse section of internode 3. (e) Transverse section of internode 4. (f) Transverse section of internode 5. SAM: shoot apical meristem, PC: procambium, MC: metacambium, PP: protophloem, MP: metaphloem, Xy: xylem, Ph: phloem, FC: fascicular cambium, IC: interfascular, C: cambium. Scale bars, 50 μm.
Figure 2
Figure 2
Comparison of Populus trichocarpa v3.0 (Reference) and PacBio Iso‐Seq data isoform annotations. (a) Identified isoforms in three samples (Apex, IN1‐3 and IN4‐5). (b) Distribution of the percentage transcripts with different exon numbers for reference and PacBio Iso‐Seq data. (c) Comparison of gene model and PacBio Iso‐seq isoform length. (d) A pie chart showing the percentage of PacBio Iso‐Seq isoforms that are the same as existing gene models, novel isoforms of known genes and novel isoforms of novel genes.
Figure 3
Figure 3
Alternative splicing events and different isoforms from Iso‐seq. (a) The total number of alternative splicing (AS) events in genes based on Iso‐Seq data and annotated gene models. Annotation, AS events in genes based on gene models; Iso‐Seq, AS events in genes based on Iso‐Seq reads. IR, intron retention. SE, exon skipping. AA, alternative 3′ splice site. AD, alternative 5′ splice site. MEX, mutually exclusive exon. (b) The number of genes with one or more splice isoforms based on gene annotation and Iso‐Seq data. (c) Different isoforms of Potri.002G202300 and Potri.003G163600.
Figure 4
Figure 4
CIRCOS visualization of genomic and transcriptomic features. (a) Poplar chromosomes. (b) Gene density of different samples (Apex, IN1‐3, and IN4‐5). (c) Transcript density of different samples (Apex, IN1‐3, and IN4‐5). (d) Long non‐coding RNA (IncRNA) distribution. (e) Fusion transcript distribution: intra‐chromosome (purple); inter‐chromosome (yellow). The location of centromere regions is labelled according to previous research (Pinosio et al., 2016).
Figure 5
Figure 5
K‐means clustering and enrichment analysis of transcripts differentially expressed between the apex and IN1‐5. (a) K‐means clustering showing the transcriptome expression profiles. Nine clusters were identified based on expression levels in six developmental zones (Apex, IN1, IN2, IN3, IN4 and IN5). (b) Gene Ontology enrichment among the nine clusters. Yellow to red, significant enrichment; white, not significant.
Figure 6
Figure 6
Weighted Gene Co‐expression Network Analysis (WGCNA) of transcription factors. (a) Cluster dendrogram of transcription factors based on expression levels in the six developmental zones (Apex, IN1, IN2, IN3, IN4 and IN5). Each branch represents a gene and each colour below represents a gene co‐expression module. Dynamic tree cut indicates the modules divided based on the gene clustering results. Merged dynamic indicates the modules divided by combining modules with similar expression patterns. (b) Heatmap of transcription factor expression patterns in different samples (Apex, IN1, IN2, IN3, IN4 and IN5). The expression patterns of five modules are shown by the heatmap. The colour bar indicates expression levels from low (blue) to high (red). (c) Distribution of transcription factor families in different WGCNA modules. Each colour represents a co‐expression module, and the numbers indicate the number of transcription factors in the module. (d) Transcription factors highly expressed in the apex, IN1‐3 and IN4‐5.

References

    1. Abdel‐Ghany, S.E. , Hamilton, M. , Jacobi, J.L. , Ngam, P. , Devitt, N. , Schilkey, F. , Ben‐Hur, A. et al. (2016) A survey of the sorghum transcriptome using single‐molecule long reads. Nat. Commun. 7, 11706. - PMC - PubMed
    1. Aichinger, E. , Kornet, N. , Friedrich, T. and Laux, T. (2012) Plant stem cell niches. Annu. Rev. Plant Biol. 63, 615–636. - PubMed
    1. Aida, M. , Ishida, T. and Tasaka, M. (1999) Shoot apical meristem and cotyledon formation during Arabidopsis embryogenesis: interaction among the CUP‐SHAPED COTYLEDON and SHOOT MERISTEMLESS genes. Development, 126, 1563–1570. - PubMed
    1. Aida, M. , Vernoux, T. , Furutani, M. , Traas, J. and Tasaka, M. (2002) Roles of PIN‐FORMED1 and MONOPTEROS in pattern formation of the apical region of the Arabidopsis embryo. Development, 129, 3965–3974. - PubMed
    1. Alexa, A. , Rahnenführer, J. and Lengauer, T. (2006) Improved scoring of functional groups from gene expression data by decorrelating GO graph structure. Bioinformatics, 22, 1600–1607. - PubMed

Publication types

MeSH terms

Substances

LinkOut - more resources