

Optical Coherence Tomography Angiography Compared With Optical Coherence Tomography Macular Measurements for Detection of Glaucoma
- PMID: 29852029
- PMCID: PMC6142951
- DOI: 10.1001/jamaophthalmol.2018.1627
Optical Coherence Tomography Angiography Compared With Optical Coherence Tomography Macular Measurements for Detection of Glaucoma
Abstract
Importance: Whether optical coherence tomography angiography (OCT-A) outperforms OCT to detect glaucoma remains inconclusive.
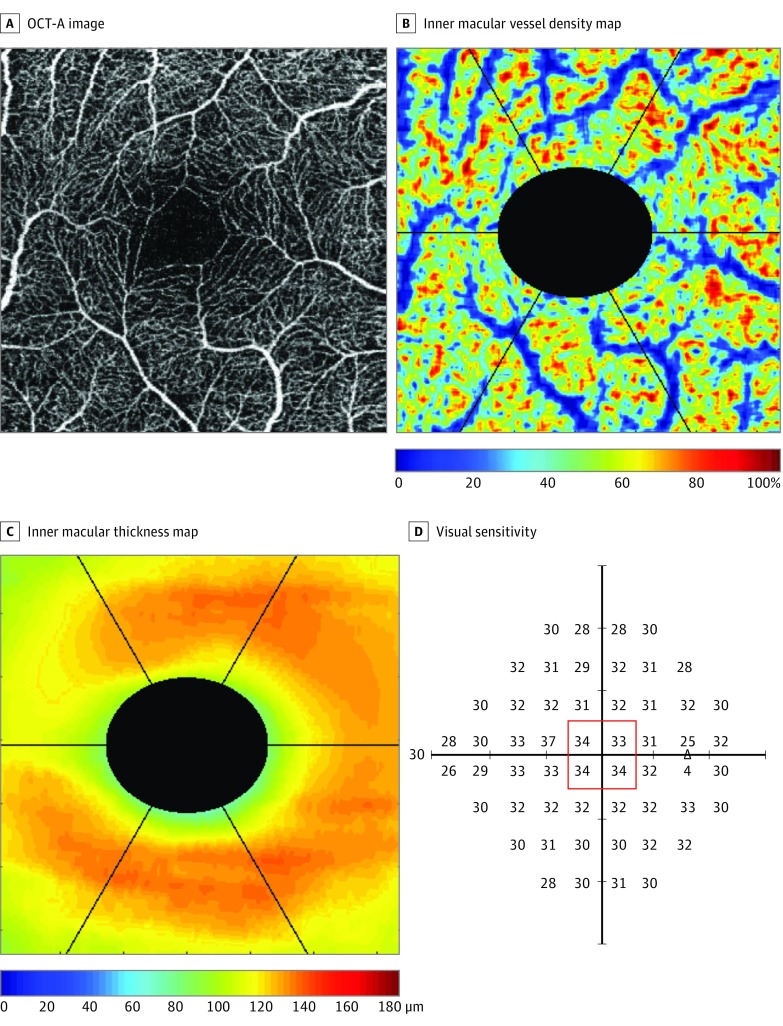
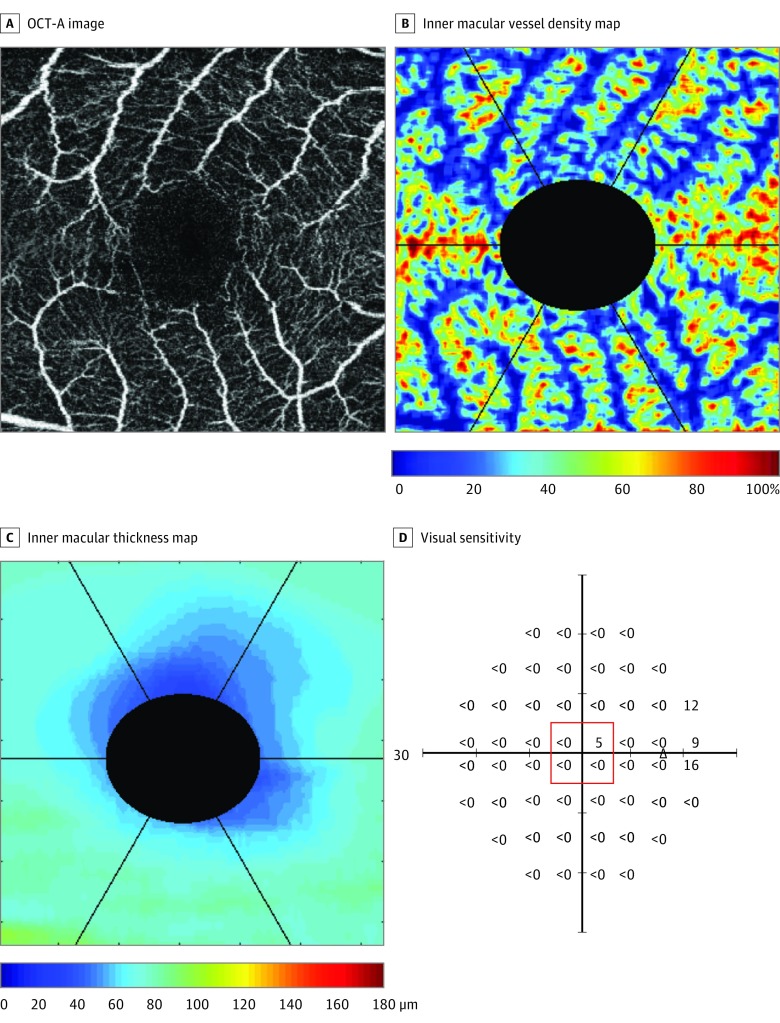
Objective: To compare (1) the diagnostic performance for detection of glaucoma and (2) the structure-function association between inner macular vessel density and inner macular thickness.
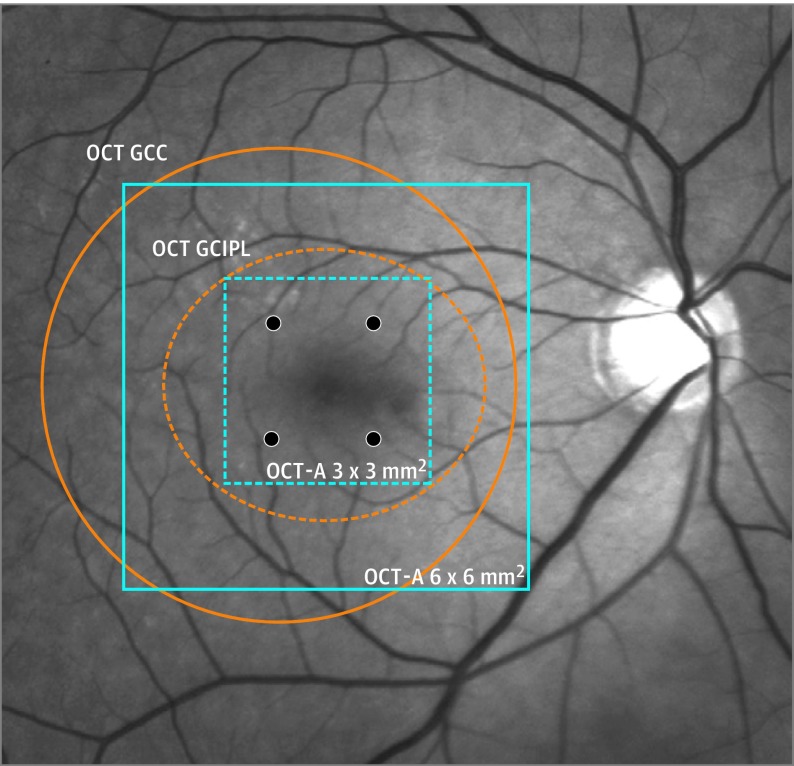
Design, setting, and participants: This cross-sectional study included 115 patients with glaucoma and 35 healthy individuals for measurements of retinal thickness and retinal vessel density, segmented between the anterior boundary of internal limiting membrane and the posterior boundary of the inner plexiform layer, over the 3 × 3-mm2 macula using swept-source OCT. All participants were Chinese. Visual sensitivity corresponding to the 3 × 3-mm2 macular region was expressed in unlogged 1/lambert for investigation of the structure-function associations. Diagnostic performance was evaluated with area under the receiver operating characteristic curves (AUCs). The study was conducted between January 12, 2016, and December 12, 2016.
Main outcomes and measures: Area under the receiver operating characteristic curve and R2 analysis.
Results: Of the 115 patients with glaucoma, 42 (36.5%) were women (mean [SD] age, 53.5 [13.4] years); of the 35 individuals with healthy eyes, 25 (71.4%) were women (age, 60.6 [5.9] years). Inner macular vessel density and thickness were 4.3% (95% CI, 2.4%-6.1%) and 21.1 μm (95% CI, 17.4-24.9 μm) smaller, respectively, in eyes with glaucoma compared with healthy eyes. The AUC of mean inner macular thickness for glaucoma detection was greater than that of mean inner macular vessel density (difference, 0.17; 95% CI, 0.01-0.31; P = .03). At 90% specificity, the sensitivity of mean inner macular thicknesses for detection of glaucoma was greater than that of mean inner macular vessel densities (difference, 29.2%; 95% CI, 11.5%-64.6%; P = .02). The strength of the structure-function association was stronger for mean inner macular thickness than mean inner macular vessel density in the linear (difference in R2 = 0.38; 95% CI, 0.22-0.54; P < .001) and nonlinear (difference in R2 = 0.36; 95% CI, 0.21-0.51; P < .001) regression models.
Conclusions and relevance: In this study, OCT measurement of inner macular thickness shows a higher diagnostic performance to detect glaucoma and a stronger structure-function association than the currently used OCT-A measurement of inner macular vessel density. These findings may suggest that OCT-A of the macula has a limited role in the diagnostic evaluation of glaucoma.
Conflict of interest statement
Figures

References
-
- Curcio CA, Allen KA. Topography of ganglion cells in human retina. J Comp Neurol. 1990;300(1):5-25. - PubMed
-
- Rao HL, Pradhan ZS, Weinreb RN, et al. . Optical coherence tomography angiography vessel density measurements in eyes with primary open-angle glaucoma and disc hemorrhage. J Glaucoma. 2017;26(10):888-895. - PubMed
Publication types
MeSH terms
LinkOut - more resources
Full Text Sources
Other Literature Sources
