. 2018 Nov 15;443(2):103-116.
doi: 10.1016/j.ydbio.2018.05.022. Epub 2018 May 28.

Anti-osteogenic function of a LIM-homeodomain transcription factor LMX1B is essential to early patterning of the calvaria

Affiliations

Anti-osteogenic function of a LIM-homeodomain transcription factor LMX1B is essential to early patterning of the calvaria

Jeffry M Cesario et al. Dev Biol. .

Abstract

The calvaria (upper part of the skull) is made of plates of bone and fibrous joints (sutures and fontanelles), and the proper balance and organization of these components are crucial to normal development of the calvaria. In a mouse embryo, the calvaria develops from a layer of head mesenchyme that surrounds the brain from shortly after mid-gestation. The mesenchyme just above the eye (supra-orbital mesenchyme, SOM) generates ossification centers for the bones, which then grow toward the apex gradually. In contrast, the mesenchyme apical to SOM (early migrating mesenchyme, EMM), including the area at the vertex, does not generate an ossification center. As a result, the dorsal midline of the head is occupied by sutures and fontanelles at birth. To date, the molecular basis for this regional difference in developmental programs is unknown. The current study provides vital insights into the genetic regulation of calvarial patterning. First, we showed that osteogenic signals were active in both EMM and SOM during normal development, which suggested the presence of an anti-osteogenic factor in EMM to counter the effect of these signals. Subsequently, we identified Lmx1b as an anti-osteogenic gene that was expressed in EMM but not in SOM. Furthermore, head mesenchyme-specific deletion of Lmx1b resulted in heterotopic ossification from EMM at the vertex, and craniosynostosis affecting multiple sutures. Conversely, forced expression of Lmx1b in SOM was sufficient to inhibit osteogenic specification. Therefore, we conclude that Lmx1b plays a key role as an anti-osteogenic factor in patterning the head mesenchyme into areas with different osteogenic competence. In turn, this patterning event is crucial to generating the proper organization of the bones and soft tissue joints of the calvaria.


Figures

Figure 1
Figure 1. Overview of the calvarial development in mice
A) A lateral view of a postnatal day 0 (P0) mouse skull, stained with Alizarin red for bone. The bracket indicates the calvaria. B) A schematic for the dorsal view of P0 calvaria. Nose is to the left. Bones and sutures are indicated in red and gray, respectively. af: anterior fontanelle, co: coronal suture, Fr: frontal bone, if: interfrontal suture, IP: interparietal bone, la: lambdoidal suture, Pa: parietal bone, sa: sagittal suture. C) A schematic of an embryonic day (E) 12.5 head showing the position of the section in D. D) A schematic for a coronal section of the head showing the brain (Br, light purple), head mesenchyme (orange), and the surface ectoderm (blue outline). Also indicated are the locations of the early migrating mesenchyme (EMM) and the supra-orbital mesenchyme (SOM), and their contribution to the calvaria according to (Roybal et al., 2010; Yoshida et al., 2008). The dark brown spot represents the bone rudiment appearing in SOM at this stage. E) Developing bone is shown in isolation from coronal sections of the head at various stages, to illustrate the apical growth of the frontal bone and the parietal bone over time, and the subsequent formation of the sutures at the dorsal midline of the head. Apical (Ap) – basal (Ba) axis is indicated. E is modified from (Rice et al., 2000). Bar: 0.5 mm.
Figure 2
Figure 2. Evidence of active osteogenic signaling in EMM and SOM during normal development
A) The head of an E13.5 wild type mouse embryo processed by whole mount RNA in situ hybridization. B,C) Coronal sections of an E13.5 head processed by RNA in situ hybridization. The arrows in A and B point to the strong expression of Bmp4 in the diencephalon roof plate (DR) of the forebrain. The arrow in C points to the expression of Wnt7b in the telencephalon pallium (TP) of the forebrain. D,E) Coronal sections of an E13.5 head processed by immunohistochemistry for phosphorylated (p)-SMAD1/5/9. Pa: parietal bone rudiment in SOM. The arrow in E points to p-SMAD1/5/9 detected in EMM adjacent to DR. The dotted line in E is the boundary between DR and EMM. F) Dissection of EMM and SOM from an E12.5 head. See S1 Fig for details. G) Western blot analysis of EMM and SOM at E12.5 for an active form of intracellular signal transducers. β-actin is shown as a loading control. H) Quantitative comparison of the western blot results from EMM and SOM. The band intensity of each marker was normalized against the β-actin band from the same sample. Data from triplicate samples are shown (diamonds), along with the average (horizontal bar) and the standard deviation (error bars). **: p<0.01. n.s.: not significantly different (p>0.05). Bars in A–C,F: 0.5 mm. Bars in D,E: 0.1 mm.
Figure 3
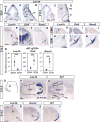
Figure 3. Expression of Lmx1b in the head mesenchyme during normal development
A–M) Coronal sections of the head of wild type embryos processed by RNA in situ hybridization. Apical (Ap) – basal (Ba) axis is indicated in A. B and D are an enlargement of the boxed areas in A and C, respectively. H–M are an enlargement of the boxed areas in E–G. The bracket in D indicates Lmx1b-negative mesenchyme above the eye. The arrowhead in E points to the basal margin of Lmx1b expression in the mesenchyme. The arrow in H points to Lmx1b expression in EMM. The arrows in L and M indicate the frontal bone rudiment. N) EMM and SOM were isolated from E12.5 wild type embryos as in Fig 2F, and analyzed by reverse transcription (RT) followed by quantitative real-time PCR (qPCR) for gene expression. The expression levels were normalized using a house keeping gene, Ppib, as an internal standard. Data from six embryos are shown in each chart (diamonds), along with the average (horizontal bar) and the standard deviation (error bars). ***: p<0.001. O) A schematic of an E13.5 head showing the plane of the sections in P and Q. P,Q) Horizontal sections of the head from an E13.5 wild type embryo processed by RNA in situ hybridization. Anterior (An) – posterior (Po) axis is indicated in P. The brackets indicate SOM. R–T) Coronal sections of the head of an E14.5 wild type embryo processed by RNA in situ hybridization. The arrowhead in R points to the basal margin of Lmx1b expression in the mesenchyme. Br: brain, co: coronal suture, Ec: ectoderm, Ey: eye, Fr: frontal bone, HM: head mesenchyme, OV: optic vesicle, Pa: parietal bone. Bars in A,C: 0.1 mm, bars in E,P,R: 0.5 mm.
Figure 4
Figure 4. Multi-suture craniosynostosis caused by head mesenchyme-specific inactivation of Lmx1b
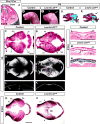
A) A coronal section of the head of an E13.5 Prrx1-Cre;R26R-LacZ/+ embryo processed by β-galactosidase staining (blue) and counter-stained with nuclear fast red. B,C) The head of a control (Lmx1bfl/+) and a Prrx1-Cre;Lmx1bfl/− mutant (= Lmx1b LOFHM) at P0. Abnormal bulges in the mutant are indicated in C. D,E) Lateral views of the skull stained with Alizarin red for bone and Alcian blue for cartilage. The arrow in E points to a hole in the skull created by the protruding brain. F–I) Dorsal views of the calvaria stained with Alizarin red (F,G) or reconstructed from micro-CT scans (H,I). The arrows in G and I point to fused sutures. J,K) Coronal sections of the skull from micro-CT scans at the position of the dotted line in F. L–N) Coronal sections of the head processed by von Kossa staining (L,M) or β-galactosidase staining (N). M and N are adjacent sections from a Prrx1-Cre;Lmx1bfl/−;R26R-LacZ/+ mutant. The arrow in M points to the bone in place of the mid-sutural mesenchyme in the mutant. O,P) Superior views of E16.5 calvariae stained with Alizarin red. The arrow in P points to the heterotopic ossification center at the vertex. The arrowheads in P point to the basal part of the coronal sutures. Br: brain, co: coronal suture, de: dermis, Fr: frontal bone, if: interfrontal suture, IP: interparietal bone, la: lambdoidal suture, Pa: parietal bone, sa: sagittal suture. Bar: 1 mm.
Figure 5
Figure 5. Osteogenic specification of EMM in Lmx1b LOFHM mutants
A–D) Coronal sections of E14.5 heads processed by RNA in situ hybridization. The apical end of the head is shown. The arrows in B and D point to the ectopic expression of Runx2 and Sp7 at the vertex. E–H) Coronal sections of E13.5 heads processed by immunofluorescence for Sp7. E and F are from the boxed areas in G and H, respectively. The arrow in F points to the ectopic Sp7 at the vertex. The arrow in H points to the apparent apical extension of Sp7 from SOM of the mutant. I,J) RT-qPCR comparison of gene expression in EMM of control and Lmx1b LOFHM mutant embryos. The expression level of each gene was normalized to the internal standard Ppib. Results from individual samples (5 to 6 per genotype) are presented as diamonds, along with the average (horizontal bar) and the standard deviation (error bars). *: p<0.05, **: p<0.01, ***: p<0.001, n.s.: not significantly different (p>0.05). K) Western blot from EMM of control and Lmx1b LOFHM mutant embryos. L) Quantitative comparison of the western blot results. 3 lysate samples per genotype were used for the western blot, where each lysate sample was made from EMM of four embryos. M,N) Coronal sections of E13.5 heads processed by immunofluorescence for Ki67 (red). The nuclei were stained with DAPI (blue). O) Ki67+ cells and total cells were counted from EMM demarcated in H and I, and the percentage of Ki67+ cells was calculated. Results from three embryos per genotype are presented along with the average and the standard deviation. Bar: 0.1 mm.
Figure 6
Figure 6. Reduction of calvarial bone from head mesenchyme-specific overexpression of Lmx1b
A–D) Lateral views (A,B) and dorsal views (C,D) of the skull of a control and Prrx1-Cre;R26Lmx1b/+ mutant (= Lmx1b GOFHM) newborns. The skulls were stained with Alizarin red and Alcian blue. E–I) Coronal sections of P0 heads along the dotted line in A. F,G and H,I are pairs of adjacent sections from a Prrx1-Cre;R26Lmx1b/R-LacZ mutant. E, F, and H were stained for bone (brown), and G and I were stained for β-galactosidase activity (blue). In F and G, arrows and arrowheads indicate a layer of loose mesenchyme and cartilage, respectively, in the parietal region of the mutant head. In I, the open arrowhead points to the cells within the mutant calvaria in which Prrx1-Cre was inactive. de: dermis, Fr: frontal bone, IP: interparietal bone, Pa: parietal bone. Bars in A and C: 1 mm, bars in E and H: 0.2 mm.
Figure 7
Figure 7. Loss of osteogenic gene expression in SOM of Lmx1b GOFHM mutants
A–P) Coronal sections of the heads through the parietal bone rudiment (Pa) processed by RNA in situ hybridization. In E and F, arrows and arrowheads indicate down-regulation and up-regulation, respectively, of Msx2 in the Lmx1b GOFHM mutant. Q,R) Coronal sections of the head of Prrx1-Cre;R26R-LacZ/+ (control) and Prrx1-Cre;R26Lmx1b/R-LacZ (Lmx1b GOFHM) embryos processed by β-galactosidase staining (blue). The arrows point to the absence of mesenchyme condensation in the mutant. S,T) Coronal sections of E13.5 heads processed by immunofluorescence for Ki67 (red). The nuclei were stained with DAPI (blue). U) Ki67+ cells and total cells were counted from the parietal bone area demarcated in S and T, and the percentage of Ki67+ cells was calculated. Results from three embryos per genotype are presented as diamonds, along with the average (horizontal bar) and the standard deviation (error bars). n.s.: not significantly different (p>0.05). Bar: 0.2 mm.
Figure 8
Figure 8. The limb skeleton of Lmx1b LOFHM and GOFHM mutants
A–D,G–J) Forelimbs (FL) and hind limbs (HL) stained with Alizarin red and Alcian blue. The arrows point to the morphological abnormalities in the mutant limbs. E,F,K,L) Sections through the humerus (Hum) processed by von Kossa staining. Neither Lmx1b LOFHM nor Lmx1b GOFHM mutants displayed an obvious ossification phenotype in the limbs. All four limbs from each animal were sectioned and examined, and the humerus is shown as a representative result. Bar: 1 mm.
Figure 9
Figure 9. Model for Lmx1b-mediated patterning of the calvarial primordium
Lmx1b is broadly expressed in the head mesenchyme from mid-gestation stages, but its expression begins to be excluded from the mesenchyme above the eye around E10.5. This Lmx1b-negative domain becomes the osteogenic SOM, and gives rise to the frontal bone and the parietal bone from ~E12. The Lmx1b-positive mesenchyme on the apical side becomes non-osteogenic EMM, unable to undergo osteogenic specification despite active osteogenic signaling.

Similar articles

Cited by

References

    1. Bialek P, Kern B, Yang X, Schrock M, Sosic D, Hong N, Wu H, Yu K, Ornitz DM, Olson EN, Justice MJ, Karsenty G. A Twist Code Determines the Onset of Osteoblast Differentiation. Developmental Cell. 2004;6:423–435. - PubMed
    1. Bradford MM. A rapid and sensitive method for the quantitation of microgram quantities of protein utilizing the principle of protein-dye binding. Anal Biochem. 1976;72:248–254. - PubMed
    1. Chen H, Ovchinnikov D, Pressman CL, Aulehla A, Lun Y, Johnson RL. Multiple calvarial defects inlmx1b mutant mice. Developmental Genetics. 1998a;22:314–320. - PubMed
    1. Chen H, Lun Y, Ovchinnikov D, Kokubo H, Oberg KC, Pepicelli CV, Gan L, Lee B, Johnson RL. Limb and kidney defects in Lmx1b mutant mice suggest an involvement of LMX1B in human nail patella syndrome. Nat Genet. 1998b;19:51–55. - PubMed
    1. Chen L, Li D, Li C, Engel A, Deng C-X. A Ser250Trp substitution in mouse fibroblast growth factor receptor 2 (Fgfr2) results in craniosynostosis. Bone. 2003;33:169–178. - PubMed

Publication types

Substances

LinkOut - more resources