. 2018 Aug:101:74-79.
doi: 10.1016/j.biocel.2018.05.014. Epub 2018 May 28.

SRRF: Universal live-cell super-resolution microscopy

Affiliations

SRRF: Universal live-cell super-resolution microscopy

Siân Culley et al. Int J Biochem Cell Biol. 2018 Aug.

Abstract

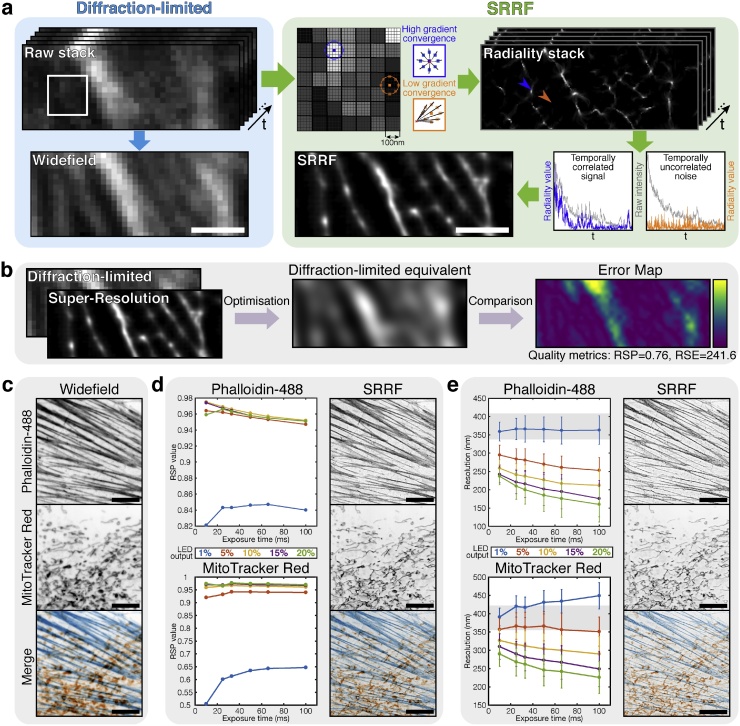
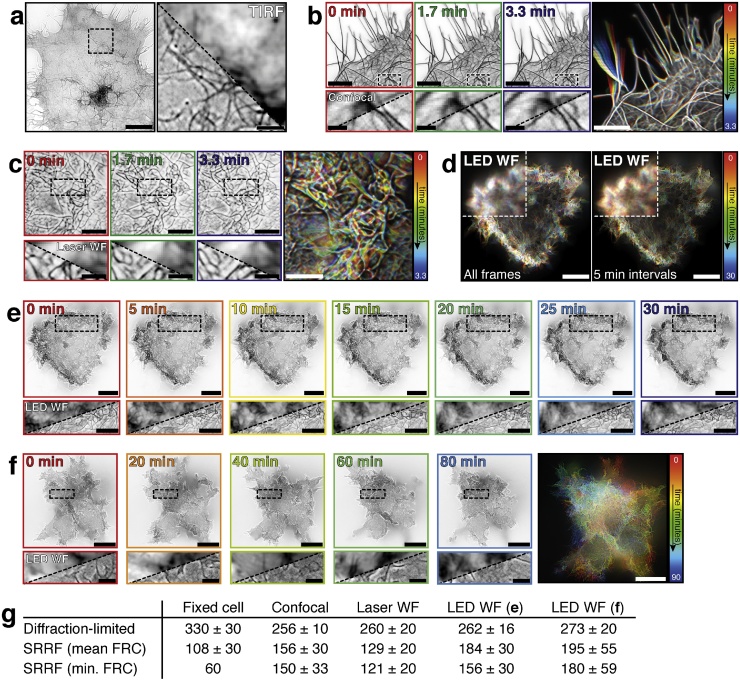
Super-resolution microscopy techniques break the diffraction limit of conventional optical microscopy to achieve resolutions approaching tens of nanometres. The major advantage of such techniques is that they provide resolutions close to those obtainable with electron microscopy while maintaining the benefits of light microscopy such as a wide palette of high specificity molecular labels, straightforward sample preparation and live-cell compatibility. Despite this, the application of super-resolution microscopy to dynamic, living samples has thus far been limited and often requires specialised, complex hardware. Here we demonstrate how a novel analytical approach, Super-Resolution Radial Fluctuations (SRRF), is able to make live-cell super-resolution microscopy accessible to a wider range of researchers. We show its applicability to live samples expressing GFP using commercial confocal as well as laser- and LED-based widefield microscopes, with the latter achieving long-term timelapse imaging with minimal photobleaching.

Keywords: Fluorescence; Image processing; Live-cell imaging; Super-resolution microscopy.


Figures

Fig. 1
Fig. 1
OVERVIEW OF THE SRRF ALGORITHM AND OPTIMISING SRRF IMAGING. a) Raw data and processing steps in SRRF. The pale cyan box contains the raw, diffraction-limited data series that can be summed to create a single diffraction-limited image. The pale green box contains the SRRF image processing steps. The raw data is split into subpixels (here each pixel from the raw data is split into a 5 × 5 array of subpixels). Examples of the intensity gradients used for the radiality transform are shown for the two highlighted blue and orange subpixels. The blue and orange arrowheads in the radiality stack indicate the location of these subpixels, with their temporal correlations plotted below; coloured plots indicate the radiality variation over time and grey plots indicate the fluorescence intensity variation over time at these locations in the raw data. Scale bar = 1 μm. b) Overview of the SQUIRREL algorithm used for optimising SRRF acquisitions. c) Widefield LED images of Alexa Fluor 488-phalloidin and MitoTracker Red CMXRos (FluoCells Prepared Slide #1, Invitrogen). d) SQUIRREL-calculated RSP (resolution-scaled Pearson’s correlation) values plotted for actin and mitochondria images for different combinations of frame number and exposure time at 5 different LED intensities (indicated as % of maximum output). The highest-quality images (actin: 100 x 10 ms frames at 10% 490 nm LED; mitochondria: 30 x 33 ms frames at 20% 550 nm LED) are displayed alongside. e) SQUIRREL-calculated FRC (Fourier Ring Correlation) mean resolution values (error bars = standard deviation of resolution across the entire image) for the same imaging conditions as in d. Grey shaded regions indicate the mean ± std. resolutions in the widefield images in c. The highest-resolution images (actin: 10 x 100 ms frames at 20% 490 nm LED; mitochondria: 10 x 100 ms at 20% 550 nm LED) are displayed alongside. Scale bars in c-e = 10 μm.
Fig. 2
Fig. 2
SRRF IMAGING USING DIFFERENT MICROSCOPES. a) Left: SRRF image of Alexa Fluor-647-labelled phalloidin in fixed Cos7 cells imaged using TIRF with intense laser illumination. Scale bar = 10 μm. Right: enlarged view of the boxed region with the non-super-resolved TIRF image shown. Scale bar = 2 μm. b) Greyscale images: individual SRRF time-points (each frame represents 1 s of imaging) of Cos7 cells expressing Utrophin-GFP imaged using confocal microscopy (scale bars = 5 μm). Enlarged views of the boxed region are displayed below as a split between the diffraction-limited confocal image and the SRRF image (scale bars = 1 μm). Coloured image: temporally colour-coded projection of 200 SRRF reconstructions at 1 Hz from 200 s of continuous imaging (scale bar = 5 μm). c) Greyscale images: individual SRRF time-points (1 s imaging per reconstructed SRRF frame) of Utrophin-GFP images using widefield laser-based microscopy (scale bars = 5 μm) and enlarged insets showing split between corresponding diffraction-limited images below (scale bars = 2 μm). Coloured image: temporally colour-coded projection on 200 SRRF reconstructions at 1 Hz from 200 s of continuous imaging (scale bar = 5 μm). d) Temporally colour-coded projections of SRRF reconstructions of 30 min. of continuous LED-illuminated widefield Utrophin-GFP imaging. Left: projection of all 590 SRRF reconstructions at 0.33 Hz. Right: same dataset, selected SRRF frames at 5 min intervals. Scale bars = 10 μm. e) Individual SRRF frames (3 s imaging per time-point) from the projected dataset in the right-hand panel of d) (scale bars = 10 μm), with insets below showing enlarged boxed region split with diffraction-limited LED widefield (scale bars = 5 μm). f) Long-term widefield LED timelapse imaging of Utrophin-GFP with SRRF images acquired every 10 min. Greyscale images: individual SRRF frames (3 s imaging per time-point, scale bars = 10 μm) with enlarged insets below showing the diffraction-limited equivalent (scale bars = 2 μm). Coloured image: temporally colour-coded projection of 10 SRRF reconstructions from imaging once every 10 min (scale bar = 10 μm). g) Resolutions as measured using the ‘FRC Map’ tool in NanoJ-SQUIRREL. For the fixed cell data, SRRF (mean FRC) is the average resolution across the whole image, with SRRF (min. FRC) representing the best local resolution in the image. For the live cell data, mean FRC is the resolution averaged across all images in a time series, and min. FRC is the average value for the best individual frame within the series. All values are in nm, errors ± SD.

References

    1. Almada P., Culley S., Henriques R. PALM and STORM: into large fields and high-throughput microscopy with sCMOS detectors. Methods (San Diego, Calif.) 2015;88:109–121. http://www.ncbi.nlm.nih.gov/pubmed/26079924 Available at: - PubMed
    1. Betzig E. Imaging intracellular fluorescent proteins at nanometer resolution. Science (New York, N.Y.) 2006;313(5793):1642–1645. http://www.sciencemag.org/content/313/5793/1642.abstract Available at: (Accessed May 23 2014) - PubMed
    1. Burkel B.M., von Dassow G., Bement W.M. Versatile fluorescent probes for actin filaments based on the actin-binding domain of utrophin. Cell Motil. Cytoskeleton. 2007;64(11):822–832. http://www.ncbi.nlm.nih.gov/pubmed/17685442 Available at: . (Accessed March 9, 2018) - PMC - PubMed
    1. Cho S. Simple super-resolution live-cell imaging based on diffusion-assisted Förster resonance energy transfer. Sci. Rep. 2013;3(1):1208. http://www.nature.com/articles/srep01208 Available at: (Accessed February 25, 2018) - PMC - PubMed
    1. Culley S. Quantitative mapping and minimization of super-resolution optical imaging artifacts. Nat. Methods. 2018 http://www.nature.com/doifinder/10.1038/nmeth.4605 Available at: (Accessed March 8 2018) - DOI - PMC - PubMed

Publication types

MeSH terms