

Smokeless tobacco impacts oral microbiota in a Syrian Golden hamster cheek pouch carcinogenesis model
- PMID: 29852249
- PMCID: PMC6109425
- DOI: 10.1016/j.anaerobe.2018.05.010
Smokeless tobacco impacts oral microbiota in a Syrian Golden hamster cheek pouch carcinogenesis model
Abstract
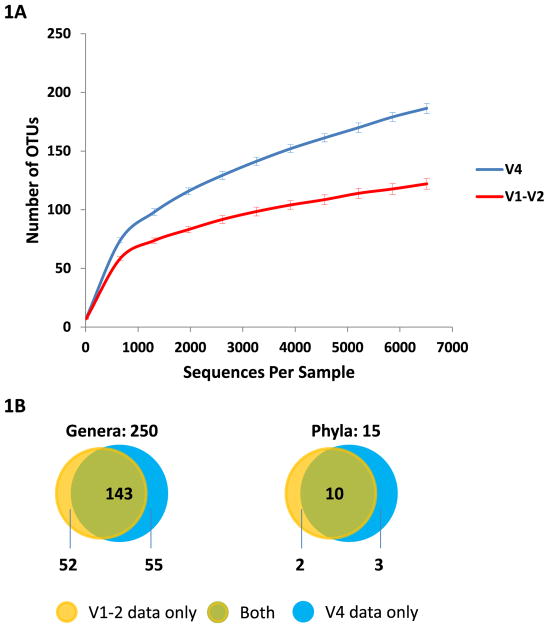
The use of smokeless tobacco products (STPs) can cause many serious health problems. The oral microbiota plays important roles in oral and systemic health, and the disruption in the oral microbial population is linked to periodontal disease and other health problems. To assess the impact of smokeless tobacco on oral microbiota in vivo, high-throughput sequencing was used to examine the oral microbiota present in Syrian Golden hamster cheek pouches. Sixteen hamsters were divided into four groups and treated with the STP Grizzly snuff (0, 2.5, 25, or 250 mg) twice daily for 4 weeks. After 0, 1, 2, 3, and 4 weeks of treatment, bacterial genomic DNA was extracted from oral swabs sampled from the cheek pouches of the hamsters. The oral bacterial communities present in different hamster groups were characterized by sequencing the hypervariable regions V1-V2 and V4 of 16S rRNA using the Illumina MiSeq platform. Fifteen phyla, 27 classes, 59 orders, 123 families, and 250 genera were identified from 4,962,673 sequence reads from the cheek pouch samples. The bacterial diversity and taxonomic abundances for the different treatment groups were compared to the non-treated hamsters. Bacterial diversity was significantly decreased after 4 weeks of exposure to 2.5 mg, and significantly increased by exposure to 250 mg STP. Treatment with 250 mg STP significantly increased Firmicutes, transiently increased Cyanobacteria and TM7, and decreased Bacteroidetes and Fusobacteria compared to the control group. At the genus level, 4 weeks of administration of 250 mg STP significantly increased Granulicatella, Streptococcus, Oribacterium, Anaerococcus, Acidaminococcus, Actinomyces, Eubacterium, Negativicoccus, and Staphylococcus, and decreased Bacteroides, Buleidia, Dialister, and Leptotrichia, and transiently decreased Arcanobacterium compared to the control group. For the first time, an animal model was used for evaluating the effects of STP on oral microbiota by metagenomic sequencing. Our results provide a view of the shift of the oral microbiota in response to STP exposure in Syrian Golden hamster. Our findings indicate that the use of smokeless tobacco significantly disrupts the oral microbiota.
Keywords: Bacterial diversity; Oral microbiota; Smokeless tobacco; Toxicity.
Published by Elsevier Ltd.
Figures


Similar articles
-
Impact of smokeless tobacco-associated bacteriome in oral carcinogenesis.Anaerobe. 2021 Aug;70:102400. doi: 10.1016/j.anaerobe.2021.102400. Epub 2021 Jun 6. Anaerobe. 2021. PMID: 34090995 Review.
-
Tongue microbiome of smokeless tobacco users.BMC Microbiol. 2020 Jul 8;20(1):201. doi: 10.1186/s12866-020-01883-8. BMC Microbiol. 2020. PMID: 32640977 Free PMC article.
-
Smokeless Tobacco Products (STPs) Harbour Bacterial Populations with Potential for Oral Carcinogenicity.Asian Pac J Cancer Prev. 2020 Mar 1;21(3):815-824. doi: 10.31557/APJCP.2020.21.3.815. Asian Pac J Cancer Prev. 2020. PMID: 32212812 Free PMC article.
-
Oral microbiome dysbiosis among cigarette smokers and smokeless tobacco users compared to non-users.Sci Rep. 2024 May 6;14(1):10394. doi: 10.1038/s41598-024-60730-2. Sci Rep. 2024. PMID: 38710815 Free PMC article.
-
Comparative analysis of bacterial abundance and diversity in tumour tissue of oral squamous cell carcinoma and non-tumour tissue: insights from a systematic review of 16S ribosomal RNA sequencing.BMC Oral Health. 2025 Apr 16;25(1):577. doi: 10.1186/s12903-025-05941-3. BMC Oral Health. 2025. PMID: 40241078 Free PMC article.
Cited by
-
Alteration of oral bacteriome of smokeless tobacco users and their association with oral cancer.Appl Microbiol Biotechnol. 2023 Jun;107(12):4009-4024. doi: 10.1007/s00253-023-12534-z. Epub 2023 May 8. Appl Microbiol Biotechnol. 2023. PMID: 37154908
-
Smokeless tobacco consumption induces dysbiosis of oral mycobiome: a pilot study.Appl Microbiol Biotechnol. 2022 Sep;106(17):5643-5657. doi: 10.1007/s00253-022-12096-6. Epub 2022 Aug 1. Appl Microbiol Biotechnol. 2022. PMID: 35913514
-
Urine metabolomics and microbiome analyses reveal the mechanism of anti-tuberculosis drug-induced liver injury, as assessed for causality using the updated RUCAM: A prospective study.Front Immunol. 2022 Nov 22;13:1002126. doi: 10.3389/fimmu.2022.1002126. eCollection 2022. Front Immunol. 2022. PMID: 36483548 Free PMC article.
-
Effect of different forms of tobacco on the oral microbiome in healthy adults: a systematic review.Front Oral Health. 2024 Feb 20;5:1310334. doi: 10.3389/froh.2024.1310334. eCollection 2024. Front Oral Health. 2024. PMID: 38445094 Free PMC article. Review.
-
Emerging Oral Nicotine Products and Periodontal Diseases.Int J Dent. 2023 Feb 10;2023:9437475. doi: 10.1155/2023/9437475. eCollection 2023. Int J Dent. 2023. PMID: 36819641 Free PMC article. Review.
References
-
- Center for behavioral health statistics and quality. 2014 National Survey on drug use and health: detailed tables. Substance Abuse and Mental Health Services Administration; Rockville, MD: 2015.
-
- Centers for disease control and prevention. tobacco use among middle and high school Students-United States, 2011–2015. Morbidity and Mortality Weekly Report. 2016;65(14):361–367. - PubMed
MeSH terms
Substances
Grants and funding
LinkOut - more resources
Full Text Sources
Other Literature Sources
Medical
