

The Impact of Visualization Dashboards on Quality of Care and Clinician Satisfaction: Integrative Literature Review
- PMID: 29853440
- PMCID: PMC6002673
- DOI: 10.2196/humanfactors.9328
The Impact of Visualization Dashboards on Quality of Care and Clinician Satisfaction: Integrative Literature Review
Abstract
Background: Intensive Care Units (ICUs) in the United States admit more than 5.7 million people each year. The ICU level of care helps people with life-threatening illness or injuries and involves close, constant attention by a team of specially-trained health care providers. Delay between condition onset and implementation of necessary interventions can dramatically impact the prognosis of patients with life-threatening diagnoses. Evidence supports a connection between information overload and medical errors. A tool that improves display and retrieval of key clinical information has great potential to benefit patient outcomes. The purpose of this review is to synthesize research on the use of visualization dashboards in health care.
Objective: The purpose of conducting this literature review is to synthesize previous research on the use of dashboards visualizing electronic health record information for health care providers. A review of the existing literature on this subject can be used to identify gaps in prior research and to inform further research efforts on this topic. Ultimately, this evidence can be used to guide the development, testing, and implementation of a new solution to optimize the visualization of clinical information, reduce clinician cognitive overload, and improve patient outcomes.
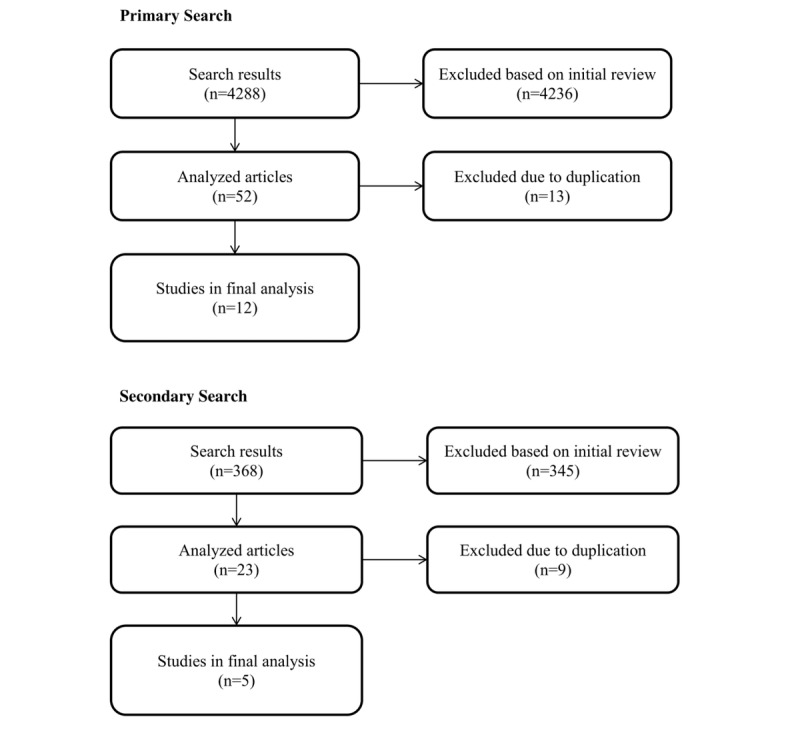
Methods: Articles were included if they addressed the development, testing, implementation, or use of a visualization dashboard solution in a health care setting. An initial search was conducted of literature on dashboards only in the intensive care unit setting, but there were not many articles found that met the inclusion criteria. A secondary follow-up search was conducted to broaden the results to any health care setting. The initial and follow-up searches returned a total of 17 articles that were analyzed for this literature review.
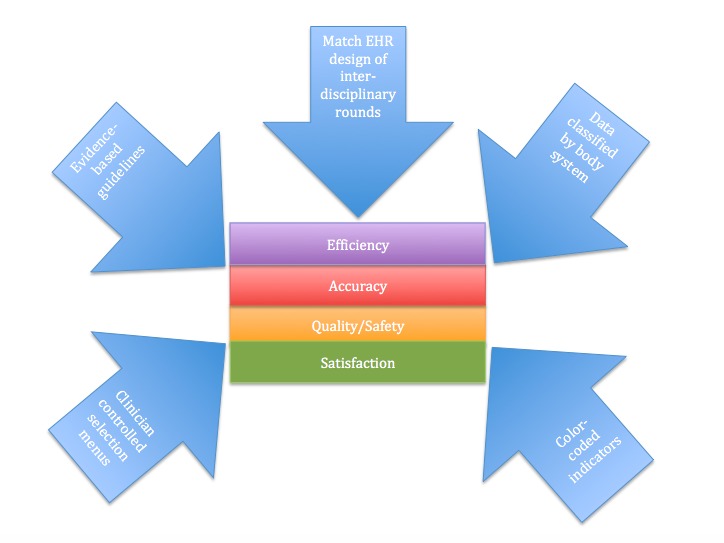
Results: Visualization dashboard solutions decrease time spent on data gathering, difficulty of data gathering process, cognitive load, time to task completion, errors, and improve situation awareness, compliance with evidence-based safety guidelines, usability, and navigation.
Conclusions: Researchers can build on the findings, strengths, and limitations of the work identified in this literature review to bolster development, testing, and implementation of novel visualization dashboard solutions. Due to the relatively few studies conducted in this area, there is plenty of room for researchers to test their solutions and add significantly to the field of knowledge on this subject.
Keywords: cognitive load; electronic health record; health information technology; information overload; intensive care unit; usability; user interface design; visualization, Dashboard.
©Saif Sherif Khairat, Aniesha Dukkipati, Heather Alico Lauria, Thomas Bice, Debbie Travers, Shannon S Carson. Originally published in JMIR Human Factors (http://humanfactors.jmir.org), 31.05.2018.
Conflict of interest statement
Conflicts of Interest: None declared.
Figures
References
-
- Society of Critical Care Medicine. Critical Care. 2017. [2018-05-09]. Critical care statistics http://www.sccm.org/Communications/Pages/CriticalCareStats.aspx .
-
- U.S. National Library of Medicine. 2016. Critical care https://medlineplus.gov/criticalcare.html . - PubMed
-
- Charles D, Gabriel M. Adoption of electronic health record systems among U.S. non-federal acute care hospitals. ONC Data Brief. Washington DC: Office of the National Coordinator for Health Information Technology; 2015. Searcy; pp. 2008–2014.
-
- Singh H, Spitzmueller C, Petersen NJ, Sawhney MK, Sittig DF. Information overload and missed test results in electronic health record-based settings. JAMA Intern Med. 2013 Apr 22;173(8):702–4. doi: 10.1001/2013.jamainternmed.61. http://europepmc.org/abstract/MED/23460235 1657753 - DOI - PMC - PubMed
Publication types
LinkOut - more resources
Full Text Sources
Other Literature Sources
Medical
Miscellaneous
