. 2018 Jun 15;360(6394):1222-1227.
doi: 10.1126/science.aar2578. Epub 2018 May 31.

Normative brain size variation and brain shape diversity in humans

Affiliations

Normative brain size variation and brain shape diversity in humans

P K Reardon et al. Science. .

Abstract

Brain size variation over primate evolution and human development is associated with shifts in the proportions of different brain regions. Individual brain size can vary almost twofold among typically developing humans, but the consequences of this for brain organization remain poorly understood. Using in vivo neuroimaging data from more than 3000 individuals, we find that larger human brains show greater areal expansion in distributed frontoparietal cortical networks and related subcortical regions than in limbic, sensory, and motor systems. This areal redistribution recapitulates cortical remodeling across evolution, manifests by early childhood in humans, and is linked to multiple markers of heightened metabolic cost and neuronal connectivity. Thus, human brain shape is systematically coupled to naturally occurring variations in brain size through a scaling map that integrates spatiotemporally diverse aspects of neurobiology.


Figures

Fig. 1.
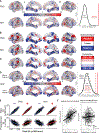
Fig. 1.. Nonlinear areal scaling of the cortex with normative brain size variation in PNC, NIH, and HCP cohorts.
(A) Unthresholded vertex maps showing local surface area scaling with naturally occurring variations in total cortical area. Red, relative expansion in larger cortices (“positive scaling”); blue, relative contraction (“negative scaling”). The observed cross-vertex correlation in scaling between PNC/NIH cohorts is greater than that in 1000 surface-based rotations of the NIH scaling map (i.e., pSPIN < 0.001, density plot). (B) Categorical scaling maps showing regions of statistically significant positive and negative areal scaling (i.e., Ho: scaling coefficient = 1 rejected) after correction for multiple comparisons across vertices. (C) Conjunction of PNC and NIH maps from Fig. 1B. (D) Regional scaling in a third independent dataset (Human Connectome Project, n = 1113), across two different FWHM (full width at half maximum) smoothing kernels (for maps for all five kernels, see fig. S4). Density plot shows that observed alignment of HCP scaling with PNC (solid)/NIH (dashed) (r > 0.3) exceeds chance (pSPIN < 0.002). (E) Scatter plots of raw (top row) and proportional (bottom row) surface area in regions of nonlinear scaling from Fig. 1B versus total cortical area (SA). (F) Inter-relationships between age and sex residualized scaling index (SI, with and without residualization for SA), SA, and IQ in the NIH cohort.
Fig. 2.
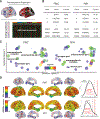
Fig. 2.. Areal scaling aligns with patterns of cortical evolution, development, functional network topography, and cytoarchitecture.
(A) Area expansion map in humans relative to macaques (2), with PNC/NIH scaling maps for comparison. Density plot shows that observed spatial correlation of scaling maps and evolutionary expansion is greater than chance for PNC (solid) and NIH (dashed) cohorts. (B) Conjunction between regions of positive areal scaling in PNC/NIH cohorts (Fig. 1B) and vertices with evolutionary expansion values above the 50th centile. (C and D) Identical analyses as Fig. 2, A and B, except for areal expansion map in human adults relative to human infants (2). (E) Parcellation of cortex into seven canonical resting state functional connectivity networks (8), with bar plots and conjunction maps showing differential representation of positive versus negative scaling in each network (**pSPIN < 0.001, *pSPIN < 0.05). Regions of positive scaling localize to the default mode network (DMN) and regions of negative scaling to the limbic network (Lim). (F) Cortical parcellation into seven different laminar types according to a classical cytoarchitectonic atlas (12), with bar plots and conjunction maps showing that regions of positive scaling localize to von Economo Type 3 cortex, and negative to Type 6 (**pSPIN < 0.001, *pSPIN < 0.05).
Fig. 3.
Fig. 3.. Areal scaling aligns with cortical gene expression and metabolism.
(A) Vertex scaling coefficients from PNC and NIH maps (Fig. 1A) were uniquely assigned to each of ~2k cortical samples from the Allen Institute for Brain Sciences (AIBS) (13) by spatial proximity, allowing ranking of the ~16,000 genes measured across all AIBS samples by their spatial correlation with areal scaling. (B) Extreme-ranking genes for the PNC and NIH scaling maps. (C) Visualization of GO cellular component terms in semantic space showing statistically significant enrichment of mitochondria- and synapse-related terms among top-ranking genes. (D) Areal scaling is positively correlated with two neuroimaging-based proxies for cortical energy consumption at rest: arterial spin labeling (ASL) measures of arterial blood flow (15) and positron emission tomography measures of glucose uptake (CMRGlu) (16) (density plots, PNC solid, NIH dashed, black null, red observed, mean pSPIN < 0.03).

Comment in

  • Scaling of human brain size.
    Van Essen DC. Van Essen DC. Science. 2018 Jun 15;360(6394):1184-1185. doi: 10.1126/science.aat8948. Science. 2018. PMID: 29903961 No abstract available.

References

    1. Giedd JN et al., Neuropsychopharmacology 40, 43–49 (2015). - PMC - PubMed
    1. Hill J. et al., Proc. Natl. Acad. Sci. U.S.A. 107,13135–13140 (2010). - PMC - PubMed
    1. Mankiw C. et al., J. Neurosci. 37, 5221–5231 (2017). - PMC - PubMed
    1. Satterthwaite TD et al., Neuroimage 86, 544–553 (2014). - PMC - PubMed
    1. Ad-Dab’bagh Y. et al., The CIVET image-processing environment: A fully automated comprehensive pipeline for anatomical neuroimaging research. Proceedings of the 12th Annual Meeting of the Organization for Human Brain Mapping (2006).

Publication types