. 2018 Jun 29;360(6396):eaat4422.
doi: 10.1126/science.aat4422. Epub 2018 May 31.

Ultrafast neuronal imaging of dopamine dynamics with designed genetically encoded sensors

Affiliations

Ultrafast neuronal imaging of dopamine dynamics with designed genetically encoded sensors

Tommaso Patriarchi et al. Science. .

Abstract

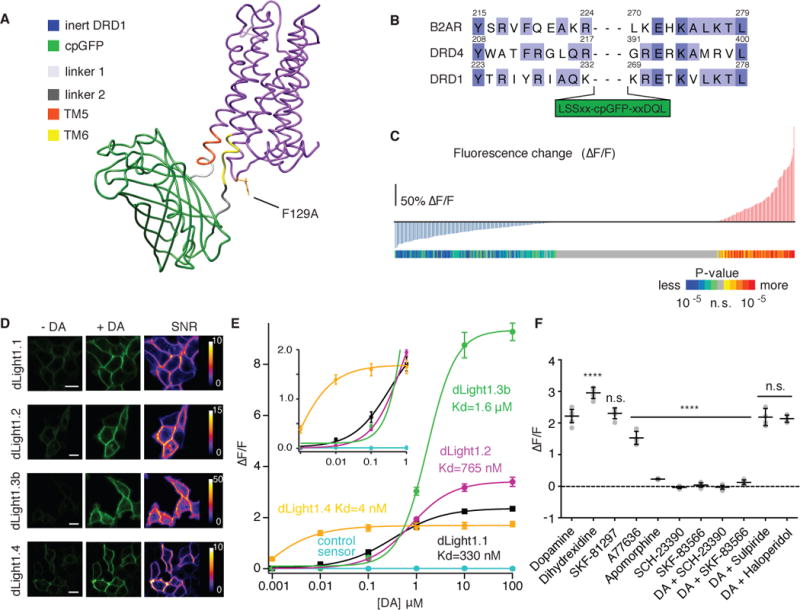
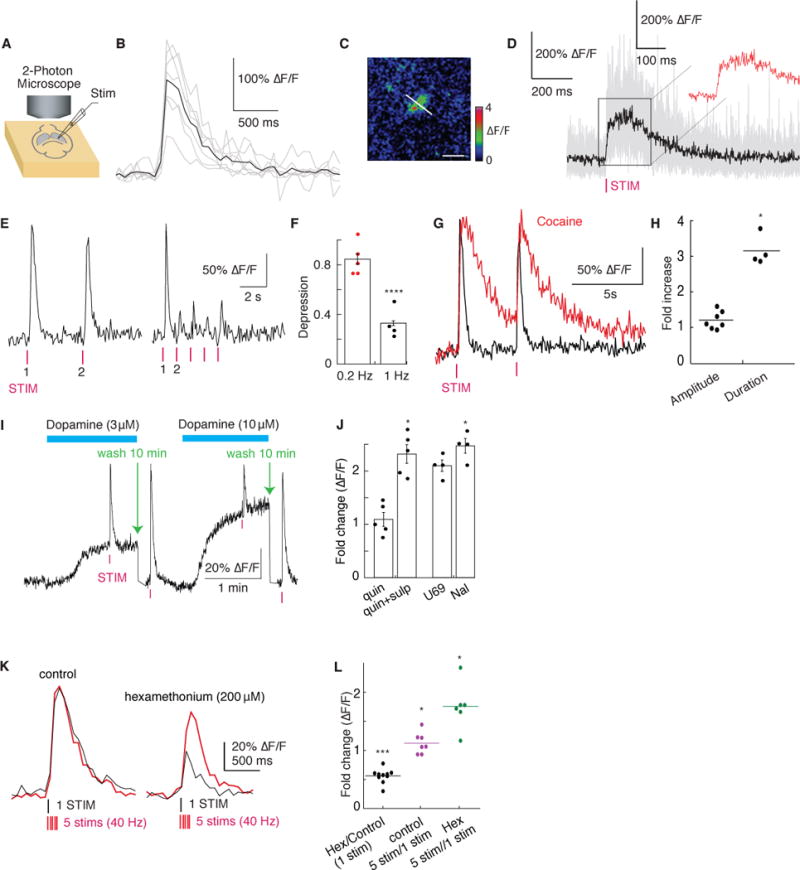
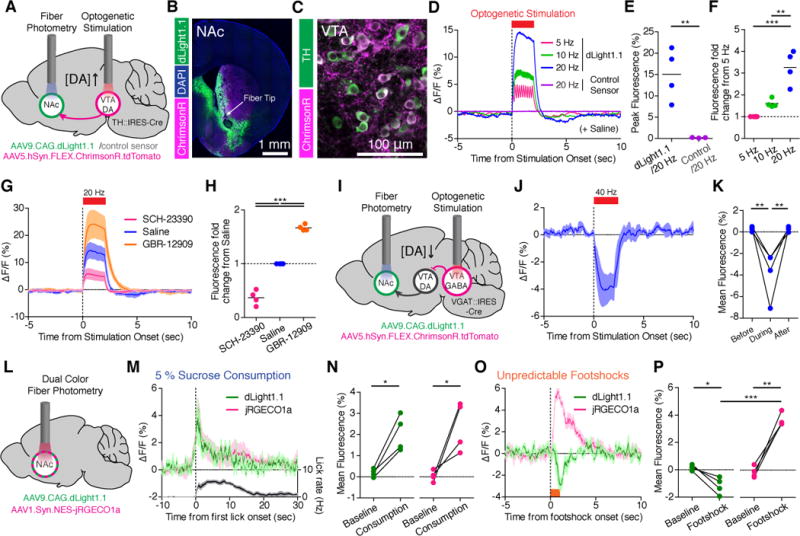
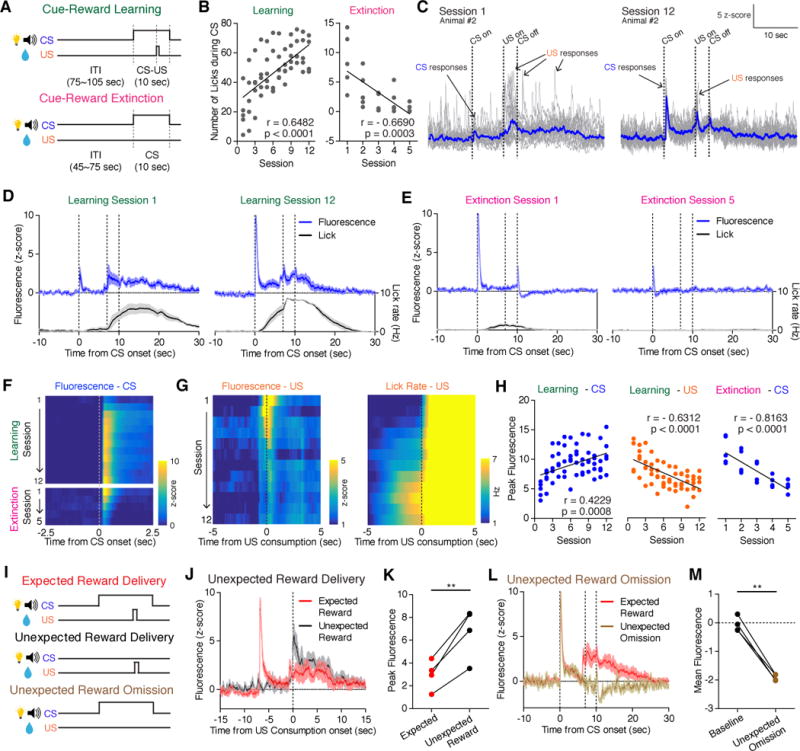
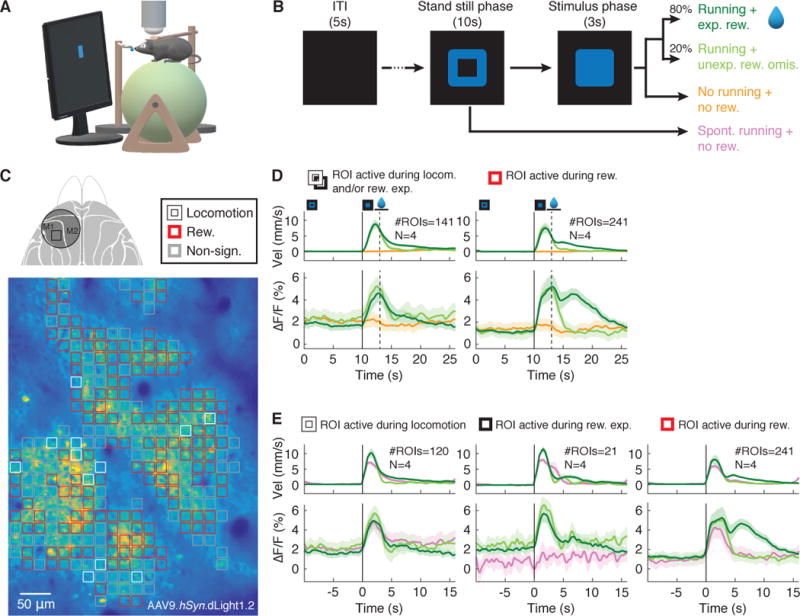
Neuromodulatory systems exert profound influences on brain function. Understanding how these systems modify the operating mode of target circuits requires spatiotemporally precise measurement of neuromodulator release. We developed dLight1, an intensity-based genetically encoded dopamine indicator, to enable optical recording of dopamine dynamics with high spatiotemporal resolution in behaving mice. We demonstrated the utility of dLight1 by imaging dopamine dynamics simultaneously with pharmacological manipulation, electrophysiological or optogenetic stimulation, and calcium imaging of local neuronal activity. dLight1 enabled chronic tracking of learning-induced changes in millisecond dopamine transients in mouse striatum. Further, we used dLight1 to image spatially distinct, functionally heterogeneous dopamine transients relevant to learning and motor control in mouse cortex. We also validated our sensor design platform for developing norepinephrine, serotonin, melatonin, and opioid neuropeptide indicators.


Conflict of interest statement

Competing interests: L.T., R.L. and T.P. submitted a provisional patent application on sensor engineering.

Figures

Fig. 1
Fig. 1. Development of dLight1 and versatile applications to other neuromodulators
(A) Simulated structure of dLight1 consisting DRD1 and cpGFP module. (B) Sequence alignment of transmembrane (TM) domain 5 and 6 in β2AR, DRD1 and DRD4. Library design is shown. (C) Screening result of 585 linker variants. Fluorescence changes (ΔF/F) to 10 μM DA in vertical bar and significance values of ΔF/F in colored bar (n=3 trials, two-tailed t test). (D) Expression of dLight variants in HEK cells. Fluorescence intensity and signal-to-noise ratio of apo and sat state were shown. Scale bars: 10 μm. (E) In situ titration of DA on HEK cells. Data were fitted with the Hill Equation (n=5). (F) Pharmacological specificity of dLight1.1. DRD1 full agonist (Dihydrexidine, 295 ± 8% ΔF/F, n=5); DRD1 partial agonists (SKF81297, 230 ± 7.7%, n=5; A77636, 153 % 7.8%, n=7; Apomorphine, 22 ± 0.8%, n=6); DRD1 antagonists (SCH-23390 - 0.04 ± 0.01%; SKF-83566, 0.04 ± 0.03%); DRD2 antagonists (Sulpiride, 213 ± 5.1%, n=5; Haloperidol, 219 ± 11%, n=6). All data shown as mean ± SEM. ****p<0.0001, One-way ANOVA, Dunnett’s post-test.
Fig. 2
Fig. 2. Imaging electrically evoked and pharmacologically modulated dopamine release in acute dorsal striatum slices
(A) Schematics of experimental setup. (B) Single-trial fluorescence response (average in black) in response to a single stimulus (0.5 ms). Images acquired at 15Hz using 2-photon light at 920nm. Averaged ΔF/F= 182 ± 21% across 7 trials, mean ± SEM. Scale bar: 20 μm. (C) Representative hotspot (ΔF/F) for line-scan. Scale bar: 20 μm. (D) Individual fluorescence traces during line-scan (500Hz) in response to a single stimulus (average in black across 13 trials). Inset shows zoomed-in view of the fluorescence plateau. (E) Fluorescence responses to low and high frequency stimuli (left 0.2Hz, right 1Hz) quantified in (F) (Fold change in ΔF/F = 0.506 ± 0.061 at 1Hz across 5 trials,). (G) Single trial fluorescence response in the presence of cocaine (10 μM) triggered by a single stimulus overlayed with trace without cocaine. (H) Quantification of fold change in peak fluorescence amplitude (1.056±0.095, n=7, P=0.056) and duration (3.15±0.213, n=4,). (I) Estimation of released DA concentration (single trial trace shown). (J) Quantification of fold change in peak fluorescence in the presence of bath applied sulpiride (400nM) (0.437 ± 0.052, n=5), quinpirole (1 μM) (0.926 ± 0.070, P<0.01, n=5), U69,593 (1 μM) (0.838 ± 0.042, n=4,) and Naloxone (1 μM) (1.022 ± 0.053, n=4). (K) Single-trial fluorescence response to either a single pulse (black) or a train of 5 pulses at 40Hz (red) in the absence (left) and presence (right) of the nicotinic acetylcholine receptor blocker hexamethonium (200 μM). (L) Quantification of fold change in peak fluorescence response in K (Hex/Control: 0.561 ± 0.038, n=10,; control 5stim/1stim: 1.13 ± 0.069, n=7; Hex 5stim/1stim: 1.76±0.16, n=6). *p<0.05, **p<0.01, ***p<0.001, ****p<0.0001, paired t test.
Fig. 3
Fig. 3. Deep brain imaging of DA release triggered by optogenetic stimulation and combined with calcium imaging in freely behaving mice
(A) Schematics showing fiber photometry recording of dLight1.1 or control sensor in the NAc while stimulating VTA DA neurons by optogenetics. (B) Expression of dLight1.1 in the NAc around fiber tip location and ChrimsonR expressing axons from midbrain. (C) ChrimsonR-expressing TH+DA neurons in the VTA. (D) Averaged fluorescence increase in response to optogenetic stimuli (n = 5 mice) (E) Quantification of peak fluorescence at 20Hz. (F) Fluorescence fold changes relative to 5Hz. (G–H) Optogenetically induced fluorescence increase of dLight1.1 after systemic administration of saline, D1 antagonist (SCH-23390, 0.25 mg/kg) and DA reuptake inhibitor (GBR-12909, 10 mg/kg) (n = 5 mice). (I) Schematics showing fiber photometry recording of dLight1.1 in the NAc and optogenetic stimulation of VTA GABA neurons that inhibits VTA DA neurons. (J–K) Averaged fluorescence decrease in response to optogenetic stimulation at 40 Hz (n = 4 mice) and mean fluorescence quantified in K. (L–P) Dual-color fiber photometry recording of DA release with dLight1.1 and local neuronal activity with jRGECO1a. (M–N) Increase of dLight1.1 (green) and jRGECO1a (magenta) fluorescence during 5% sucrose consumption with lick rate (black, n = 5 mice). Mean fluorescence was quantified in (N). (O–P) Fluorescence decrease in dLight1.1 (green) and increase in jRGECO1a (red) during unpredictable footshock delivery (0.6 mA for 1 sec, n = 5 mice). Mean fluorescence was quantified in (P). Data shown are means ± SEM. Significance was calculated by means of paired or unpaired t tests for two-group comparisons and one-way ANOVA by post hoc Tukey’s test for multiple-group comparisons. * p < 0.05, ** p < 0.01, *** p < 0.001.
Fig. 4
Fig. 4. Dynamic changes of NAc DA signaling during appetitive Pavlovian conditioning and reward prediction error
(A) Pavlovian conditioning procedures involved learning to associate neutral cues (CS; house light and 5 kHz tone) with a sucrose reward (US; 50μL of 5% sucrose), and subsequent extinction. (B) Change of CS-evoked licks across cue-reward learning (left) and extinction (right). (C–D) dLight1.1 dynamics in response to CS and US in first and last sessions of cue-reward learning, shown in single (gray) and averaged (blue) trials (n=20 trials) from a single animal (C) or averaged across all trials and animals (n=5 mice) (D). Lick rate shown in black. (E) Same as (D), of cue-reward extinction (n = 5 mice). In D and E, the dotted lines indicate CS onset, US onset and CS offset respectively. (F–H) Evolution of CS- (F) and US- evoked (G left panel) average fluorescence and US triggered licks (G right panel) across learning and extinction sessions. Quantification of peak fluorescence across learning and extinction shown in (H). (I) Reward prediction error procedure. (J) Fluorescence response during expected (red) versus unexpected (black) reward consumption (n = 4 mice). (K) Peak fluorescence evoked by expected (red) and unexpected (black) reward consumption. (L) Fluorescence response during expected (red) versus unexpected reward omission (brown) (n = 4 mice). Second and third dotted line indicates US onset and CS offset. (M) Mean fluorescence during baseline and after unexpected reward omission. Data shown are means ± SEM. Significance was calculated from Pearson’s correlation coefficient and with paired t-test. * p < 0.05, ** p < 0.01.
Fig. 5
Fig. 5. Spatially resolved imaging of cortical dopamine release during a visuomotor association task
(A) Schematics of experimental setup. (B) To initiate a trial, mice were required to stand still for 10s following a visual cue (blue square). If mice started to run during the stimulus phase (“Hit trials”), a water reward was given. In 20% of randomly selected “Hit trials” the reward was withheld. If no run was triggered by stimulus presentation, the trials were counted as “Miss trials”. Erroneous/spontaneous runs during the stand-still phase ended the trial (no “Go” cue or reward). (C) Top, dorsal view of mouse cortex with the chronic cranial window (circle) and imaging location indicated (square). Bottom, heatmap of dLight1.2 expression pattern in layer 2/3 of M1 cortex. The image is overlaid with computationally defined regions of interest (ROIs, ~17×17μm). Colored ROIs indicate the type of fluorescence responses observed during the task. (D) Population data (N = 4 mice, n = 19 recording sessions) showing average task-related dLight1.2 transients (bottom) and mouse running velocity (top) aligned to trial/stand-still cue onset (0s). The solid vertical line indicates “Go” cue onset. The dotted line marks the end of the reward expectation phase during unrewarded Hit and Miss trials. The period during which running velocity-dependent reward consumption occurred is indicated by the horizontal line. Left, ROIs showing significantly increased responses during reward expectation/locomotion. Right, ROIs showing significant fluorescence increases to reward (dark green) but not unexpected reward omission (light green). Shaded areas of ΔF/F traces indicate s.d. (E) Population data realigned to running onset (vertical black line). ROIs with “Go” cue responses (panel D, left) can be subdivided into ROIs responsive to locomotion in all trials (left), and responsive to reward expectation only (center) with no fluorescence increases during spontaneous runs (pink). p<0.05, Wilcoxon test, Bonferroni corrected for multiple comparisons.

Comment in

  • Dopamine gets lit.
    Bucci M. Bucci M. Nat Chem Biol. 2018 Aug;14(8):745. doi: 10.1038/s41589-018-0111-7. Nat Chem Biol. 2018. PMID: 30018417 No abstract available.
  • A dLight-ful New View of Neuromodulation.
    Cosme CV, Palissery GK, Lerner TN. Cosme CV, et al. Trends Neurosci. 2018 Sep;41(9):566-568. doi: 10.1016/j.tins.2018.07.004. Epub 2018 Jul 25. Trends Neurosci. 2018. PMID: 30055832 Free PMC article.

References

    1. Tritsch NX, Sabatini BL. Dopaminergic modulation of synaptic transmission in cortex and striatum. Neuron. 2012;76:33–50. - PMC - PubMed
    1. Wise RA. Dopamine, learning and motivation. Nat Rev Neurosci. 2004;5:483–494. - PubMed
    1. Dudman JT, Krakauer JW. The basal ganglia: from motor commands to the control of vigor. Curr Opin Neurobiol. 2016;37:158–166. - PubMed
    1. Schultz W, Dayan P, Montague PR. A neural substrate of prediction and reward. Science. 1997;275:1593–1599. - PubMed
    1. Lee SH, Dan Y. Neuromodulation of brain states. Neuron. 2012;76:209–222. - PMC - PubMed

Publication types

MeSH terms