. 2018 Jul;177(3):1303-1318.
doi: 10.1104/pp.18.00402. Epub 2018 May 31.

DIACYLGLYCEROL ACYLTRANSFERASE and DIACYLGLYCEROL KINASE Modulate Triacylglycerol and Phosphatidic Acid Production in the Plant Response to Freezing Stress

Affiliations

DIACYLGLYCEROL ACYLTRANSFERASE and DIACYLGLYCEROL KINASE Modulate Triacylglycerol and Phosphatidic Acid Production in the Plant Response to Freezing Stress

Wei-Juan Tan et al. Plant Physiol. 2018 Jul.

Erratum in

  • CORRECTION: Vol. 177: 1303-1318, 2018.
    [No authors listed] [No authors listed] Plant Physiol. 2018 Nov;178(3):1424-1425. doi: 10.1104/pp.18.01200. Plant Physiol. 2018. PMID: 30425160 Free PMC article. No abstract available.

Abstract

Plants accumulate the lipids phosphatidic acid (PA), diacylglycerol (DAG), and triacylglycerol (TAG) during cold stress, but how plants balance the levels of these lipids to mediate cold responses remains unknown. The enzymes ACYL-COENZYME A:DIACYLGLYCEROL ACYLTRANSFERASE (DGAT) and DIACYLGLYCEROL KINASE (DGK) catalyze the conversion of DAG to TAG and PA, respectively. Here, we show that DGAT1, DGK2, DGK3, and DGK5 contribute to the response to cold in Arabidopsis (Arabidopsis thaliana). With or without cold acclimation, the dgat1 mutants exhibited higher sensitivity upon freezing exposure compared with the wild type. Under cold conditions, the dgat1 mutants showed reduced expression of C-REPEAT/DRE BINDING FACTOR2 and its regulons, which are essential for the acquisition of cold tolerance. Lipid profiling revealed that freezing significantly increased the levels of PA and DAG while decreasing TAG in the rosettes of dgat1 mutant plants. During freezing stress, the accumulation of PA in dgat1 plants stimulated NADPH oxidase activity and enhanced RbohD-dependent hydrogen peroxide production compared with the wild type. Moreover, the cold-inducible transcripts of DGK2, DGK3, and DGK5 were significantly more up-regulated in the dgat1 mutants than in the wild type during cold stress. Consistent with this observation, dgk2, dgk3, and dgk5 knockout mutants showed improved tolerance and attenuated PA production in response to freezing temperatures. Our findings demonstrate that the conversion of DAG to TAG by DGAT1 is critical for plant freezing tolerance, acting by balancing TAG and PA production in Arabidopsis.


Figures

Figure 1.
Figure 1.
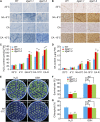
dgat1 mutants display decreased freezing tolerance. A, Images of NA wild-type (WT), dgat1-1, and dgat1-2 plants before (CK) and after 40 min at −6°C and −8°C freezing temperatures followed by a 5-d recovery period at normal growth conditions. B and C, Survival rate (B) and dry weight (C) of NA wild-type, dgat1-1, and dgat1-2 plants after freezing treatment (−6°C and −8°C) followed by a 5-d recovery. D, Electrolyte leakage of NA wild-type, dgat1-1, and dgat1-2 plants upon freezing exposure (−3°C, −4°C, −5°C, −6°C, −7°C, and −8°C). E, Images of CA wild-type, dgat1-1, and dgat1-2 plants before (CK) and after 40-min treatments at −8°C and −10°C freezing temperatures followed by a 5-d recovery under normal growth conditions. F and G, Survival rate (F) and dry weight (G) of CA wild-type, dgat1-1, and dgat1-2 plants after the freezing treatment (−8°C and −10°C) followed by a 5-d recovery period. H, Electrolyte leakage of CA wild-type, dgat1-1, and dgat1-2 plants after freezing treatments (−5°C, −6°C, −7°C, −8°C, −9°C, and −10°C). The experiments were repeated three times independently. Data are means ± sd (n = 3 biological replicates). For each experiment, five independent technical replicates (grouped by three different plants) were analyzed for each genotype. Asterisks indicate significant differences from the wild type (**, P < 0.01, Student’s t test).
Figure 2.
Figure 2.
Cell death, H2O2 levels, and SA levels in the rosettes of wild-type (WT) and dgat1 plants upon freezing treatment. A and B, Trypan Blue (A) and DAB (B) staining showing cell death and ROS accumulation in the rosettes of wild-type, dgat1-1, and dgat1-2 plants before (22°C) and after treatment. Bars = 1 mm. C, H2O2 accumulation in the rosettes of wild-type, dgat1-1, and dgat1-2 plants. FW, Fresh weight. D, SA levels in the leaves of wild-type, dgat1-1, and dgat1-2 plants. Rosettes of 4-week-old wild-type, dgat1-1, and dgat1-2 plants, NA or CA for 3 d, were transferred to −8°C (for NA plants) or −10°C (for CA plants) and subsequently recovered for 12 h at 4°C. Rosettes were collected for Trypan Blue staining, DAB staining, and H2O2 and SA content measurements. E, Phenotypes of 11-d-old wild-type, dgat1-1, and dgat1-2 seedlings before (CK) and after freezing treatment (NA −8°C) and treatment with 500 μm GSH, following a 5-d recovery at normal growth conditions. F and G, Survival rate (F) and relative chlorophyll content (G) of NA wild-type, dgat1-1, and dgat1-2 seedlings after medium freezing treatment (−8°C) followed by a 5-d recovery at normal growth conditions. The relative chlorophyll content under NA −8°C treatment was expressed as a percentage of the value for the same genotype grown under normal growth conditions (CK, set to 100%). nd, No significant difference. The experiments were repeated three times with more than 15 plants used for each genotype. Data are means ± sd (n = 3 biological replicates). Asterisks indicate significant differences from the wild type (**, P < 0.01, Student’s t test).
Figure 3.
Figure 3.
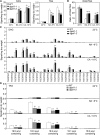
Lipid profiles in the rosettes of 4-week-old wild-type (WT), dgat1-1, and dgat1-2 plants before (22°C) and after NA or CA treatment followed by freezing exposure (NA −8°C or CA −10°C). Alterations are shown in the compositions of galactolipids (MGDG and digalactosyldiacylglycerol [DGDG]) and PLs (Phosphatidylglycerol [PG], phosphatidylcholine [PC], phosphatidylethanolamine [PE], phosphatidylinositol [PI], phosphatidylserine [PS], and PA) of wild-type, dgat1-1, and dgat1-2 rosettes before (22°C) and after NA or CA treatment followed by freezing stress (−8°C or −10°C). Values represent means ± sd (n = 4) of four independent samples, with each sample collected from the rosettes of three plants. Asterisks indicate significant differences from the wild type (*, P < 0.05 and **, P < 0.01, Student’s t test).
Figure 4.
Figure 4.
The increased freezing sensitivity of dgat1 mutants requires RbohD. A, Four-week-old wild-type (WT), dgat1-1, dgat1 rbohD, and rbohD plants before (CK) and after freezing treatment (NA −8°C and CA −10°C) followed by a 5-d recovery period at normal growth conditions. B, Survival rate of wild-type, dgat1-1, dgat1 rbohD, and rbohD plants after freezing treatment (NA −8°C and CA −10°C) followed by a 5-d recovery. C and D, NADPH activity (C) and H2O2 levels (D) in the rosettes of wild-type, dgat1-1, dgat1 rbohD, and rbohD plants before and after freezing treatment (NA −8°C and CA −10°C) followed by a 5-d recovery. NADPH oxidase activity is presented as ΔA470 per milligram of protein per minute in C. FW, Fresh weight. Letters a and b indicate lower and higher survival rate, NADPH activity, and H2O2 level in the freeze-treated mutants, respectively, compared with wild-type plants. The experiments were repeated three times with more than 15 plants used for each genotype. Data are means ± sd (n = 3 biological replicates). Asterisks indicate significant differences from the wild type (**, P < 0.01, Student’s t test).
Figure 5.
Figure 5.
Profiles of DAG and TAG in rosettes of 4-week-old wild-type (WT), dgat1-1, and dgat1-2 plants before (22°C) and after NA or CA treatment followed by freezing exposure (−8°C for NA and −10°C for CA). A and B, Relative levels (signal mg−1 dry weight) of total DAG and TAG in wild-type, dgat1-1, and dgat1-2 rosettes before (22°C) and after NA or CA followed by freezing treatment. The DAG-TAG ratio of each treatment is presented in B. C and D, Molecular species of DAG (C) and TAG (D) in wild-type, dgat1-1, and dgat1-2 rosettes before (22°C) and after freezing treatment (NA −8°C and CA −10°C). Data are means ± sd (n = 4) of four independent samples, and each sample was collected from the rosettes of three plants. Asterisks indicate significant differences from the wild type (**, P < 0.01, Student’s t test).
Figure 6.
Figure 6.
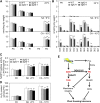
Knockout of DGK2, DGK3, and DGK5 confers enhanced freezing tolerance. A, Expression profiles of cold-responsive DGKs and PLDs in wild-type (WT), dgat1-1, and dgat1-2 plants under cold (4°C) or freezing (−10°C) temperatures followed by recovery. Rosettes of 4-week-old wild-type, dgat1-1, and dgat1-2 plants treated at 4°C for 0, 6, 12, 24, and 72 h, freezing (−10°C) for 40 min (CA −10), and following recovery at 4°C for 6 h (CA-R) were collected for total RNA extraction. Hierarchical cluster analyses were used in the transcript levels of six DGKs (DGK1, DGK2, DGK3, DGK4, DGK5, and DGK6), PLDα1, and PLDδ determined by RT-qPCR. Three biological replicates were conducted with similar results, and representative data from one experiment are shown. Data are means ± sd (n = 3) of three technical replicates. The relative gene expression values were plotted with the heatmap 2.0 package in R, with red and blue colors representing up- and down-regulation, respectively. Asterisks indicate significant differences in dgat1-1 and dgat1-2 plants compared with the wild type (**, P < 0.01, Student’s t test). B, NA and CA wild-type, dgk2-1, dgk3-1, and dgk5-1 seedlings before (CK) and after freezing treatment (NA −8°C or CA −10°C) followed by a 5-d recovery period at normal growth conditions. C, Survival rate and dry weight of NA and CA wild-type, dgk2-1, dgk3-1, and dgk5-1 plants after freezing treatment (NA −8°C or CA −10°C) followed by a 5-d recovery period.
Figure 7.
Figure 7.
Total lipids and PA species of 4-week-old wild-type (WT), dgk2-1, dgk3-1, and dgk5-1 plants before (22°C) and after NA or CA treatment following freezing exposure (NA −8°C or CA −10°C). A, Alteration in the compositions of PLs (PC, PE, PI, PS, and PA) of wild-type, dgk2-1, dgk3-1, and dgk5-1 rosettes before (22°C) and after NA or CA following freezing stress (−8°C or −10°C). B, Concentrations of PA species of wild-type, dgk2-1, dgk3-1, and dgk5-1 rosettes before (22°C) and after NA or CA following freezing stress (−8°C or −10°C). C and D, NADPH activity (C) and H2O2 levels (D) of wild-type, dgk2-1, dgk3-1, and dgk5-1 plants before (CK) and after freezing treatment (NA −8°C or CA −10°C). NADPH oxidase activity is presented as ΔA470 per milligram of protein per minute. FW, Fresh weight. E, A working model showing the role of DGAT1 in the plant response to freezing by modulating DAG homeostasis and ROS production.

References

    1. Apel K, Hirt H (2004) Reactive oxygen species: metabolism, oxidative stress, and signal transduction. Annu Rev Plant Biol 55: 373–399 - PubMed
    1. Arisz SA, van Wijk R, Roels W, Zhu JK, Haring MA, Munnik T (2013) Rapid phosphatidic acid accumulation in response to low temperature stress in Arabidopsis is generated through diacylglycerol kinase. Front Plant Sci 4: 1. - PMC - PubMed
    1. Browse J. (2010) Saving the bilayer. Science 330: 185–186 - PubMed
    1. Chen M, Thelen JJ (2013) ACYL-LIPID DESATURASE2 is required for chilling and freezing tolerance in Arabidopsis. Plant Cell 25: 1430–1444 - PMC - PubMed
    1. Chen L, Liao B, Qi H, Xie LJ, Huang L, Tan WJ, Zhai N, Yuan LB, Zhou Y, Yu LJ, et al. (2015a) Autophagy contributes to regulation of the hypoxia response during submergence in Arabidopsis thaliana. Autophagy 11: 2233–2246 - PMC - PubMed

Publication types

MeSH terms