. 2018 Jun 27;38(26):5949-5968.
doi: 10.1523/JNEUROSCI.3621-17.2018. Epub 2018 May 31.

Increased Microglial Activity, Impaired Adult Hippocampal Neurogenesis, and Depressive-like Behavior in Microglial VPS35-Depleted Mice

Affiliations

Increased Microglial Activity, Impaired Adult Hippocampal Neurogenesis, and Depressive-like Behavior in Microglial VPS35-Depleted Mice

Joanna Ruth Appel et al. J Neurosci. .

Abstract

Vacuolar sorting protein 35 (VPS35) is a critical component of retromer, which is essential for selective endosome-to-Golgi retrieval of membrane proteins. VPS35 deficiency is implicated in neurodegenerative disease pathology, including Alzheimer's disease (AD). However, exactly how VPS35 loss promotes AD pathogenesis remains largely unclear. VPS35 is expressed in various types of cells in the brain, including neurons and microglia. Whereas neuronal VPS35 plays a critical role in preventing neurodegeneration, the role of microglial VPS35 is largely unknown. Here we provide evidence for microglial VPS35's function in preventing microglial activation and promoting adult hippocampal neurogenesis. VPS35 is expressed in microglia in various regions of the mouse brain, with a unique distribution pattern in a brain region-dependent manner. Conditional knocking out of VPS35 in microglia of male mice results in regionally increased microglial density and activity in the subgranular zone of the hippocampal dentate gyrus (DG), accompanied by elevated neural progenitor proliferation, but decreased neuronal differentiation. Additionally, newborn neurons in the mutant DG show impaired dendritic morphology and reduced dendritic spine density. When examining the behavioral phenotypes of these animals, microglial VPS3S-depleted mice display depression-like behavior and impairment in long-term recognition memory. At the cellular level, VPS35-depleted microglia have grossly enlarged vacuolar structures with increased phagocytic activity toward postsynaptic marker PSD95, which may underlie the loss of dendritic spines observed in the mutant DG. Together, these findings identify an important role of microglial VPS35 in suppressing microglial activation and promoting hippocampal neurogenesis, which are both processes involved in AD pathogenesis.SIGNIFICANCE STATEMENT The findings presented here provide the first in vivo evidence that Vacuolar sorting protein 35 (VPS35)/retromer is essential for regulating microglial function and that when microglial retromer mechanics are disrupted, the surrounding brain tissue can be affected in a neurodegenerative manner. These findings present a novel, microglial-specific role of VPS35 and raise multiple questions regarding the mechanisms underlying our observations. These findings also have myriad implications for the field of retromer research and the role of retromer dysfunction in neurodegenerative pathophysiology. Furthermore, they implicate a pivotal role of microglia in the regulation of adult hippocampal neurogenesis and the survival/integration of newborn neurons in the adult hippocampus.

Keywords: Alzheimer's disease; VPS35; hippocampus; microglia; neurogenesis; retromer.


Figures

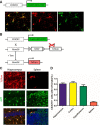
Figure 1.
Figure 1.
Microglial VPS35 expression. A, Representative images of in vivo microglial VPS35 expression in various brain regions [CA1 (hippocampus), striatum, Ec-Ctx] as exhibited by IBA-1 coimmunofluorescence. Scale bar, 10 μm. B, Representative image of primary cultured microglial VPS35 expression by coimmunostaining analysis. Primary microglia cultures were obtained from C57BL/6J mice and immunostained with primary antibodies for IBA1 and VPS35. Scale bar, 10 μm. C, Representative image of primary cultured cortical neuronal VPS35 expression by coimmunostaining analysis. Cortical neuronal cultures were obtained from C57BL/6J mice and immunostained with primary antibodies for Tuj1 and VPS35. Arrow, Neuron; arrowhead, non-neuronal cell (likely a glial cell). Scale bar, 20 μm. D, Western blot analysis of microglial VPS35 expression. Soluble lysates from primary microglia and neuronal cultures from C57BL/6J mice were subjected to Western blot analysis. E, VPS35 mRNA levels in microglia and cortex from mice at indicated age. Data were adapted from http://web.stanford.edu/group/barres_lab/brainseq2/brainseq2.html. FPKM, Fragments per kilobase of transcript per million mapped reads.
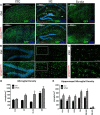
Figure 2.
Figure 2.
Characterization of microglial Cre activity in the CX3CR1Cre-ER/+ mouse. A, Microglia-specific Cre expression in the CX3CR1Cre-ER/+ mouse line. Top, Schematic of the gene encoding Cre-ER, followed by IRES-EYFP element as expressed in the CX3CR1Cre-ER mouse. Bottom, Representative images of microglia-specific Cre expression following tamoxifen injection in CX3CR1Cre-ER/+ mice. Scale bar, 20 μm. B, Generation of the CX3CR1Cre-ER/+; Ai9 mouse line by crossing the CX3CR1Cre-ER/+ mouse with the Rosa26tDTomato reporter line (Ai9). Seventy-five milligrams per kilogram tamoxifen was administered intraperitoneally to P15 animals over 5 d, and tissue was analyzed ∼30 d following the final tamoxifen injection. C, Representative images depicting GFP coimmunofluorescence with tdTomato in the hippocampus and spleen in CX3CR1Cre-ER/+; Ai9 mouse. Scale bar, 50 μm. D, Quantification of GFP:tdTomato cofluorescence throughout the CNS and the spleen, which shows high GFP+:tdTomato+ reporting throughout the CNS with low coexpression in the spleen.
Figure 3.
Figure 3.
Generation of the VPS35CX3CR1 mouse. A, Diagram outlining the treatment strategy implemented to generate VPS35CX3CR1 mice. VPS35flox/flox female mice were crossed with male CX3CR1Cre-ER/Cre-ER mice followed by subsequent backcrossing with female VPS35flox/flox mice to generate male VPS35flox/flox;CX3CR1Cre-ER/+ (VPS35CX3CR1-Cre-ER) mice, subsequently treated with tamoxifen or corn oil (controls) at P15–P19 to generate VPS35CX3CR1/+ mice (labeled throughout text as VPS35CX3CR1). Unless otherwise noted in the text, control data reported are from male littermate-matched vehicle-treated VPS35CX3CR1-Cre-ER mice, denoted as CX3CR1Cre-ER. B, Primary microglia isolated from adult mice (P45–P60) and immunostained for VPS35 show depletion of VPS35 from VPS35CX3CR1 microglia. Scale bar, 10 μm. C, Microglia isolated from the brains of adult VPS35CX3CR1 mice and vehicle-treated controls were immediately lysed and analyzed for protein levels of VPS35 via Western blot to exhibit microglia-specific depletion of VPS35 in the CNS of VPS35CX3CR1 mice. D, Weight loss of VPS35CX3CR1 mice compared with vehicle-treated (CX3CR1Cre-ER) and tamoxifen-treated (Tam VPS35flox/flox) controls.
Figure 4.
Figure 4.
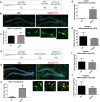
Regional-specific increase in microglial density following VPS35 depletion. A–E, Microglial VPS35 loss of function affects a regional-specific increase in microglial density. A, Representative images from the prefrontal cortex (PFC), hippocampus (HC), molecular layer (ML), granular cell layer (GCL), subgranular zone (SGZ), and Ec-Ctx. B, Representative images of GFP immunofluorescence in the DG. White boxes represent the region shown in C. Scale bar, 100 μm. C, Enlarged images of GFP+ cells in the SGZ suggest altered morphology of VPS35CX3CR1 microglia. Scale bar, 50 μm. D, Statistical analysis of microglial density by region. Ctrl, CX3CR1Cre-ER/+; VPS35, VPS35CX3CR1 (Student's unpaired t test, n = 4, PFC: p = 0.20; HC: p < 0.0001; Ec-Ctx: p = 0.0023; SN: p = 0.035). E, Statistical analysis of hippocampal microglial density by hippocampal region. Ctrl, CX3CR1Cre-ER/+; VPS35, VPS35CX3CR1. GCL, Granular cell layer. (Student's unpaired t test, n = 4; CA1: p = 0.071; CA2: p = 0.058, CA3: p = 0.009; DG: p = 0.001; SGZ: p = 0.02; GCL: p = 0.06). For all analyses, statistical significance (*p ≤ 0.05).
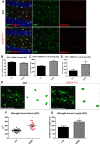
Figure 5.
Figure 5.
Infiltration of peripheral macrophages and altered SGZ microglial morphology following VPS35 depletion. A, Representative images of GFP:TMEM119 coimmunofluorescence in the DG. Scale bar, 50 μm. B, Statistical analysis of GFP+ and TMEM119+ cells indicates >90% of GFP+ cells express TMEM119. C, Statistical analysis of increased GFP+:TMEM119+ cell density in the DGs of VPS35CX3CR1 mice (Student's unpaired t test, n = 5, p = 0.0002). D, Statistical analysis of increased GFP+:TMEM119 cell density in the DGs of VPS35CX3CR1 mice implicates an infiltration of peripheral macrophages (Student's unpaired t test, n = 5, p = 0.03). E, Representative images of SGZ microglial morphology and 3D visualizations of soma volume as calculated using Reconstruct software. Scale bar, 141.52 μm. F, Statistical analysis of increased microglia soma volume in SGZ microglia of VPS35CX3CR1 mice. Ctrl, CX3CR1Cre-ER/+; VPS35, VPS35CX3CR1 (Student's unpaired t test, n = 14–31, sampled from 3 animals per group, with ≥4 microglia per animal analyzed, p < 0.0001). G, Statistical analysis of increased total microglia process length in SGZs of VPS35CX3CR1 mice. Ctrl, CX3CR1Cre-ER/+; VPS35, VPS35CX3CR1 (Student's unpaired t test, n = 13–23, sampled from 3 animals per group, with ≥4 microglia per animal analyzed, p < 0.014). For all analyses, statistical significance (*p ≤ 0.05).
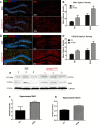
Figure 6.
Figure 6.
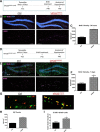
Upregulated hippocampal microglial activity following microglial VPS35 depletion. A, Representative images of IBA1 immunofluorescence in the hippocampus following microglial VPS35 loss of function. B, Statistical analysis of hippocampal IBA1 fluorescent optical density [Student's unpaired t test, n = 3, hippocampus (HC): p = 0.012; SGZ: p = 0.046]. C, Representative images of CD16/32 immunofluorescence in the hippocampus following microglial VPS35 loss of function. D, Statistical analysis of hippocampal CD16/32 fluorescent optical density (Student's unpaired t test, n = 3, HC: p = 0.014; SGZ: p = 0.022). E–G, Hippocampal tissue was solubilized and subjected to Western blot analysis, confirming an increase in IBA1 and identifying increased CD11b, both indicative of upregulated microglial activity (Student's unpaired t test, n = 3, IBA1: p = 0.044; CD11b: p = 0.0009). For all analyses, statistical significance (*p < 0.05).
Figure 7.
Figure 7.
Increased microglial survival and/or migration in the VPS35CX3CR1 hippocampus. A–C, Analysis of hippocampal microglial proliferation. A, Schematic of BrdU treatment for analysis of proliferation. C, Representative images of GFP:BrdU costaining. B, Statistical analysis of BrdU+ proliferative microglia shows no difference in microglial proliferation following microglial VPS35 loss of function (Student's unpaired t test, n = 3, p = 0.3528). D–F, Analysis of hippocampal microglial differentiation and survival. D, Schematic of BrdU treatment for analysis of NPC differentiation. E, Representative images of GFP:BrdU costaining show increased GFP+:BrdU+ costaining in the hippocampus of VPS35CX3CR1 mice. F, Increased density of BrdU+-differentiated microglia in the DGs of VPS35CX3CR1 mice suggests increased hippocampal microglial survival or differentiation. (Student's unpaired t test, n = 3, p = 0.0036). G–J, Statistical analysis of glial differentiation based upon percentage of BrdU+ microglia (G; p = 0.0193), oligodendrocytes (H; p = 0.3158), or astrocytes (I; p = 0.4325; J; p = 0.3337) out of total BrdU+ cells 7 d following BrdU treatment (Student's unpaired t test, n = 2–3). For all analyses, statistical significance (*p ≤ 0.05).
Figure 8.
Figure 8.
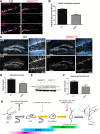
Aberrant hippocampal neurogenesis following microglial VPS35 loss of function, characterized by elevated neural progenitor proliferation and arrested cell-cycle exit. A, Animals were treated with BrdU and analyzed 24 h following treatment to assess BrdU+ cells for proliferation. B, C, Increased BrdU density in the SGZs of VPS35CX3CR1 mice 24 h following BrdU treatment (Student's unpaired t test, n = 3, p = 0.0001) suggests increased proliferation of hippocampal NSCs following microglial VPS35 loss of function. D, Animals were treated with BrdU and analyzed 7 d following treatment for survival of differentiated NPCs. E, F, Increased BrdU density in the SGZs of VPS35CX3CR1 mice 7 d following BrdU treatment (Student's unpaired t test, n = 3, p = 0.0127) suggests an increased survival rate of hippocampal NPCs following microglial VPS35 loss of function. G, H, Ki67 immunofluorescence displays a significant increase in overall Ki67+ cells, suggesting an increase in Ki67+-proliferating NSCs following microglial VPS35 loss of function. I, Ki67+:BrdU+ cells were quantified 1 week following BrdU treatment to assess cell-cycle exit. A significant increase in total percentage of BrdU+ cells which are Ki67+ was noted, suggesting BrdU+ cells may be increased due to a failure to exit the cell cycle (Student's unpaired t test, n = 3, p < 0.0324). For all analyses, statistical significance (*p ≤ 0.05).
Figure 9.
Figure 9.
A decrease of neuronal differentiation and a reduction of immature neurons in VPS35CX3CR1 DGs. A, Representative images of BrdU:DCX coimmunofluorescence 1 week following BrdU treatment. Scale bar, 50 μm. B, Statistical analysis of percentage of BrdU+ cells expressing DCX 7 d following BrdU treatment (as a percentage of total BrdU+ cells) indicates decreased neuronal differentiation following microglial VPS35 loss of function (Student's unpaired t test, n = 3, p = 0.0034). C, Representative images of hippocampal DCX immunofluorescence and 60× zoomed images, demonstrating the reduced levels of DCX and DCX+ processes following microglial VPS35 depletion. D, Statistical analysis of DG DCX fluorescent optical density (Student's unpaired t test, n = 3, p = 0.0207). E, F, Hippocampal tissue was solubilized and subjected to Western blot analysis, confirming reduced levels of DCX in VPS35CX3CR1 mice (Student's unpaired t test, n = 3, p = 0.033). G, Schematic depicting the model in which microglial VPS35 loss of function affects aberrant hippocampal neurogenesis, during which an increase is observed in proliferating NSCs, concurrent with a decrease in immature neurons and arrested cell-cycle exit. For all analyses, statistical significance (*p ≤ 0.05).
Figure 10.
Figure 10.
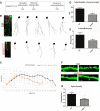
Neurodegenerative-like morphology of newborn neurons in VPS35CX3CR1 DGs. A, Schematic of timeline for stereotaxic injection of a GFP-expressing retroviral vector into the DG to selectively label dividing cells. B, Representative images of GFP+ neurons and tracings. Scale bar, 20 μm. F, G, GFP+ neurons in DGs of VPS35CX3CR1 mice exhibited decreased dendritic spine density (Student's t test, n = 10 secondary branches from 2 animals per group, p < 0.05). C, Sholl analysis indicates decreased number of intersections in GFP+ neurons in the DGs of VPS35CX3CR1 mice. D, E, GFP+ neurons in VPS35CX3CR1 mice were found to have decreased total length of processes (p = 0.0028) and total number of branches (p = 0.027; Student's t test, n = 20 neurons from 2 animals per group). F, G, GFP+ neurons in DGs of VPS35CX3CR1 mice exhibited decreased dendritic spine density. Scale bar, 2.5 μm (Student's unpaired t test, n = 10 secondary branches from 2 animals per group, p = 0.0023). For all analyses, statistical significance (*p ≤ 0.05).
Figure 11.
Figure 11.
Increased microglial engulfment of postsynaptic elements following microglial VPS35 loss of function. A, B, Primary microglia isolated from adult VPS35CX3CR1 mice exhibit grossly enlarged vacuolar structures. Scale bar, 10 μm (Student's unpaired t test, n = 7–10 microglia per group, p = 0.0059). C–E, VPS35CX3CR1 primary microglia cocultured with primary cortical neurons transfected with mCh construct exhibit increased uptake of mCh+ neuronal debris. Scale bar, 10 μm (Student's unpaired t test, n = 8 microglia per group, p = 0.0187). F–I, VPS35CX3CR1 primary microglia cocultured with primary cortical neurons exhibit increased engulfment of PSD95+ postsynaptic material (p = 0.0323), without any significant uptake of synapsin+ presynaptic material (p = 0.4965). Scale bar, 10 μm (Student's unpaired t test, n = 9 microglia per group). J, K, VPS35CX3CR1 hippocampal microglia display increased engulfment of PSD95+ postsynaptic material in vivo as exhibited by high-resolution confocal microscopy analysis of GFP:PSD95 coimmunofluorescence. Scale bar, 50 μm (Student's unpaired t test, n = 7, p = 0.0002). For all analyses, statistical significance (*p ≤ 0.05).
Figure 12.
Figure 12.
Behavioral phenotypes of the VPS35CX3CR1 mouse. A, Outline of behavioral analysis experimental design. B–E, Open-field test locomotor activity (C, D) and anxiety-related behavior (E) are not altered in VPS35CX3CR1 mice as gauged by total distance (p = 0.285), mean velocity (p = 0.3695), and time spent in the center (p = 0.8). F, G, No significant difference was observed in Y-maze performance (p = 0.5586), suggesting that spatial memory is not impaired in VPS35CX3CR1 mice. H, I, Novel-object recognition suggests a slight impairment in VPS35CX3CR1 recognition memory as indicated by a p value of 0.06 and a recognition index of 50% 30 and 120 min following initial exposure and a significant impairment in long-term memory (48 h after exposure, p = 0.0023). J–L, Depressive model behavioral testing revealed tendency toward depressive behavior in VPS35CX3CR1 mice. I, Sucrose preference is significantly lower in VPS35CX3CR1 mice (p = 0.0019) than in controls, suggesting a reduced tendency VPS35CX3CR1 pleasure-seeking behavior. J, Time spent immobile during tail suspension is significantly higher in VPS35CX3CR1 mice (p = 0.0275). K, Forced-swim test shows a trend toward increased time spent immobile by VPS35CX3CR1 mice, but not significantly (p = 0.1882). All tests were statistically analyzed by Student's t test, except for novel-object recognition, which was analyzed by one-way ANOVA (n = 8). For all analyses, statistical significance (*p ≤ 0.05).

References

    1. Bennett ML, Bennett FC, Liddelow SA, Ajami B, Zamanian JL, Fernhoff NB, Mulinyawe SB, Bohlen CJ, Adil A, Tucker A, Weissman IL, Chang EF, Li G, Grant GA, Hayden Gephart MG, Barres BA (2016) New tools for studying microglia in the mouse and human CNS. Proc Natl Acad Sci U S A 113:E1738–E1746. 10.1073/pnas.1525528113 - DOI - PMC - PubMed
    1. Bonifacino JS. (2014) Adaptor proteins involved in polarized sorting. J Cell Biol 204:7–17. 10.1083/jcb.201310021 - DOI - PMC - PubMed
    1. Bruel-Jungerman E, Laroche S, Rampon C (2005) New neurons in the dentate gyrus are involved in the expression of enhanced long-term memory following environmental enrichment. Eur J Neurosci 21:513–521. 10.1111/j.1460-9568.2005.03875.x - DOI - PubMed
    1. Cryan JF, Markou A, Lucki I (2002) Assessing antidepressant activity in rodents: recent developments and future needs. Trends Pharmacol Sci 23:238–245. 10.1016/S0165-6147(02)02017-5 - DOI - PubMed
    1. Demars M, Hu YS, Gadadhar A, Lazarov O (2010) Impaired neurogenesis is an early event in the etiology of familial Alzheimer's disease in transgenic mice. J Neurosci Res 88:2103–2117. 10.1002/jnr.22387 - DOI - PMC - PubMed

Publication types

Substances

LinkOut - more resources