Review
. 2018 May 8:2018:5360375.
doi: 10.1155/2018/5360375. eCollection 2018.

Overview and Critical Appraisal of Arterial Spin Labelling Technique in Brain Perfusion Imaging

Affiliations
Review

Overview and Critical Appraisal of Arterial Spin Labelling Technique in Brain Perfusion Imaging

Amirah Alsaedi et al. Contrast Media Mol Imaging. .

Abstract

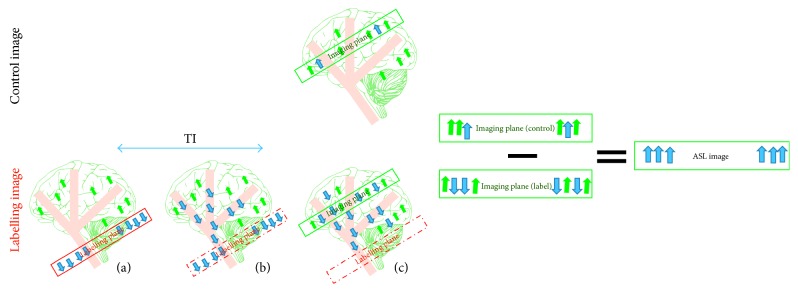
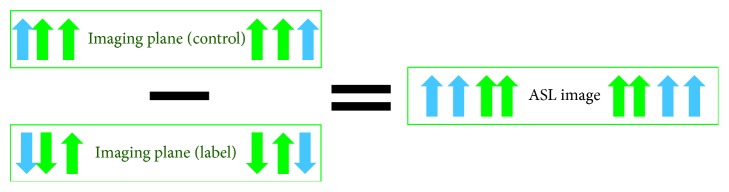
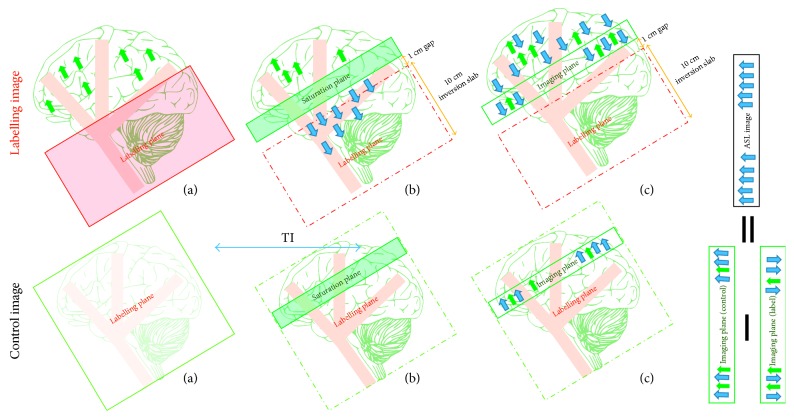
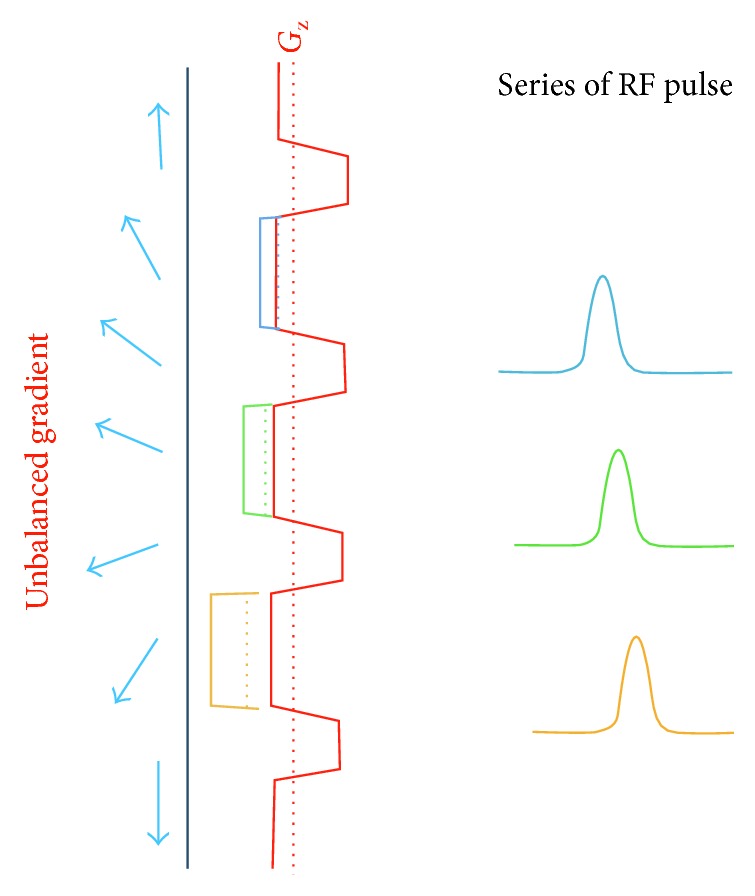
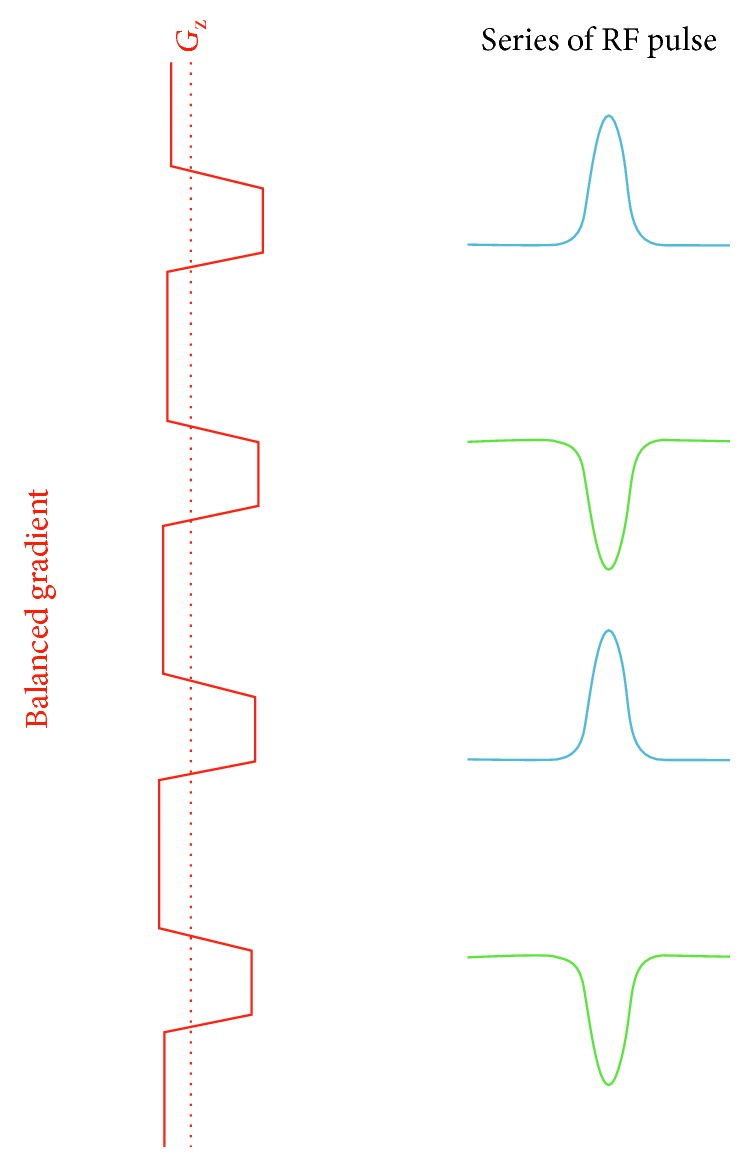
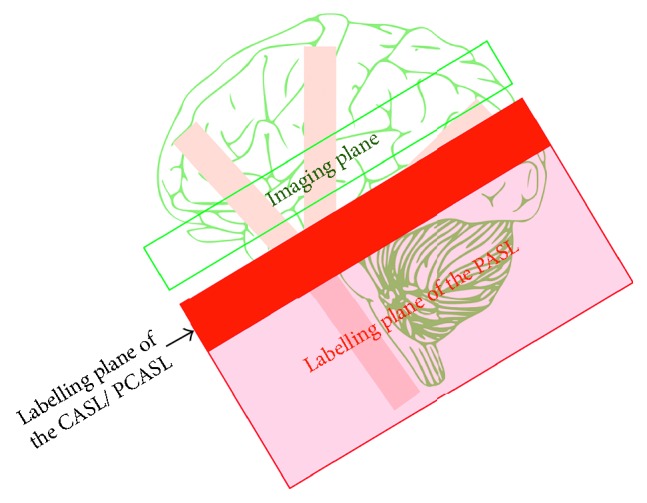
Arterial spin labelling (ASL) allows absolute quantification of CBF via a diffusible intrinsic tracer (magnetically labelled blood water) that disperses from the vascular system into neighbouring tissue. Thus, it can provide absolute CBF quantification, which eliminates the need for the contrast agent, and can be performed repeatedly. This review will focus on the common ASL acquisition techniques (continuous, pulsed, and pseudocontinuous ASL) and how ASL image quality might be affected by intrinsic factors that may bias the CBF measurements. We also provide suggestions to mitigate these risks, model appropriately the acquired signal, increase the image quality, and hence estimate the reliability of the CBF, which consists an important noninvasive biomarker. Emerging methodologies for extraction of new ASL-based biomarkers, such as arterial arrival time (AAT) and arterial blood volume (aBV), will be also briefly discussed.


Figures

Figure 1
Figure 1
The drawing shows the main mechanisms of arterial spin labelling (ASL). The labelling image is acquired using blood water as a diffusible tracer. (a) The proximal labelling plane to the imaging target point where the flowing protons are magnetically labelled via inversion (blue arrows); (b) during a delay time, TI, the tagged blood water leaves the label plane and starts to disperse into tissue at the image plane; (c) the labelled image is obtained. The control image is acquired without a labelling pulse in order to extract the tagged blood water from the static tissue (green arrows). Subtracting the two images (control−labelled) leaves the tagged protons, which are directly proportional to the tissue perfusion.
Figure 2
Figure 2
A drawing showing the delivery function C(t), which is not zero at Δt+τΔt < t < Δt+τ.
Figure 3
Figure 3
General kinetic model curve illustrating the difference in the delivery bolus C(t) between CASL and PASL. Where the uppermost curve represents the CASL, and the lower curve represents the PASL. Respectively, the blue, red, and light blue boxes represent the different part of the general kinetic model.
Figure 4
Figure 4
Impact of the MT effect on perfusion evaluation. This effect causes a reduction in the static tissue in the labelling image leading to a subsequent overestimating of perfusion quantification. Static tissue is represented by green arrows and tagged blood water by blue arrows.
Figure 5
Figure 5
Flow-induced adiabatic inversion. By applying a constant gradient through the flow direction, the flowing blood water gradually changes its local resonance frequency. Simultaneous constant RF pulse is applied over a small spatial location (the labelling plane) where it is on-resonance with the local resonance frequency of the flowing blood water. Subsequently, the flowing blood water inverts as it crosses the labelling plane. Tagged blood water represented by blue arrows and red arrows illustrates the flowing blood water before and after inversion.
Figure 6
Figure 6
A drawing showing the continuous arterial spin labelling (CASL). Static tissue is shown by green arrows, while tagged blood water is shown by blue arrows.
Figure 7
Figure 7
A drawing showing the mechanisms of echo-planar imaging and signal targeting with alternating radiofrequency (EPISTAR). The labelling image is acquired using a large inversion slab (a) during the application of the proximal tagging; (b) a saturation slab is applied to the imaging plane in order to remove tagging contamination; (c) the tagged image is obtained after a delay time (TI) during which the tagged blood water leaves the labelled plane and starts to disperse from the vascular system into tissues at the image plane (arterial arrival time). A control image is acquired using a distal large inversion slab (a) during the application of tagging; (b) then a saturation slab is applied (c) to obtain the control image after the same delay time TI where the tagged venous spins enter the control image. The ASL difference image (control−label) includes the tagged venous spins, which are negative and appear as focal dark spots. Static tissue spins are shown as green arrows and tagged blood water is shown as blue arrows.
Figure 8
Figure 8
A drawing showing the flow-sensitive inversion pulse (FAIR) mechanism. A labelling image is acquired using a large inversion slab, (a) during application of the nonselective slice pulse; (b) the tagged image is obtained after a delay time (TI) and contains tagged flowing spins from arteries and veins. A control image is acquired using the same inversion pulse in a slice-selective (a). The slice selected is larger than the image slice (b). The control image is obtained after TI. The ASL difference image (control−label) shows the tagged venous spins as bright signals. Static tissue spins are shown as green arrows and tagged blood water as blue arrows.
Figure 9
Figure 9
A drawing showing the mechanism for proximal inversion with a control for off-resonance effect (PICORE) mechanism. The labelling image is acquired using a large inversion slab (a) during application of proximal tagging; (b) a saturation slab is placed on the imaging plane in order to remove tagging contamination; (c) the tagged image is obtained after a delay time (TI) where the tagged blood water leaves the labelled plane and starts diffusing from intravascular vessels into tissue at the image plane during arterial arrival time. The control image is acquired using (a) a shifted RF pulse with no gradient; (b) a saturation slab followed by (c) obtains the control image after the same delay time TI. The ASL difference image (control−label), unlike those in EPISTAR and FAIR, does not involve any tagged venous spins. Static tissue is shown using green arrows and tagged blood water with blue arrows.
Figure 10
Figure 10
A drawing showing the composition of the labelling plane of pseudocontinuous arterial spin labelling (PCASL). The unbalanced gradient produce ≈1 mT/m on average and the RF pulses also produce a B1 ≈ 1 mT/m on average. The blue arrows represent the flowing blood water before and after inversion. Different colour gradients and RF pulses represent the amplitude increases and the adjusted RF pulse phases, respectively.
Figure 11
Figure 11
A drawing showing the composition of the control pulse sequence of pseudocontinuous arterial spin labelling (PCASL). The balanced gradient produces zero on average, and the alternating RF pulses produce a B1 that is also zero on average. The blue and green RF pulses represent the alternative behaviours that result in a zero-average B1.
Figure 12
Figure 12
A drawing showing the difference between the tag plane of the CASL/PCASL and that of PASL.
Figure 13
Figure 13
A drawing showing various arterial arrival times depending on the vessel structure (a) during labelling, (b) during the first transit time after labelling, and (c) during the second transit time following labelling. Notice how the tagged bolus loses tagging via T1 decay, which is displayed as a lightening of shade.
Figure 14
Figure 14
This drawing shows the QUIPSS II technique and its particular conditions. The first condition is satisfied (a-b) TI1 < tagged bolus, and the second condition is that TITI1 > the transit delay.

References

    1. Assi H., Candolfi M., Baker G., Mineharu Y., Lowenstein P. R., Castro M. G. Gene therapy for brain tumors: basic developments and clinical implementation. 2012;527(2):71–77. doi: 10.1016/j.neulet.2012.08.003. - DOI - PMC - PubMed
    1. Dean B. L., Drayer B. P., Bird C. R., et al. Gliomas: classification with MR imaging. 1990;174(2):411–415. doi: 10.1148/radiology.174.2.2153310. - DOI - PubMed
    1. Felix R., Schorner W., Laniado M., et al. Brain tumors: MR imaging with gadolinium-DTPA. 1985;156(3):681–688. doi: 10.1148/radiology.156.3.4040643. - DOI - PubMed
    1. Runge V. M., Clanton J. A., Price A. C., et al. The use of GD DTPA as a perfusion agent and marker of blood-brain barrier disruption. 1985;3(1):43–55. doi: 10.1016/0730-725X(85)90008-6. - DOI - PubMed
    1. Wesseling P., Ruiter D. J., Burger P. C. Angiogenesis in brain tumors; pathobiological and clinical aspects. 1997;32(3):253–265. doi: 10.1023/A:1005746320099. - DOI - PubMed