

Large-scale Analysis of Opioid Poisoning Related Hospital Visits in New York State
- PMID: 29854119
- PMCID: PMC5977648
Large-scale Analysis of Opioid Poisoning Related Hospital Visits in New York State
Abstract
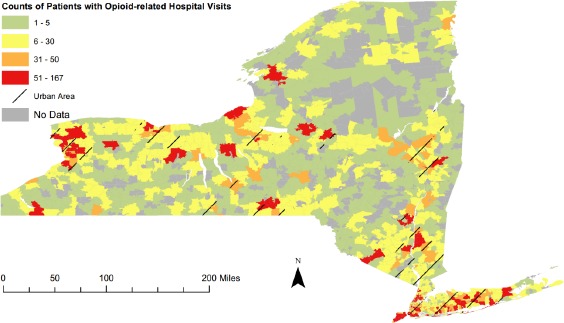
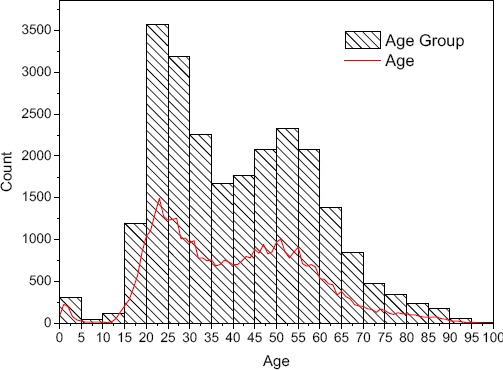
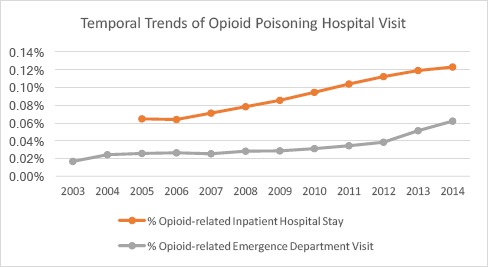
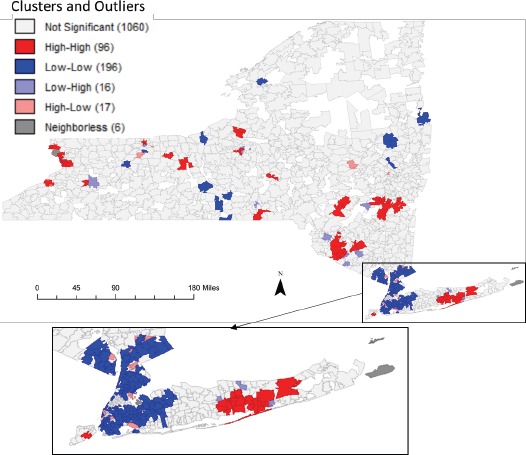
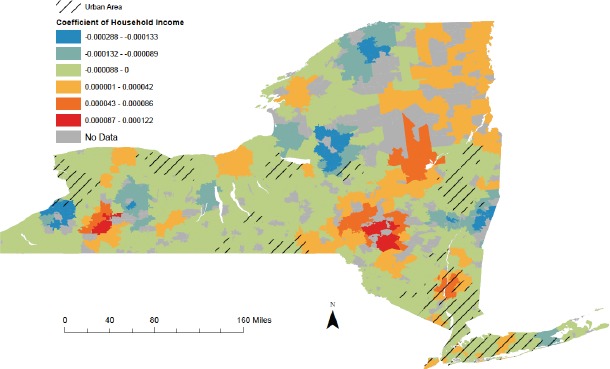
Opioid related deaths are increasing dramatically in recent years, and opioid epidemic is worsening in the United States. Combating opioid epidemic becomes a high priority for both the U.S. government and local governments such as New York State. Analyzing patient level opioid related hospital visits provides a data driven approach to discover both spatial and temporal patterns and identity potential causes of opioid related deaths, which provides essential knowledge for governments on decision making. In this paper, we analyzed opioid poisoning related hospital visits using New York State SPARCS data, which provides diagnoses of patients in hospital visits. We identified all patients with primary diagnosis as opioid poisoning from 2010-2014 for our main studies, and from 2003-2014 for temporal trend studies. We performed demographical based studies, and summarized the historical trends of opioid poisoning. We used frequent item mining to find co-occurrences of diagnoses for possible causes of poisoning or effects from poisoning. We provided zip code level spatial analysis to detect local spatial clusters, and studied potential correlations between opioid poisoning and demographic and social-economic factors.
Figures
References
-
- Increases in Drug and Opioid Overdose Deaths — United States, 2000-2014 [Internet], Cdc.gov. 2017. Available from: https://www.cdc.gov/mmwr/preview/mmwrhtml/mm6450a3.htm.
-
- Opioid Abuse in the U.S. and HHS Actions to Address Opioid-Drug Related Overdoses and Deaths [Internet] Available from: https://aspe.hhs.gov/basic-report/opioid-abuse-us-and-hhs-actions-addres....
-
- Maximizing OpiOid Safety with Naloxone (MOON) Study [Internet] Boston Medical Center. 2017. [cited 9 March 2017]. Available from: https://www.bmc.org/research/maximizing-opioid-safety-naloxone-moon-study.
-
- Kolodny A, Courtwright DT, Hwang CS, Kreiner P, Eadie JL, Clark TW, Alexander GC. The prescription opioid and heroin crisis: a public health approach to an epidemic of addiction. Annual review of public health. 2015 Mar 18;36:559–74. - PubMed
-
- Duncan DT, Rienti Jr M, Kulldorff M, Aldstadt J, Castro MC, Frounfelker R, Williams JH, Sorensen G, Johnson RM, Hemenway D, Williams DR. Local spatial clustering in youths’ use of tobacco, alcohol, and marijuana in Boston. The American journal of drug and alcohol abuse. 2016 Jul 3;42(4):412–21. - PMC - PubMed
Publication types
MeSH terms
Substances
LinkOut - more resources
Full Text Sources
Medical