. 2018 May 8:2018:1838921.
doi: 10.1155/2018/1838921. eCollection 2018.

Acute Neuroinflammatory Response in the Substantia Nigra Pars Compacta of Rats after a Local Injection of Lipopolysaccharide

Affiliations

Acute Neuroinflammatory Response in the Substantia Nigra Pars Compacta of Rats after a Local Injection of Lipopolysaccharide

Yazmin M Flores-Martinez et al. J Immunol Res. .

Abstract

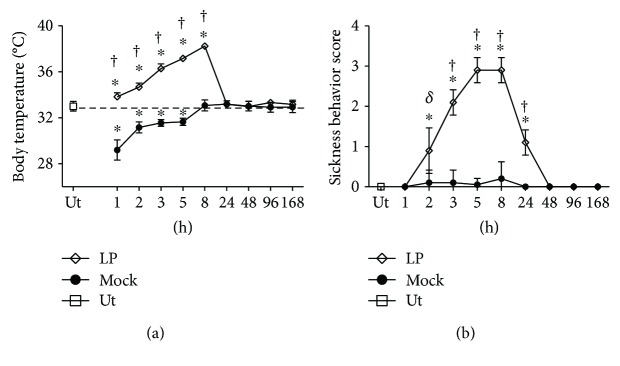
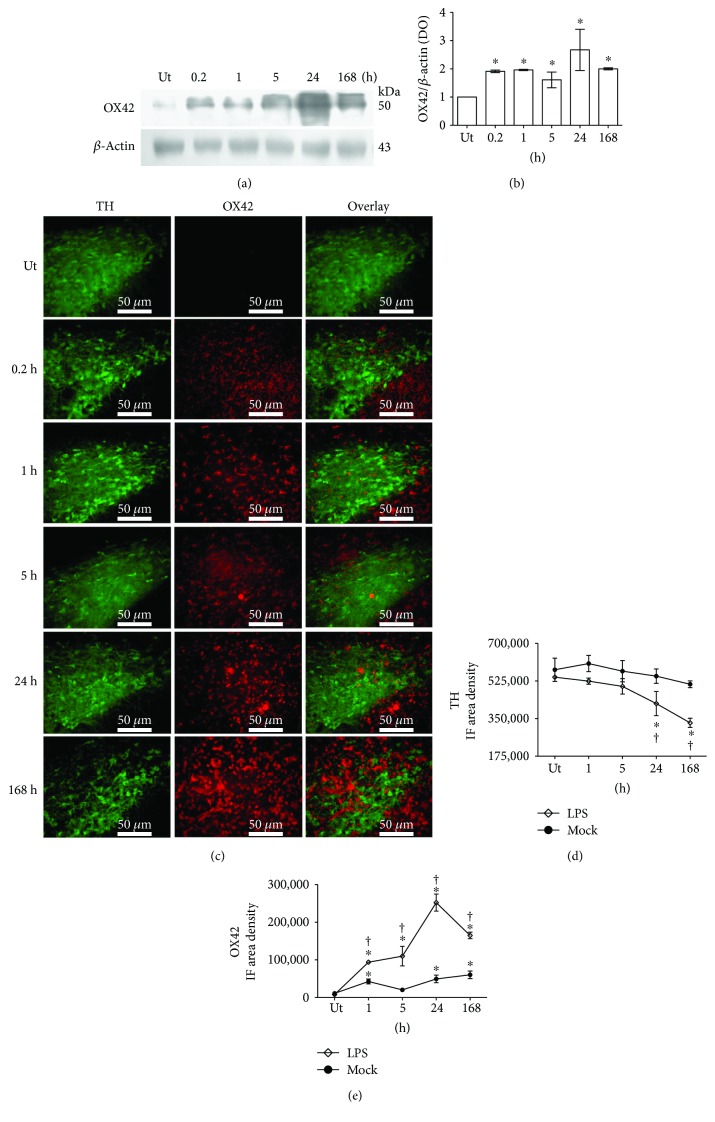
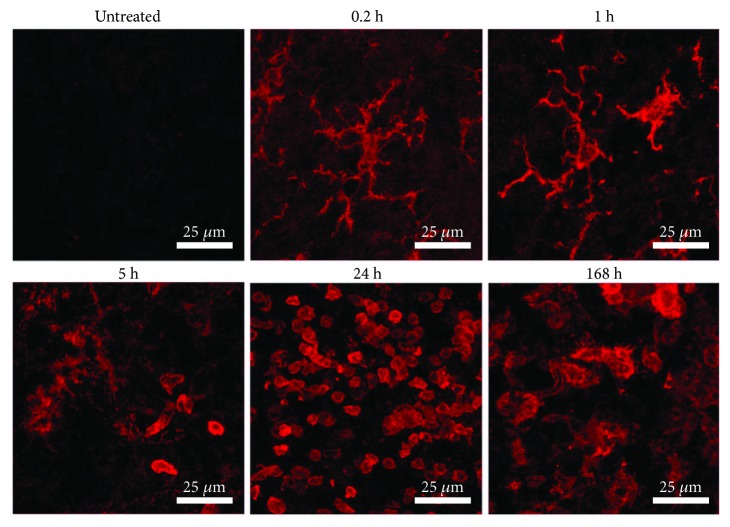
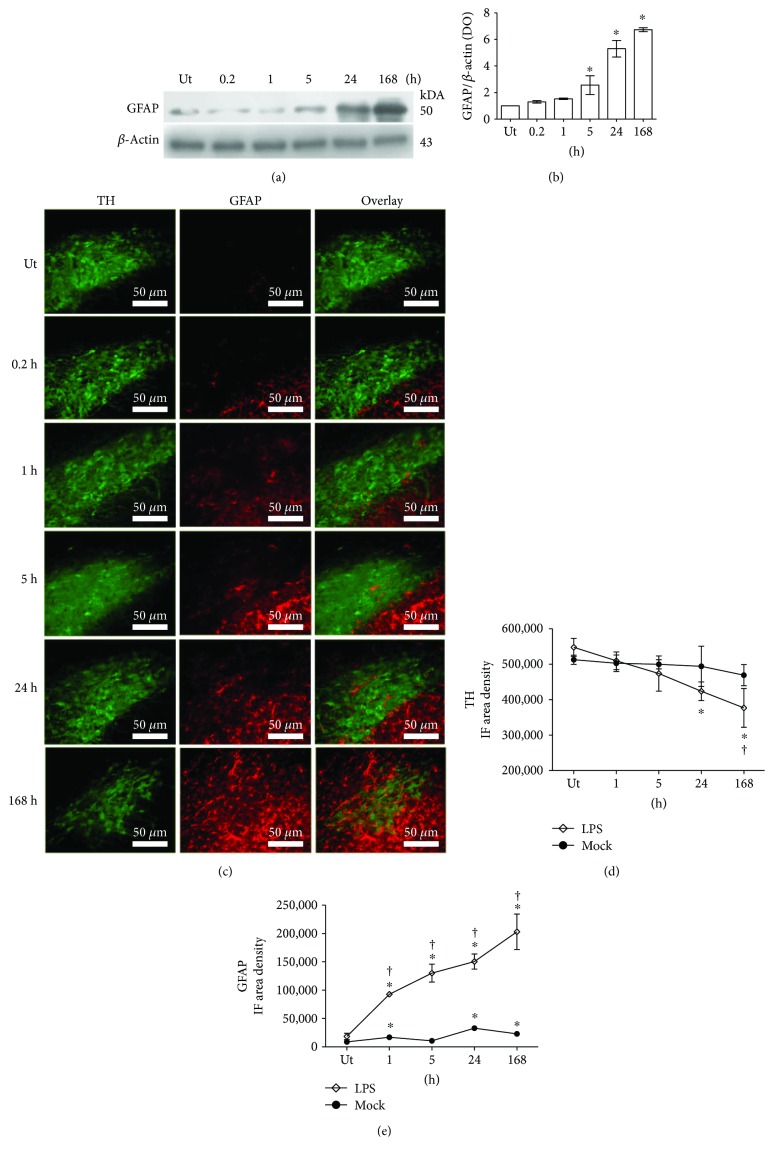
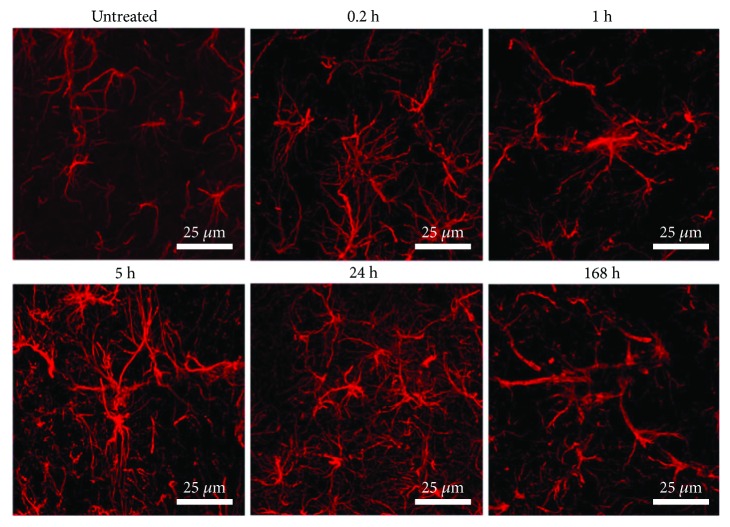
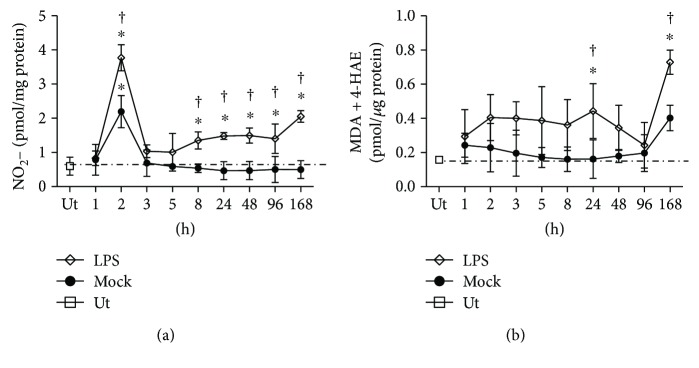
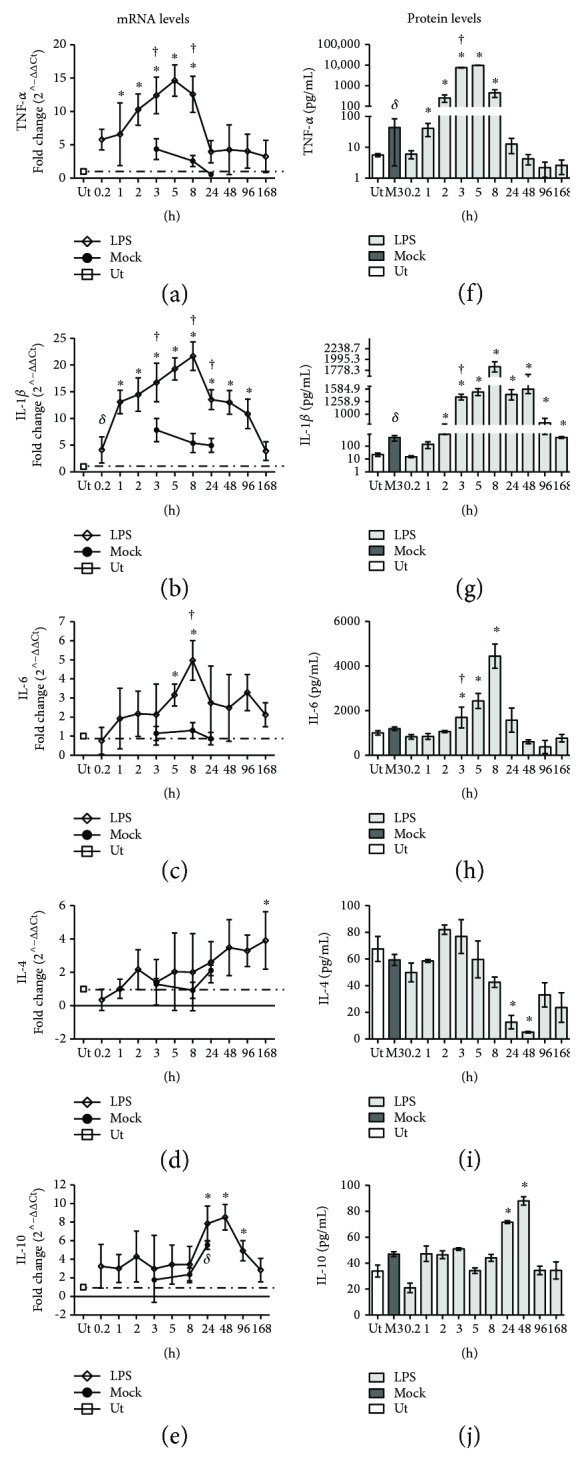
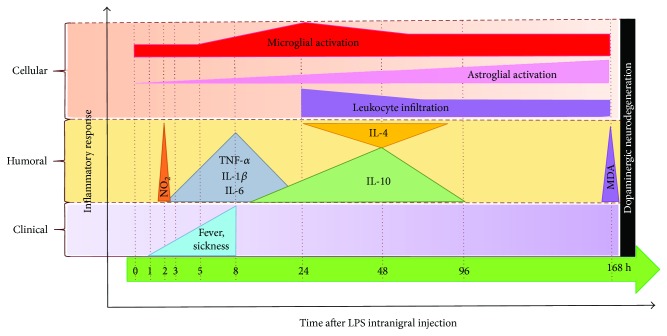
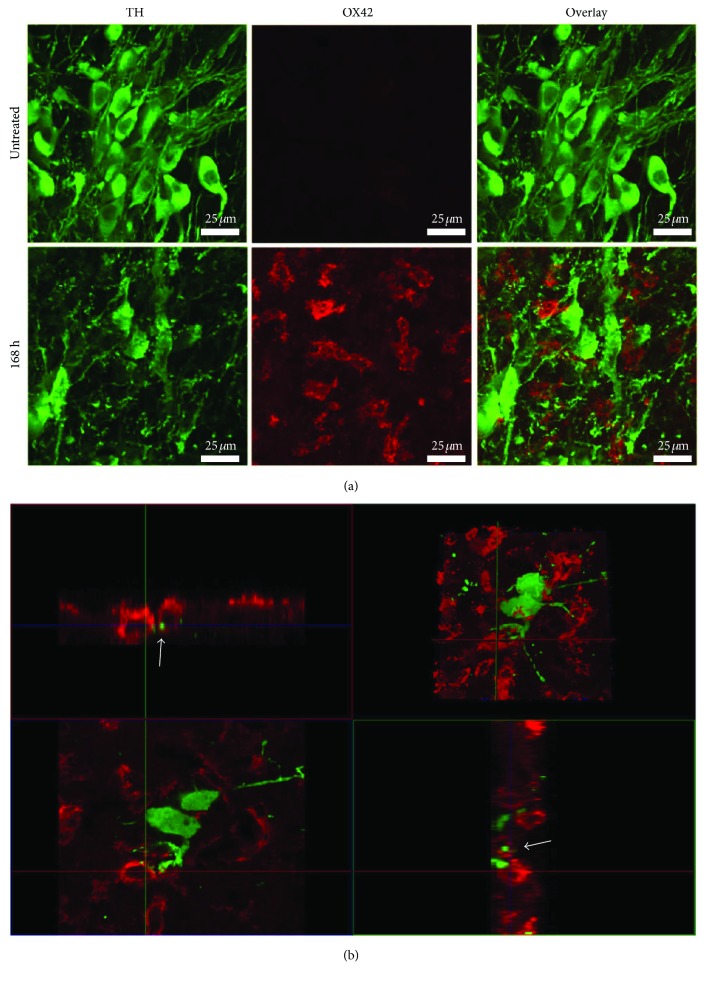
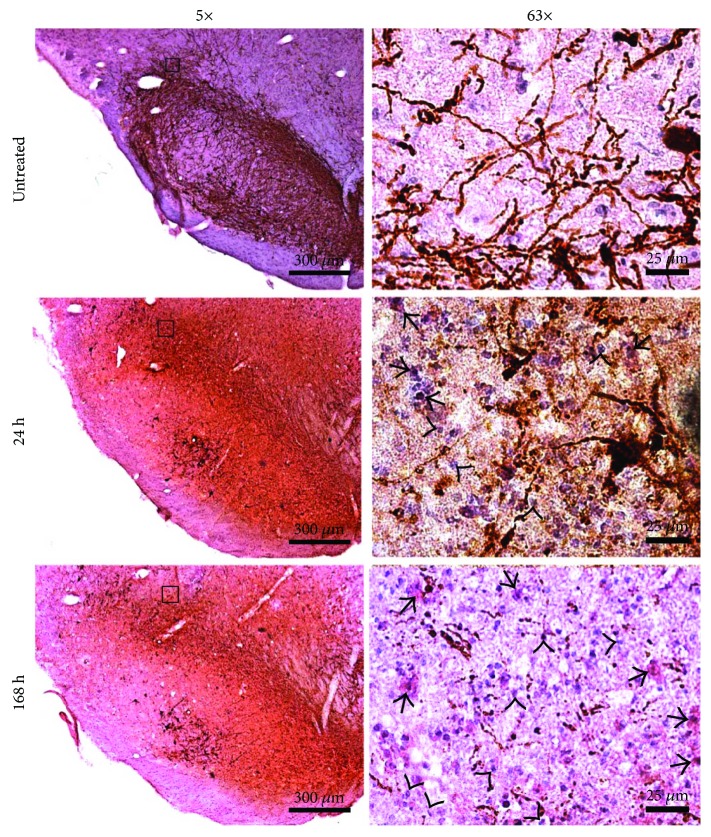
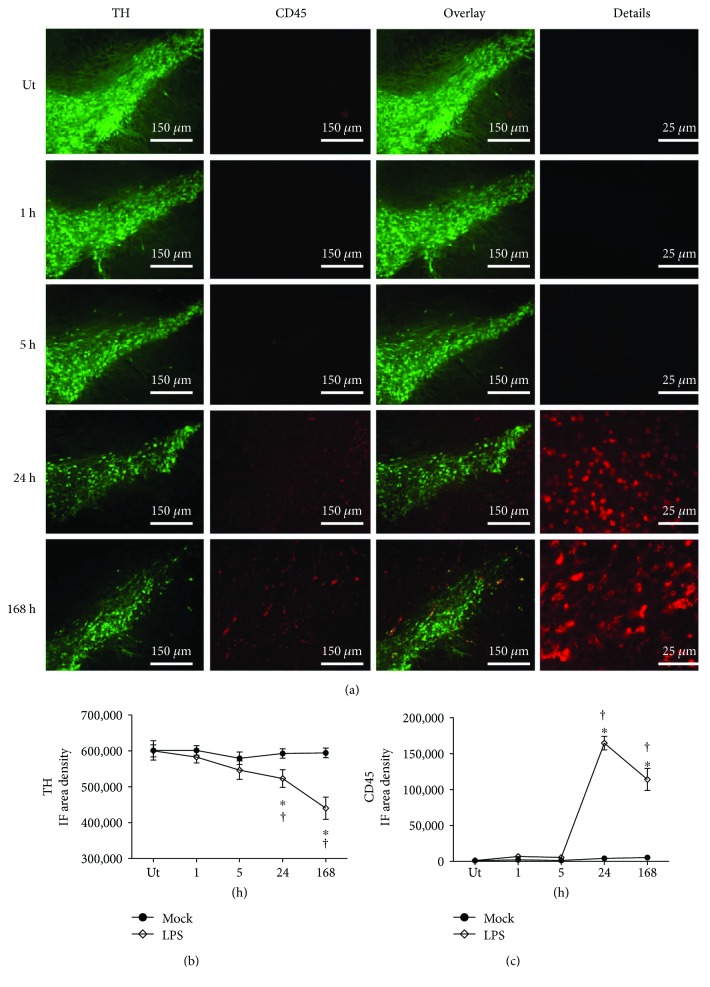
Models of Parkinson's disease with neurotoxins have shown that microglial activation does not evoke a typical inflammatory response in the substantia nigra, questioning whether neuroinflammation leads to neurodegeneration. To address this issue, the archetypal inflammatory stimulus, lipopolysaccharide (LPS), was injected into the rat substantia nigra. LPS induced fever, sickness behavior, and microglial activation (OX42 immunoreactivity), followed by astrocyte activation and leukocyte infiltration (GFAP and CD45 immunoreactivities). During the acute phase of neuroinflammation, pro- and anti-inflammatory cytokines (TNF-α, IL-1β, IL-6, IL-4, and IL-10) responded differentially at mRNA and protein level. Increased NO production and lipid peroxidation occurred at 168 h after LPS injection. At this time, evidence of neurodegeneration could be seen, entailing decreased tyrosine hydroxylase (TH) immunoreactivity, irregular body contour, and prolongation discontinuity of TH+ cells, as well as apparent phagocytosis of TH+ cells by OX42+ cells. Altogether, these results show that LPS evokes a typical inflammatory response in the substantia nigra that is followed by dopaminergic neurodegeneration.


Figures

Figure 1
Figure 1
Clinical evolution after a single injection of LPS in the substantia nigra of the rat. (a) Fever. (b) Sickness behavior. Ut = untreated control rats. Mock = rats injected with the vehicle (2 μL of endotoxin-free physiological saline solution) in the left substantia nigra. All values represent the mean ± SD (n = 45). P < 0.001 when compared with the untreated control group. δ P < 0.05 or P < 0.001 when compared with the respective mock. Repeated-measures two-way ANOVA and Bonferroni post hoc test.
Figure 2
Figure 2
Time course of microglial activation. (a) A representative photograph of a Western blot membrane showing the electrophoretic fractionation of OX42 and β-actin from substantia nigra homogenates of LPS-treated rats and untreated (Ut) control rats. The numbers indicate the time of evaluation. (b) Graph of densitometry analysis showing the normalized values of OX42 bands concerning β-actin bands. The values represent the mean ± SD (n = 3 independent rats in each time of each experimental condition). P < 0.001 when compared with the untreated control group using repeated-measures one-way ANOVA and Newman-Keuls post hoc test. (c) Representative micrographs of the double immunofluorescence of TH and OX42 in the substantia nigra of untreated (Ut) control rats and rats at different times after LPS injection that were taken at 3.8 mm from the interaural midpoint on the dorsal-ventral axes of the rat brain atlas by Paxinos and Watson [50]. The numbers at the left side of micrographs indicate the time of evaluation. Immunofluorescence (IF) area density for TH (d) and OX42 (e) was determined using ImageJ software v.1.46r (National Institutes of Health, Bethesda, MD). The TH and OX42 values for the mock rats correspond to the quantification in Supplementary Figure 1. All values represent the mean ± SD (n = 3 independent rats in each time of each experimental condition). P < 0.001 when compared with the untreated control group of the respective immunostaining. P < 0.001 when compared with the respective mock group. Repeated-measures two-way ANOVA and Bonferroni post hoc test.
Figure 3
Figure 3
Morphological changes during activation of microglia in the substantia nigra after LPS exposure. Representative confocal micrographs of OX42 immunofluorescence in the substantia nigra of untreated control rats and rats at different times after LPS injection.
Figure 4
Figure 4
Time course of astrocyte activation. (a) A representative photograph of a Western blot membrane showing the electrophoretic fractionation of GFAP and β-actin from substantia nigra homogenates of LPS-treated rats and untreated (Ut) control rats. The numbers indicate the time of evaluation. (b) Graph of densitometry analysis showing the normalized values of GFAP bands with respect to β-actin bands. The values represent the mean ± SD (n = 3 independent rats for each time of each experimental condition). P < 0.001 when compared with the untreated control group using repeated-measures one-way ANOVA and Newman-Keuls post hoc test. (c) Representative micrographs of the double immunofluorescence of GFAP and TH in the substantia nigra of untreated (Ut) control rats and rats at different times after LPS injection that were taken at 3.7 mm from the interaural midpoint on the dorsal-ventral axis of the rat brain atlas by Paxinos and Watson [50]. The numbers at the left side of micrographs indicate the time of evaluation. Immunofluorescence (IF) area density for TH (d) and GFAP (e) was determined using ImageJ software v.1.46r (National Institutes of Health, Bethesda, MD). The TH and GFAP values for the mock rats correspond to the quantification in Supplementary Figure 2. All values represent the mean ± SD (n = 3 independent rats in each time and each experimental condition). P < 0.001 when compared with the untreated control group of the respective immunostaining. P < 0.001 when compared with the respective mock group. Repeated-measures two-way ANOVA and Bonferroni post hoc test.
Figure 5
Figure 5
Morphological changes during activation of astrocytes in the substantia nigra after LPS exposure. Representative confocal micrographs of GFAP immunofluorescence in the substantia nigra of untreated control rats and rats at different times after LPS injection.
Figure 6
Figure 6
Nitrosative and oxidative stress in the substantia nigra after LPS local injection. (a) Nitrosative stress was evaluated through the levels of nitrites. (b) Oxidative stress (lipid peroxidation) was evaluated through the levels of malondialdehyde (MDA) + 4-hydroxyalkenals (4-HAE). Ut = untreated control rats. Mock = rats injected with the vehicle (2 μL of endotoxin-free physiological saline solution) in the left substantia nigra. The values represent the mean ± SD from 5 rats for each time and each experimental condition. P < 0.001 when compared with the untreated control group. P < 0.001 when compared with the respective mock group. Repeated-measures one-way ANOVA and Bonferroni post hoc test.
Figure 7
Figure 7
Levels of cytokines in the substantia nigra after LPS local injection. qPCR (a–e) and ELISA (f–j) were used to measure mRNA and protein levels, respectively, for TNF-α, IL-1β, and IL-6 (proinflammatory cytokines) and IL-4 and IL-10 (anti-inflammatory cytokines). Ut = untreated control rats. Mock = rats injected with the vehicle (2 μL of endotoxin-free physiological saline solution) in the left substantia nigra. All values represent the mean ± SD (n = 4 independent rats in each time of each experimental condition). δ P < 0.05 or P < 0.001 when compared with the untreated control group. P < 0.001 when compared with the respective mock group. Repeated-measures one-way ANOVA and Newman-Keuls post hoc test for ELISA and repeated-measures two-way ANOVA and Bonferroni post hoc test for the qPCR assay.
Figure 8
Figure 8
Schematic summary of LPS-induced acute neuroinflammation in the substantia nigra of the rat.
Figure 9
Figure 9
Apparent phagocytosis of damaged dopaminergic neurons by microglia. Representative confocal micrographs of TH and OX42 double immunofluorescence. (a) Integrated projections from x-y optical stacks. (b) Orthogonal projections from a 1 μm z-confocal optical section. The arrows show a green fluorescence dot (TH immunoreactivity) surrounded by a red fluorescence ring (OX42). The right top panel corresponds to the integrated image where the orthogonal analysis was performed.
Figure 10
Figure 10
Leukocyte infiltration. Representative micrographs showing the H&E staining and TH immunohistochemistry of the substantia nigra of untreated control rats and experimental rats at 24 and 168 h after LPS injection. The micrographs were taken at 3.2 mm from the interaural midpoint on the dorsal-ventral axis of the rat brain atlas by Paxinos and Watson [50]. The black square on 5x micrographs indicates the area where 63x amplification was taken. Arrowheads indicate leukocyte infiltration, and arrows indicate microglia/macrophages.
Figure 11
Figure 11
Time course of leucocyte infiltration. (a) Representative micrographs of the double immunofluorescence of CD45 and TH in the substantia nigra of untreated (Ut) control rats and rats at different times after LPS injection that were taken at 3.4 mm from the interaural midpoint on the dorsal-ventral axis of the rat brain atlas by Paxinos and Watson [50]. The numbers at the left side of micrographs indicate the time of evaluation. Immunofluorescence (IF) area density for TH (b) and CD45 (c) was determined using ImageJ software v.1.46r (National Institutes of Health, Bethesda, MD). The TH and CD45 values for the mock rats correspond to the quantification in Supplementary Figure 3. All values represent the mean ± SD (n = 3 rats for each time and for each experimental condition). P < 0.001 when compared with the untreated control group of the respective immunostaining. P < 0.001 when compared with the respective mock group. Repeated-measures two-way ANOVA and Bonferroni post hoc test.

References

    1. Wilms H., Zecca L., Rosenstiel P., Sievers J., Deuschl G., Lucius R. Inflammation in Parkinson’s diseases and other neurodegenerative diseases: cause and therapeutic implications. 2007;13(18):1925–1928. doi: 10.2174/138161207780858429. - DOI - PubMed
    1. McGeer P. L., Itagaki S., Boyes B. E., McGeer E. G. Reactive microglia are positive for HLA-DR in the substantia nigra of Parkinson’s and Alzheimer’s disease brains. 1988;38(8):1285–1291. doi: 10.1212/WNL.38.8.1285. - DOI - PubMed
    1. McGeer P. L., McGeer E. G. Glial reactions in Parkinson’s disease. 2008;23(4):474–483. doi: 10.1002/mds.21751. - DOI - PubMed
    1. McGeer P. L., Schwab C., Parent A., Doudet D. Presence of reactive microglia in monkey substantia nigra years after 1-methyl-4-phenyl-1,2,3,6-tetrahydropyridine administration. 2003;54(5):599–604. doi: 10.1002/ana.10728. - DOI - PubMed
    1. Nadella R., Voutilainen M. H., Saarma M., et al. Transient transfection of human CDNF gene reduces the 6-hydroxydopamine-induced neuroinflammation in the rat substantia nigra. 2014;11(1):p. 209. doi: 10.1186/s12974-014-0209-0. - DOI - PMC - PubMed

MeSH terms