Review
. 2017 Nov 21;3(3):542-554.
doi: 10.1016/j.ekir.2017.11.009. eCollection 2018 May.

Glycated Albumin Versus HbA1c in the Evaluation of Glycemic Control in Patients With Diabetes and CKD

Affiliations
Review

Glycated Albumin Versus HbA1c in the Evaluation of Glycemic Control in Patients With Diabetes and CKD

Ting Gan et al. Kidney Int Rep. .

Abstract

Introduction: It is inaccurate to assess blood glucose with glycated hemoglobin (HbA1c) in patients with diabetes and chronic kidney disease (CKD), and whether glycated albumin (GA) is better than HbA1c in these patients remains unclear.

Methods: We searched PubMed, Embase, Web of Science, Scopus, the Cochrane Library, and MEDLINE to July 2017 for studies that investigated the correlation between GA or HbA1c and the average glucose levels (AG) relevant to this theme. Statistical analysis was performed using RevMan5.3 and Stata12.0. The outcome was the correlation coefficient between GA or HbA1c and AG. For the first time, we made a comparison of GA and HbA1c in different CKD stages.

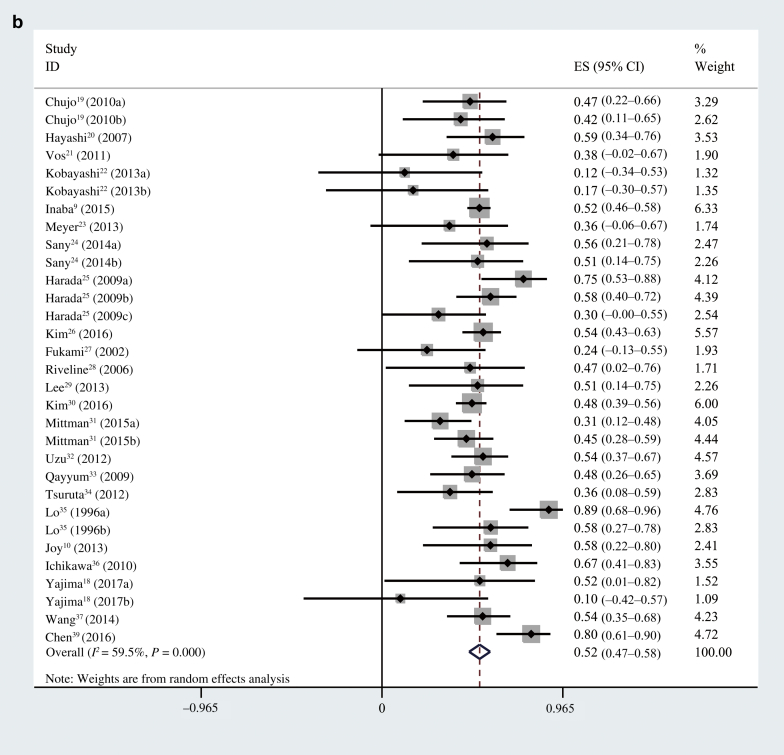
Results: A total of 24 studies with 3928 patients were included. Early stages of CKD refer to CKD stage 1 to 3. Advanced CKD refer to CKD stage 4 and 5 including patients receiving dialysis. The meta-analysis suggested that in early stages of CKD, the pooled R between GA and AG was 0.61 (95% CI = 0.49-0.73) and 0.71 (95% CI = 0.55-0.87) for HbA1c (P > 0.05). In advanced CKD patients, the pooled R between GA and AG was 0.57 (95% CI = 0.52-0.62), and 0.49 (95% CI = 0.45-0.52) for HbA1c (P = 0.0001).

Conclusion: GA is superior to HbA1c in assessing blood glucose control in diabetes patients with advanced CKD.

Keywords: HbA1c; chronic kidney disease; diabetes mellitus; glycated albumin.


Figures

Figure 1
Figure 1
Preferred Reporting Items for Systematic Reviews and Meta-Analyses (PRISMA) flow diagram of identification process for eligible articles. CKD, chronic kidney disease.
Figure 2
Figure 2
(a) Pooled R between glycated albumin and average glucose levels in all of the patients. (b) Pooled R between HbA1c and average glucose levels in all of the patients. CI, confidence interval; ES, effect size.
Figure 2
Figure 2
(a) Pooled R between glycated albumin and average glucose levels in all of the patients. (b) Pooled R between HbA1c and average glucose levels in all of the patients. CI, confidence interval; ES, effect size.
Figure 3
Figure 3
(a) Pooled R between glycated albumin and average glucose levels after 1 study was excluded. (b) Pooled R between HbA1c and average glucose levels after 1 study was excluded. CI, confidence interval; ES, effect size.
Figure 3
Figure 3
(a) Pooled R between glycated albumin and average glucose levels after 1 study was excluded. (b) Pooled R between HbA1c and average glucose levels after 1 study was excluded. CI, confidence interval; ES, effect size.
Figure 4
Figure 4
(a) Pooled R between glycated albumin and average glucose levels in patients with different chronic kidney disease (CKD) status. (b) Pooled R between HbA1c and average glucose levels in patients with different CKD status. CI, confidence interval; ES, effect size.
Figure 4
Figure 4
(a) Pooled R between glycated albumin and average glucose levels in patients with different chronic kidney disease (CKD) status. (b) Pooled R between HbA1c and average glucose levels in patients with different CKD status. CI, confidence interval; ES, effect size.
Figure 5
Figure 5
Publication bias of Egger and Begg test funnel plots.
Figure S1
Figure S1
(A) Sensitivity analysis of the pooled R between HbA1c and average glucose levels in early and advanced stages of CKD. (B) Sensitivity analysis of the pooled R between glycated albumin and average glucose levels in early and advanced stages of CKD.
Figure S1
Figure S1
(A) Sensitivity analysis of the pooled R between HbA1c and average glucose levels in early and advanced stages of CKD. (B) Sensitivity analysis of the pooled R between glycated albumin and average glucose levels in early and advanced stages of CKD.
Figure S2
Figure S2
(A) The joint analysis comparing the correlations of glycated albumin and HbA1c. (B) Sensitivity analysis of the joint analysis comparing the correlations of glycated albumin and HbA1c.
Figure S2
Figure S2
(A) The joint analysis comparing the correlations of glycated albumin and HbA1c. (B) Sensitivity analysis of the joint analysis comparing the correlations of glycated albumin and HbA1c.
Figure S3
Figure S3
Meta-regression based on the different assays for the measurement of glycated albumin.
Figure S4
Figure S4
The result of the trim and fill method.

References

    1. Kovesdy C.P., Sharma K., Kalantar-Zadeh K. Glycemic control in diabetic CKD patients: where do we stand? Am J Kidney Dis. 2008;52:766–777. - PubMed
    1. Kovesdy C.P., Kalantar-Zadeh K. Enter the dragon: a Chinese epidemic of chronic kidney disease? Lancet. 2012;379:783–785. - PubMed
    1. National Kidney Foundation KDOQI Clinical Practice Guideline for Diabetes and CKD: 2012 Update. Am J Kidney Dis. 2012;60:850–886. - PubMed
    1. Kawazu S., Tomono S., Shimizu M. The relationship between early diabetic nephropathy and control of plasma glucose in non-insulin-dependent diabetes mellitus. The effect of glycemic control on the development and progression of diabetic nephropathy in an 8-year follow-up study. J Diabetes Complications. 1994;8:13–17. - PubMed
    1. Hovind P., Rossing P., Tarnow L. Progression of diabetic nephropathy. Kidney Int. 2001;59:702–709. - PubMed

LinkOut - more resources