. 2018 May 31;19(1):70.
doi: 10.1186/s13059-018-1438-9.

UMI-count modeling and differential expression analysis for single-cell RNA sequencing

Affiliations

UMI-count modeling and differential expression analysis for single-cell RNA sequencing

Wenan Chen et al. Genome Biol. .

Abstract

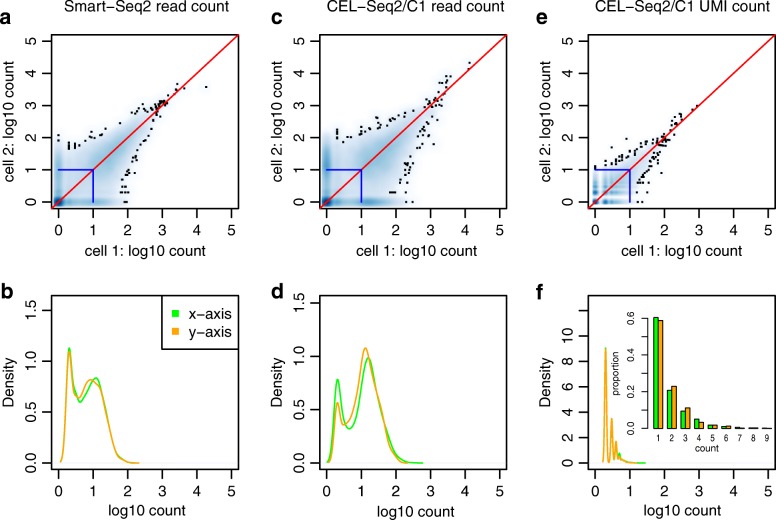
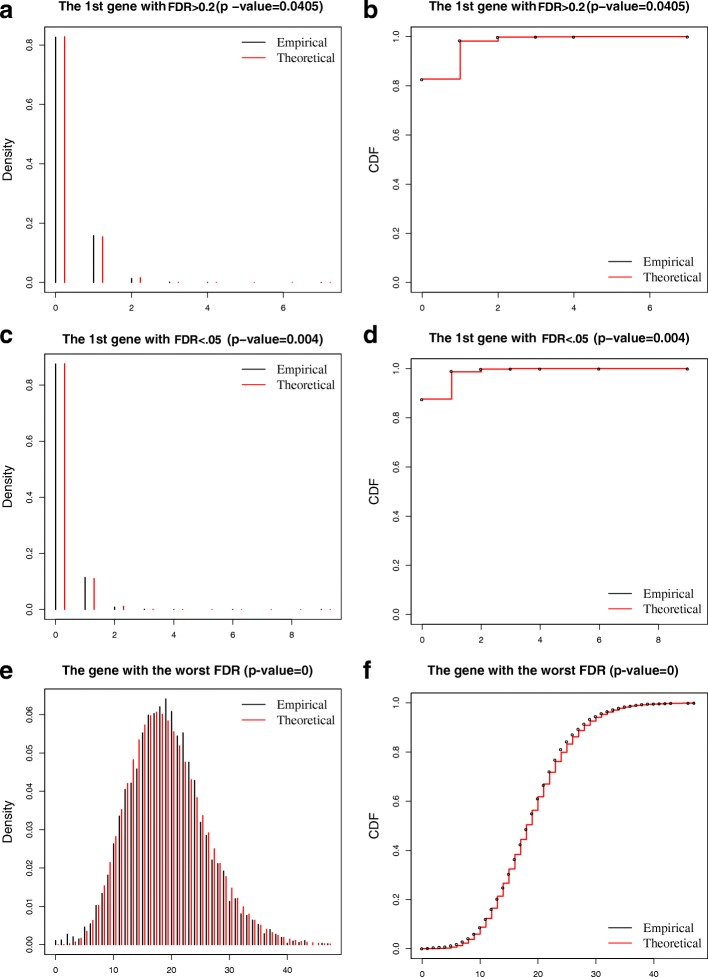
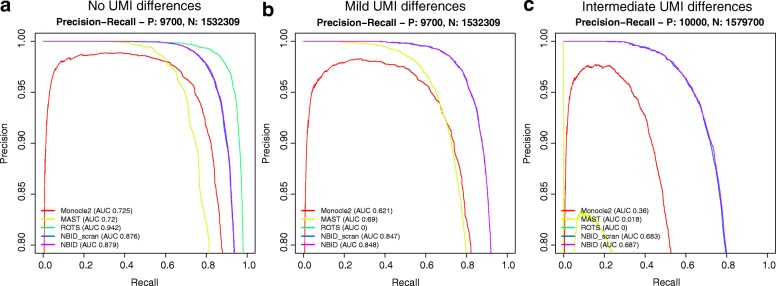
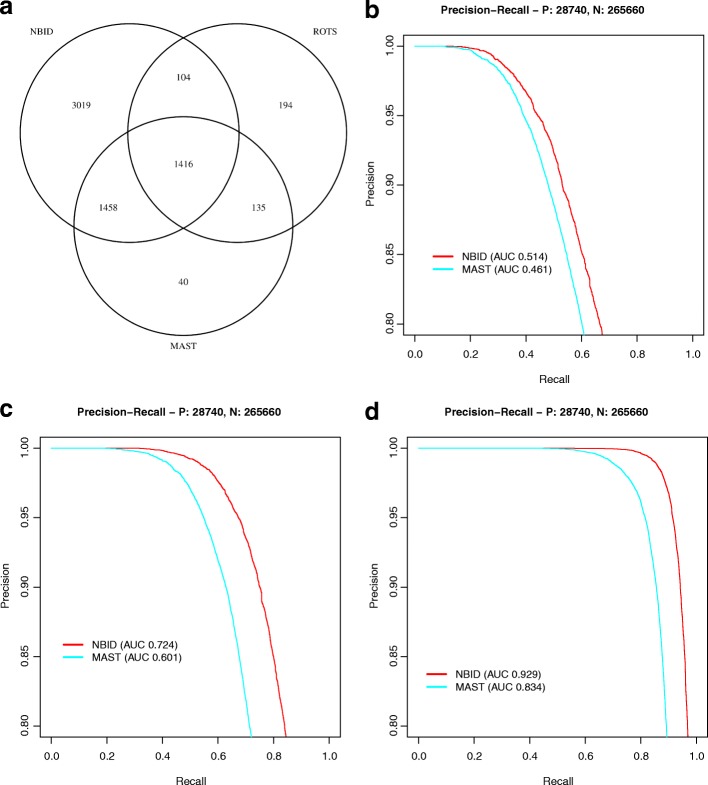
Read counting and unique molecular identifier (UMI) counting are the principal gene expression quantification schemes used in single-cell RNA-sequencing (scRNA-seq) analysis. By using multiple scRNA-seq datasets, we reveal distinct distribution differences between these schemes and conclude that the negative binomial model is a good approximation for UMI counts, even in heterogeneous populations. We further propose a novel differential expression analysis algorithm based on a negative binomial model with independent dispersions in each group (NBID). Our results show that this properly controls the FDR and achieves better power for UMI counts when compared to other recently developed packages for scRNA-seq analysis.

Keywords: Differential expression analysis; Negative binomial; Unique molecular identifier.


Conflict of interest statement

Ethics approval and consent to participate

Not applicable.

Competing interests

The authors declare that they have no competing interests.

Publisher’s Note

Springer Nature remains neutral with regard to jurisdictional claims in published maps and institutional affiliations.

Figures

Fig. 1
Fig. 1
Scatter plots of two cells with similar read counts or UMI counts. a, b Read counts for Smart−Seq2. c, d Read counts for CEL − Seq2/C1. e, f UMI counts for CEL − Seq2/C1. a, c, e The scatter plot with color-coded density, the highest density at the origin. The left and middle panels, which are based on the read counts, show very different patterns from the right panel, which is based on the UMI counts. b, d, f The density plot along the x- and y-axes of (a), (c), and (e), excluding the origin. For all plots, we kept the genes that were detected in at least five cells among all cells
Fig. 2
Fig. 2
Goodness of fit using the negative binomial distribution on the naïve T-cell data (Tn). a The empirical and theoretical probability mass function (pmf) for the first gene with FDR > 0.2. b The empirical and theoretical cumulative distribution function (cdf) for the first gene with FDR > 0.2. c, d The same pmf and cdf plots for the first gene with FDR < 0.05. e, f The same pmf and cdf plots for the gene with the worst FDR
Fig. 3
Fig. 3
Precision-recall curves for selected methods. a The precision-recall curve without UMI differences between two groups. b The precision-recall curve with mild UMI differences between two groups. c The precision-recall curve with intermediate UMI differences between two groups. For each scenario, some methods failed to run on few replicates but at least 97 replicates were used to calculate the precision and recall rate. P true DE genes, N true non-DE genes
Fig. 4
Fig. 4
Comparison of detected genes in naïve T cells and memory T cells. a The Venn diagram of DE genes detected by NBID, ROTS, and MAST. b The precision-recall curves obtained using a subset of 1000 cells of each cell type. For the power calculation, we chose the DE genes detected in both NBID and MAST as the true DE genes and the genes not detected as DE genes in either NBID or MAST as the true non-DE genes. c, d The same as (b) except using subsets of 2000 and 5000 cells, respectively
Fig. 5
Fig. 5
Differential expression of CD44 in two clusters in the Rh41 cell line. a Violin plot of the gene expression among cells in the two clusters, the TPM is in log10 scale after adding a small value 1. b The CD44 count distribution when using CD44 to sort single cells, indicating two clusters of cells with different levels of CD44 expression
Fig. 6
Fig. 6
Differential expression analysis of two replicates from Ziegenhain et al. [12]. ad The log2 fold change vs the maximal gene log10TPM for the two biological replicates. NBID was used for the differential expression analysis of two replicates of each of four UMI-based protocols. The red dots indicate genes with FDR < 0.05. e Venn diagram of DE genes from four UMI-based protocols
Fig. 7
Fig. 7
Precision-recall curves for selected methods on simulated datasets after adjusting batch variables. P true DE genes, N true non-DE genes

References

    1. Liu S, Trapnell C. Single-cell transcriptome sequencing: recent advances and remaining challenges [version 1; referees: 2 approved]. 2016;5(F1000 Faculty Rev):182. 10.12688/f1000research.7223.1. - PMC - PubMed
    1. Svensson V, Natarajan KN, Ly LH, Miragaia RJ, Labalette C, Macaulay IC, et al. Power analysis of single-cell RNA-sequencing experiments. Nat Methods. 2017;14:381–387. doi: 10.1038/nmeth.4220. - DOI - PMC - PubMed
    1. Grun D, Kester L, van Oudenaarden A. Validation of noise models for single-cell transcriptomics. Nat Methods. 2014;11:637–640. doi: 10.1038/nmeth.2930. - DOI - PubMed
    1. Marinov GK, Williams BA, McCue K, Schroth GP, Gertz J, Myers RM, et al. From single-cell to cell-pool transcriptomes: stochasticity in gene expression and RNA splicing. Genome Res. 2014;24:496–510. doi: 10.1101/gr.161034.113. - DOI - PMC - PubMed
    1. Kharchenko PV, Silberstein L, Scadden DT. Bayesian approach to single-cell differential expression analysis. Nat Methods. 2014;11:740–742. doi: 10.1038/nmeth.2967. - DOI - PMC - PubMed

Publication types