

Relative contributions of preprandial and postprandial glucose exposures, glycemic variability, and non-glycemic factors to HbA 1c in individuals with and without diabetes
- PMID: 29855488
- PMCID: PMC5981454
- DOI: 10.1038/s41387-018-0047-8
Relative contributions of preprandial and postprandial glucose exposures, glycemic variability, and non-glycemic factors to HbA 1c in individuals with and without diabetes
Abstract
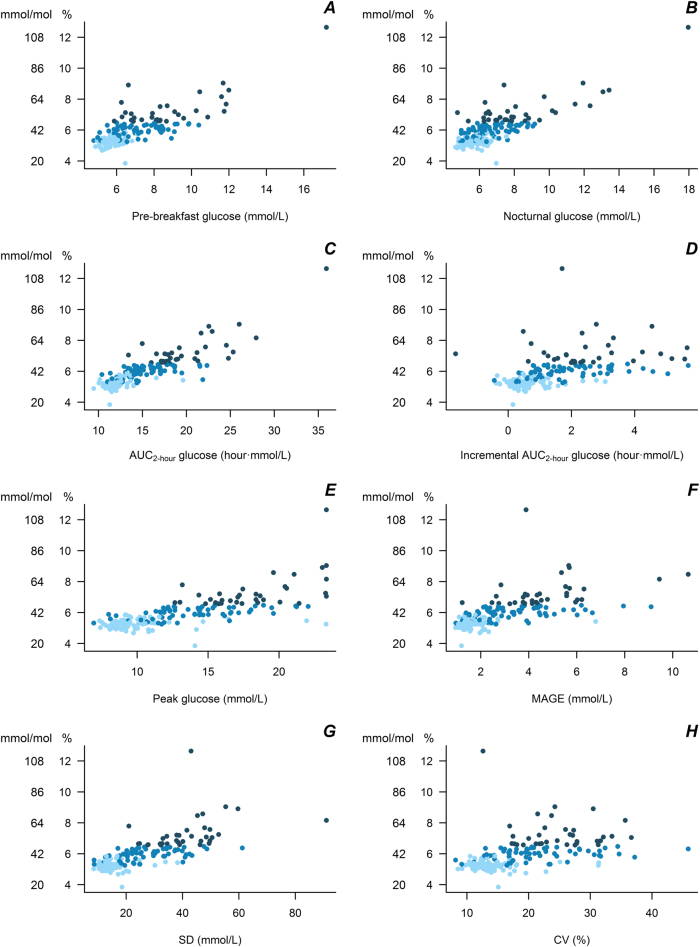
Background/objective: There is substantial interest in dietary approaches to reducing postprandial glucose (PPG) responses, but the quantitative contribution of PPG to longer-term glycemic control (reflected in glycated hemoglobin, HbA1c) in the general population is not known. This study quantified the associations of preprandial glucose exposure, PPG exposure, and glycemic variability with HbA1c and estimated the explained variance in HbA1c in individuals with and without type 2 diabetes (T2D).
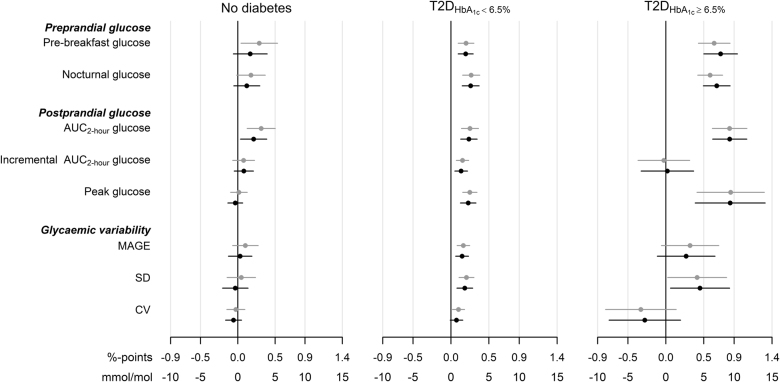
Subjects/methods: Participants in the A1c-Derived Average Glucose (ADAG) study without T2D (n = 77) or with non-insulin-treated T2D and HbA1c<6.5% (T2DHbA1c < 6.5%, n = 63) or HbA1c ≥ 6.5% (T2DHbA1c ≥ 6.5%, n = 34) were included in this analysis. Indices of preprandial glucose, PPG, and glycemic variability were calculated from continuous glucose monitoring during four periods over 12 weeks prior to HbA1c measurement. In linear regression models, we estimated the associations of the glycemic exposures with HbA1c and calculated the proportion of variance in HbA1c explained by glycemic and non-glycemic factors (age, sex, body mass index, and ethnicity).
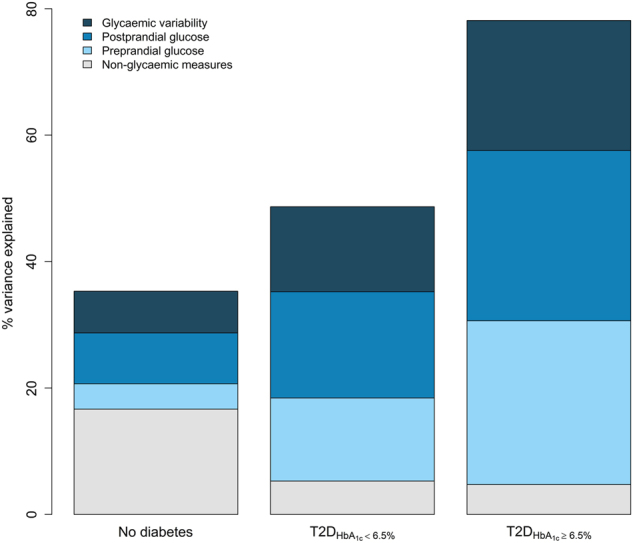
Results: The factors in the analysis explained 35% of the variance in HbA1c in non-diabetic individuals, 49% in T2DHbA1c < 6.5%, and 78% in T2DHbA1c ≥ 6.5%. In non-diabetic individuals PPG exposure was associated with HbA1c in confounder-adjusted analyses (P < 0.05). In the T2DHbA1c < 6.5% group, all glycemic measures were associated with HbA1c (P < 0.05); preprandial glucose and PPG accounted for 14 and 18%, respectively, of the explained variation. In T2DHbA1c ≥ 6.5%, these glycemic exposures accounted for more than 50% of the variation in HbA1c and with equal relative contributions.
Conclusions: Among the glycemic exposures, PPG exposure was most strongly predictive of HbA1c in non-diabetic individuals, suggesting that interventions targeting lowering of the PPG response may be beneficial for long-term glycemic maintenance. In T2D, preprandial glucose and PPG exposure contributed equally to HbA1c.
Conflict of interest statement
K.F., R.B. and D.V. declare no conflicts of interest. D.J.M. and M.A. are employed by Unilever, which manufactures and sells commercial food products.
Figures
References
Publication types
MeSH terms
Substances
LinkOut - more resources
Full Text Sources
Other Literature Sources
Medical
Miscellaneous
