. 2018 May 31;8(1):8451.
doi: 10.1038/s41598-018-26779-6.

Input-dependent modulation of MEG gamma oscillations reflects gain control in the visual cortex

Affiliations

Input-dependent modulation of MEG gamma oscillations reflects gain control in the visual cortex

Elena V Orekhova et al. Sci Rep. .

Abstract

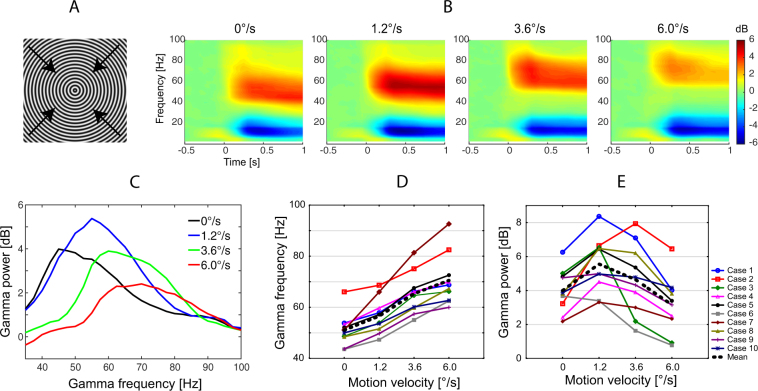
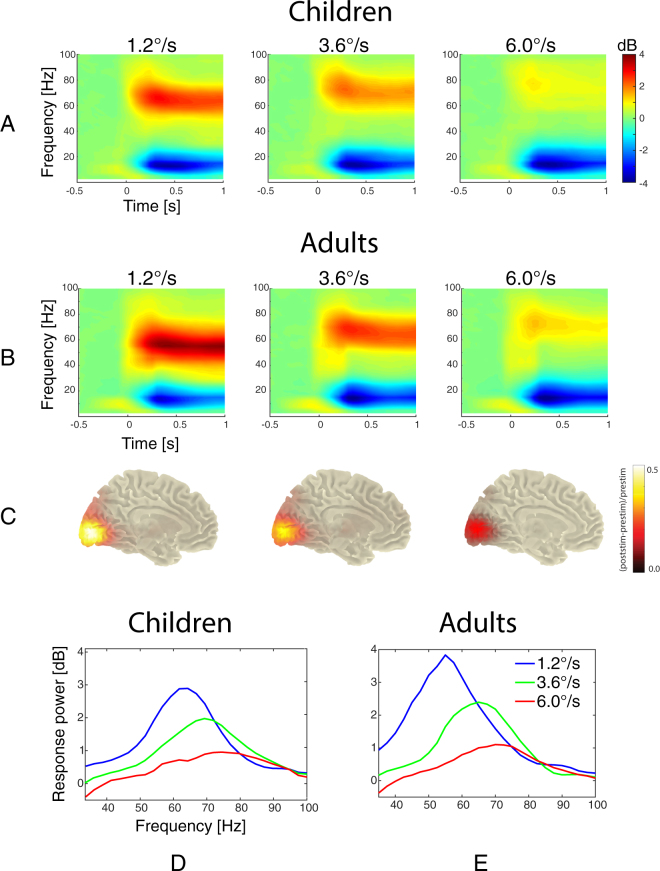
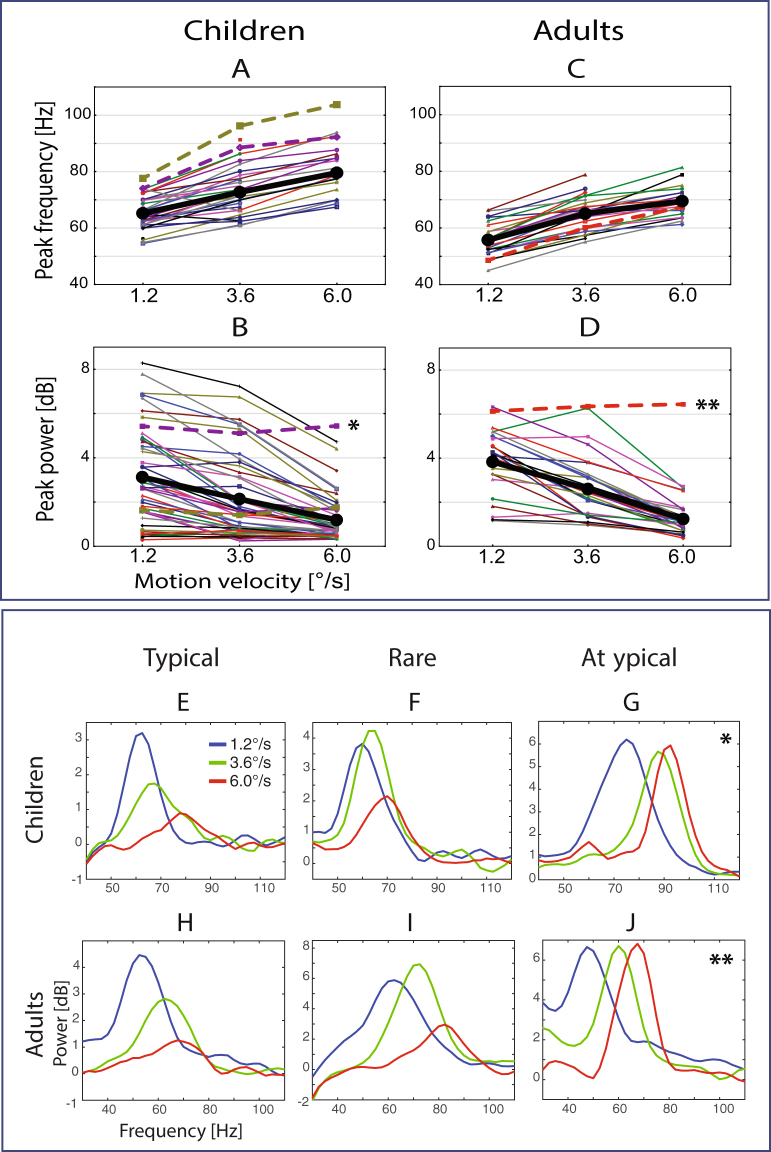
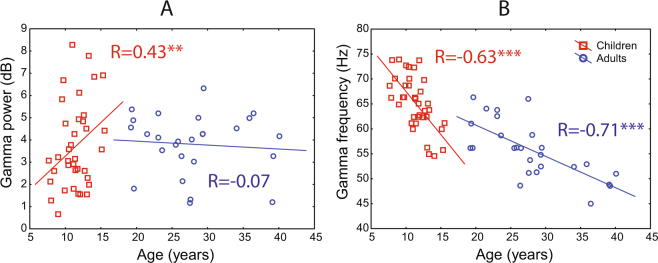
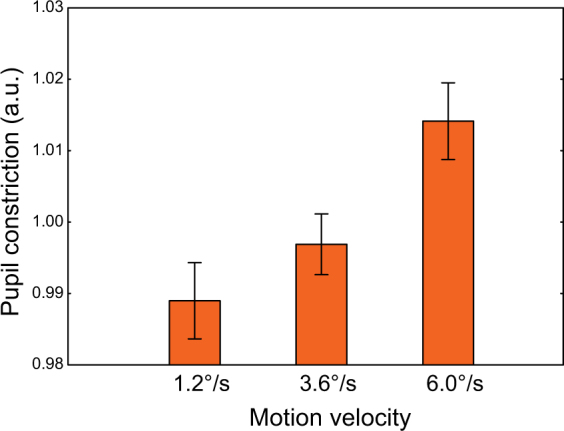
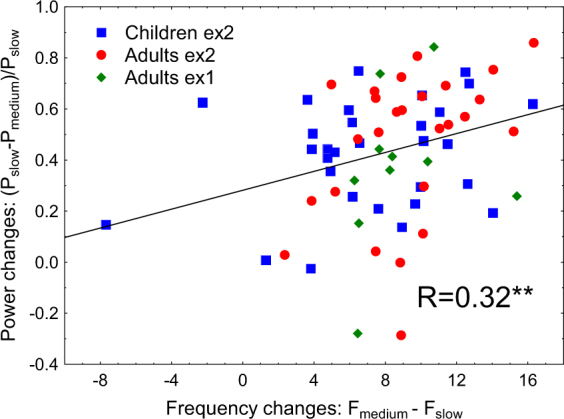
Gamma-band oscillations arise from the interplay between neural excitation (E) and inhibition (I) and may provide a non-invasive window into the state of cortical circuitry. A bell-shaped modulation of gamma response power by increasing the intensity of sensory input was observed in animals and is thought to reflect neural gain control. Here we sought to find a similar input-output relationship in humans with MEG via modulating the intensity of a visual stimulation by changing the velocity/temporal-frequency of visual motion. In the first experiment, adult participants observed static and moving gratings. The frequency of the MEG gamma response monotonically increased with motion velocity whereas power followed a bell-shape. In the second experiment, on a large group of children and adults, we found that despite drastic developmental changes in frequency and power of gamma oscillations, the relative suppression at high motion velocities was scaled to the same range of values across the life-span. In light of animal and modeling studies, the modulation of gamma power and frequency at high stimulation intensities characterizes the capacity of inhibitory neurons to counterbalance increasing excitation in visual networks. Gamma suppression may thus provide a non-invasive measure of inhibitory-based gain control in the healthy and diseased brain.


Conflict of interest statement

The authors declare no competing interests.

Figures

Figure 1
Figure 1
Changes in gamma power and frequency induced by the visual presentation of the annular gratings. The grating displayed in panel A either remained static (0°/s) or drifted at one of the three velocities (1.2°/s, 3.6°/s or 6.0°/s) in the direction indicated by the arrows. (B) Grand average time-frequency plots. (C) Grand average spectra of sustained gamma response. Gamma power was computed in the 200–1200 ms time interval after stimulus onset and was normalized to the pre-stimulus baseline (−900 to 0 ms). (D,E) Individual peak frequency (D) and power (E) of sustained gamma responses. Here and hereafter, the frequency range of interest was established where the post-/pre-stimulus power ratio exceeded 2/3 of the peak value. The center of gravity of the power over this frequency range was used as the gamma peak frequency. The average power over these frequencies was used as the gamma peak power (see Material and Methods for details).
Figure 2
Figure 2
Gamma signals induced by visual presentation of annular gratings drifting at slow, medium, and fast velocities in children and adults. The two upper rows present grand averaged time-frequency plots for the ‘maximal pair’ of gradiometers in children (A) and adults (B). Source localization with DICS beamformer (C) is based on the adults’ data. A transparency factor was applied to mask values that are close to zero. The bottom row is grand averaged spectra of gamma responses for children (D) are adults (E).
Figure 3
Figure 3
Individual variability of gamma response parameters. (AD) Individual gamma peak frequency and power values under the three velocity conditions in children and adults. Thick black lines show group mean values. Dashed lines refer to the subjects (2 children, 1 adult) with an atypical lack of gamma suppression at the highest velocity. (EJ) Power spectra of representative subjects. (E,H) Typical examples of gamma suppression with increasing motion velocity observed in children and adults. (F,I) Rare variants of gamma response with an initial increase in gamma power at the medium velocity followed by power suppression at the fast one. (G,J) An atypical absence of gamma suppression at the fast stimulus velocity. The subjects with atypical gamma responses displayed in (G,J) are marked by asterisks in panels B and D. See text for details.
Figure 4
Figure 4
Developmental changes of gamma response power (A) and frequency (B) in children and adults under the ‘slow’ velocity condition. (Spearman correlations, **p < 0.01; ***p < 0.0001).
Figure 5
Figure 5
Pupillary constriction response to the annular gratings moving at the three velocities. Vertical bars denote 95% confidence intervals. The pupil constriction values were weighted by dividing them by the average over the three conditions for each subject.
Figure 6
Figure 6
The relationship between changes in gamma frequency and normalized changes in gamma power induced by transition from the slow to the medium stimulus velocity. The regression line corresponds to the whole sample analysis; the color and shape of the individual values represent the respective experimental groups. Spearman correlation for the whole sample: **p < 0.01.

Similar articles

Cited by

References

    1. Vinck, M., Womelsdorf, T. & Fries, P. Gamma-band synchronization and information transmission. in Principles of Neural Coding (eds Quiroga R. Q. & Panzeri S.) 449–469 (CRC Press, 2013).
    1. Lee E, Lee J, Kim E. Excitation/Inhibition Imbalance in Animal Models of Autism Spectrum Disorders. Biol Psychiat. 2017;81:838–847. doi: 10.1016/j.biopsych.2016.05.011. - DOI - PubMed
    1. Levin AR, Nelson CA. Inhibition-Based Biomarkers for Autism Spectrum Disorder. Neurotherapeutics. 2015;12:546–552. doi: 10.1007/s13311-015-0350-1. - DOI - PMC - PubMed
    1. Rojas DC, Wilson L. B. gamma-band abnormalities as markers of autism spectrum disorders. Biomark Med. 2014;8:353–368. doi: 10.2217/bmm.14.15. - DOI - PMC - PubMed
    1. Uhlhaas PJ, Singer W. Abnormal neural oscillations and synchrony in schizophrenia. Nat Rev Neurosci. 2010;11:100–113. doi: 10.1038/nrn2774. - DOI - PubMed

Publication types

LinkOut - more resources