. 2018 Jun 1;14(6):e1007405.
doi: 10.1371/journal.pgen.1007405. eCollection 2018 Jun.

Non-equilibrium repressor binding kinetics link DNA damage dose to transcriptional timing within the SOS gene network

Affiliations

Non-equilibrium repressor binding kinetics link DNA damage dose to transcriptional timing within the SOS gene network

Matthew J Culyba et al. PLoS Genet. .

Abstract

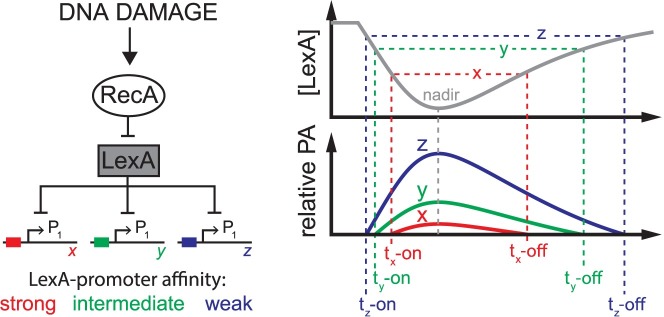
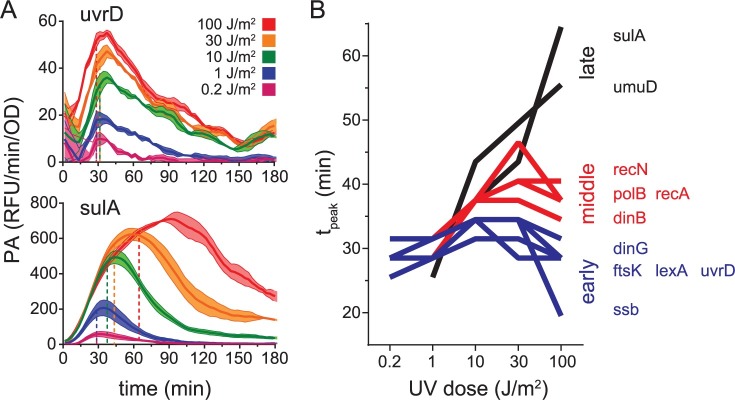
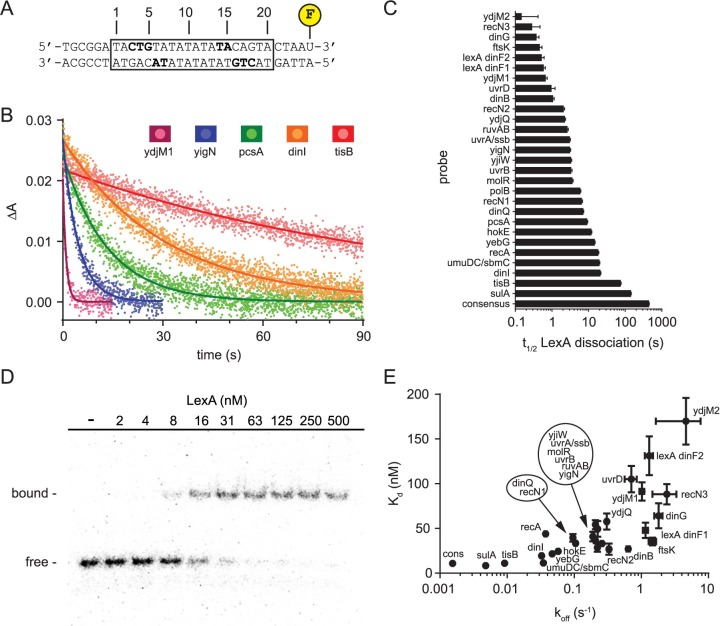
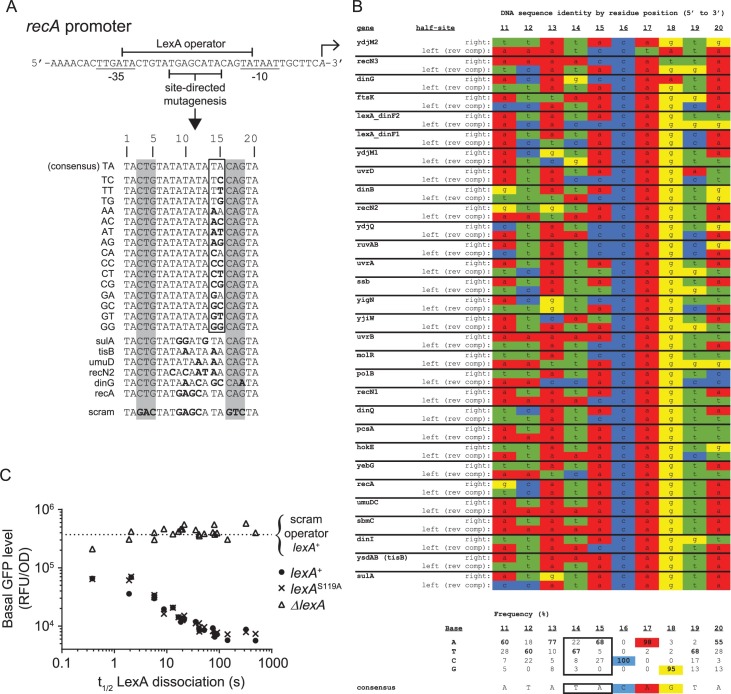
Biochemical pathways are often genetically encoded as simple transcription regulation networks, where one transcription factor regulates the expression of multiple genes in a pathway. The relative timing of each promoter's activation and shut-off within the network can impact physiology. In the DNA damage repair pathway (known as the SOS response) of Escherichia coli, approximately 40 genes are regulated by the LexA repressor. After a DNA damaging event, LexA degradation triggers SOS gene transcription, which is temporally separated into subsets of 'early', 'middle', and 'late' genes. Although this feature plays an important role in regulating the SOS response, both the range of this separation and its underlying mechanism are not experimentally defined. Here we show that, at low doses of DNA damage, the timing of promoter activities is not separated. Instead, timing differences only emerge at higher levels of DNA damage and increase as a function of DNA damage dose. To understand mechanism, we derived a series of synthetic SOS gene promoters which vary in LexA-operator binding kinetics, but are otherwise identical, and then studied their activity over a large dose-range of DNA damage. In distinction to established models based on rapid equilibrium assumptions, the data best fit a kinetic model of repressor occupancy at promoters, where the drop in cellular LexA levels associated with higher doses of DNA damage leads to non-equilibrium binding kinetics of LexA at operators. Operators with slow LexA binding kinetics achieve their minimal occupancy state at later times than operators with fast binding kinetics, resulting in a time separation of peak promoter activity between genes. These data provide insight into this remarkable feature of the SOS pathway by demonstrating how a single transcription factor can be employed to control the relative timing of each gene's transcription as a function of stimulus dose.


Conflict of interest statement

The authors have declared that no competing interests exist.

Figures

Fig 1
Fig 1. Thermodynamic equilibrium model of LexA occupancy at SOS promoters.
Left: RecA/LexA regulation of the SOS gene network in response to DNA damage. LexA represses transcription at hypothetical SOS gene promoters, x, y, and z, of similar promoter strengths, but with relatively strong (red), intermediate (green), or weak (blue) binding affinity for LexA. Right: After DNA damage, the LexA concentration (gray line) falls, reaches a nadir, then re-accumulates after DNA repair. In this model, the LexA-promoter binding reaction is in thermodynamic equilibrium with falling and rising LexA levels, therefore, the relative promoter activities of x, y, and z are dependent on promoter binding affinity for LexA, as defined by the equilibrium binding constant, Kd. Horizontal dotted lines indicate threshold concentrations of LexA at which the promoters achieve the identical promoter activity level (arbitrarily defined here as the y-intercept value of the x-axis). As LexA levels fall or rise, the time at which this promoter activity level is reached, t-on or t-off, respectively, is different for each promoter and indicated by the colored vertical dotted lines. The grey dotted line indicates the time of the LexA nadir. Given conditions of thermodynamic equilibrium for LexA binding at the promoters, the model predicts the time of peak promoter activity will correspond to the time of the LexA nadir for all promoters and that the first promoters to turn on will be the last to turn off (first-on last-off pattern). The limitations of this equilibrium model are discussed in the text and stand in contrast to the kinetic model (see Fig 7).
Fig 2
Fig 2. Effect of UV dose on the timing of peak promoter activity.
A. Promoter activity for the uvrD and sulA promoters plotted as a function of time after a range of UV doses. Promoter activity (PA) measurements were acquired at 3 minute intervals. Solid lines and shading of the same color connect data points and indicate the mean and standard error of promoter activity measurements, respectively. Colors indicate UV dose, as shown in the figure legend. Horizontal dotted lines indicate the value of 90% of peak promoter activity (0.9*PApeak) for that trace and vertical dotted lines indicate the time at which 0.9*PApeak occurred (tpeak). B. tpeak plotted as a function of UV dose. Promoters were binned into early (blue), middle (red), or late (black) time categories based on tpeak values at 100 J/m2. Lines connecting data points from each UV dose are shown for ease of visualization.
Fig 3
Fig 3. LexA binding to native E. coli operators.
A. Design of FAM-labeled dsDNA probes for fluorescence anisotropy-based assay to measure LexA dissociation from operator DNA. The boxed region indicates the 20 base pair operator sequence implicated in LexA binding, which was different for every probe. The flanking DNA sequence was kept constant between probes. Bolded residues indicate residues with specific nucleobase contacts to LexA [10]. B. Dissociation curves for representative operators from rapid mixing of a preformed LexA-DNA complex with excess unlabeled operator DNA. Data points and solid lines of the same color indicate the mean anisotropy values at each time point and the best-fit curve for a simple exponential decay model, respectively. C. t1/2 values for all the E. coli LexA operators included in this study arranged by t1/2. Error bars represent 95% confidence intervals derived from non-linear regression. D. Representative gel image from EMSA analysis. EMSA probes are the same as in 1A except 32P-labeled instead of FAM-labeled. Data for the dinI operator are shown. E. Plot of apparent Kd versus koff for the LexA-operator dissociation reaction. Kd values were determined by EMSA and koff values were determined by the fluorescence anisotropy-based dissociation assay. Error bars represent 95% confidence intervals of parameter estimates derived from non-linear regression (see Materials and Methods). Data points are labeled with SOS gene names. Due to space constraints, the placement of some data labels is offset. To enable association of each offset label with its proper data point, these labels are circled and the relative spatial orientation of the names within the circle reflects the same orientation of the data points they represent, whose locations are indicated by the arrows.
Fig 4
Fig 4. Construction and validation of recA promoters engineered with different LexA operators.
A. Site-directed mutagenesis of the recA promoter’s operator sequence to create 22 synthetic SOS promoters. Transcription start site is indicated by rightward facing arrow and conserved -10 and -35 RNAP binding sites are underlined. LexA operator sequence indicated by top bracket. Mutagenesis was restricted to the region indicated, except for base pair position 18 of the dinG operator. The first group of sixteen promoters was engineered to contain operator sequences which mimic the consensus operator and are identical to one another, except for operator base pair positions 14 and 15. The second group of six promoters was engineered to contain operator sequences found in E. coli SOS genes. Bolded residues indicate deviations from the consensus operator sequence. The ‘scram’ promoter contains an operator sequence in which the highly conserved CTG (CAG)-motifs of the LexA operator sequence (grey shading) were mutated to ablate LexA binding. Binding is not detectable to the scram operator in biochemical assays at the highest LexA concentration tested of 1 μM. B. LexA operator half-site alignment. LexA binds to its 20 bp operator DNA as a dimer. Operators are comprised of two half-sites, which exhibit dyad symmetry with respect to highly conserved CTG (CAG)-motifs. Each monomer of a LexA dimer engages one half-site of the operator. The DNA sequence alignment contains 60 half-sites, derived from 30 operators in the E. coli chromosome. Sequences are arranged as in Fig 3C, in order of increasing t1/2 value. For each operator, the DNA sequence of the ‘right’ half-site is shown above the ‘left’ half-site. ‘Left’ half-site sequences are reverse complemented to account for the dyad symmetry. Residue frequencies for each position and the consensus half-site sequence are given below the alignment. The consensus frequency values are bolded, the highly conserved CTG (CAG)-motif is highlighted, and the residues targeted for mutagenesis in A (positions 14 and 15) are outlined with a black border. C. Basal promoter activity of the synthetic recA promoters as a function of LexA-operator dissociation rate (t1/2) in ΔlexA, lexA+, and lexAS119A cells. Horizontal dotted line indicates the value obtained with the ‘scram’ control promoter in the lexA+ strain.
Fig 5
Fig 5. Analysis of operator residues 14 and 15 on LexA binding and promoter activity.
A. LexA-operator dissociation rates (t1/2) for all sixteen possible operators containing Watson-Crick base pair substitutions at residues 14 and 15. Data are arranged according to residue position, where the x-axis labels indicate the identity of residue 15 and colors indicate the identity of residue 14 (see legend). The core DNA sequence of the operator probes is shown above the plot, where N indicates the location of the residues which vary between the sixteen different operators. B. Values of PApeak were obtained after a UV dose of 10 J/m2 and are derived from the set of sixteen GFP-reporter plasmids containing the same operator sequences as in A, and are plotted against the biochemically determined t1/2 values for the LexA-operator dissociation reaction. Legend: Two-letter designations refer to the operator DNA sequences in Fig 4A. Different colors indicate the identity of residue 14 and different symbols indicate the identity of residue 15. The dashed line indicates separation of the dataset into two groups (15 = T/G and 15 = A/C) based on the identity of residue 15.
Fig 6
Fig 6. Effect of DNA damage dose on synthetic recA promoters.
A. Top: Normalized dose-response curves for synthetic recA promoters. Bottom: Correlation between the UV-activation thresholds (ED50) derived from the dose-response model and LexA-operator dissociation rates (t1/2). B. Top: Plot of tpeak versus UV dose for synthetic recA promoters. Bottom: Plot of tpeak versus LexA-operator dissociation rate (t1/2) for each UV dose. Lines connecting data points from different UV doses (top) or t1/2 values (bottom) are shown for ease of visualization. C. Normalized promoter activity traces at UV doses of 1 J/m2 (top) and 100 J/m2 (bottom). Legend: Data lines with darker shading indicate slower LexA-operator dissociation rates (larger t1/2).
Fig 7
Fig 7. Chromosomal promoter activity data and a kinetic model of LexA occupancy at SOS promoters.
A. Promoter activity kinetics of chromosomal promoters. MG1655 strains harboring chromosomal GFP-reporter cassettes with slow (red), intermediate (green), and fast (blue) LexA-operator dissociation kinetics were analyzed as above. These strains contain recA promoters with mutated LexA operators identical to those in Fig 4A and Fig 5. Strain MC0001 (red) contains the “TA” (consensus) LexA operator sequence, MC0002 (green) contains the “GA” sequence, and strain MC0003 (blue) contains the “GG” sequence. B. Kinetic model of LexA occupancy at SOS promoters. Modeled LexA depletion curves (black solid lines) are shown for a low (top) and high (bottom) UV dose. Colored solid and dashed lines indicate promoters with fast and slow LexA-operator binding kinetics, respectively. Values of modeled kinetic parameters are given in the figure legend, with ‘FAST’ kinetics allowing for thermodynamic equilibrium (as per the equilibrium model in Fig 1), while ‘SLOW’ kinetics create non-equilibrium dynamics. Black vertical dashed lines indicate the time of the LexA nadir. Colored vertical dashed lines indicate the time of peak promoter activity. Right axis: promoter activity ranges from zero to one, with zero meaning full LexA occupancy at the promoter and one meaning no LexA occupancy. The simulations show that accounting for non-equilibrium LexA-operator binding kinetics recapitulates the key features of the UV dose-dependent differences in timing observed in the experimental data: At high doses of DNA damage, promoters with slower LexA binding kinetics display peak activity at later times and more right-shifted temporal promoter activity plots.

References

    1. Shen-Orr SS, Milo R, Mangan S, Alon U. (2002) Network motifs in the transcriptional regulation network of Escherichia coli. Nat Genet 31(1): 64–68. doi: 10.1038/ng881 - DOI - PubMed
    1. Kalir S, McClure J, Pabbaraju K, Southward C, Ronen M, et al. (2001) Ordering genes in a flagella pathway by analysis of expression kinetics from living bacteria. Science 292(5524): 2080–2083. doi: 10.1126/science.1058758 - DOI - PubMed
    1. Zaslaver A, Mayo AE, Rosenberg R, Bashkin P, Sberro H, et al. (2004) Just-in-time transcription program in metabolic pathways. Nat Genet 36(5): 486–491. doi: 10.1038/ng1348 - DOI - PubMed
    1. Simmons LA, Foti JJ, Cohen SE, Walker GC. (2008) The SOS regulatory network. EcoSal Plus 3(1): doi: 10.1128/ecosalplus.5.4.3 - DOI - PubMed
    1. Radman M. (1999) Enzymes of evolutionary change. Nature 401(6756): 866–7, 869. doi: 10.1038/44738 - DOI - PubMed

Publication types

MeSH terms

LinkOut - more resources