Review
. 2018 Sep 15:4:263-285.
doi: 10.1146/annurev-vision-091517-034122. Epub 2018 Jun 1.

Thalamocortical Circuits and Functional Architecture

Affiliations
Review

Thalamocortical Circuits and Functional Architecture

Jens Kremkow et al. Annu Rev Vis Sci. .

Abstract

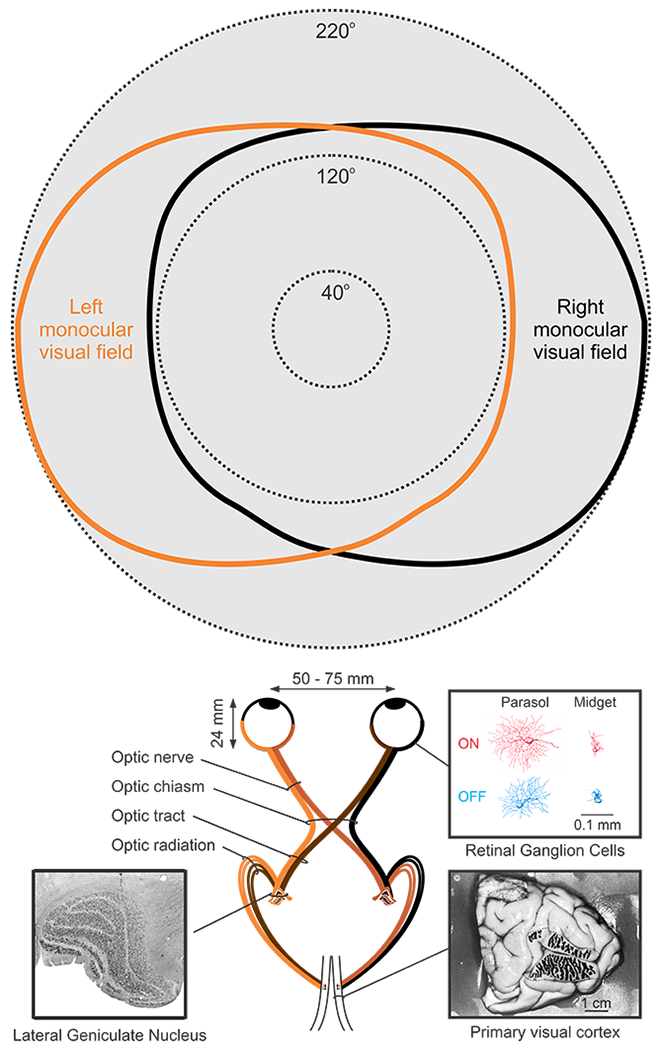
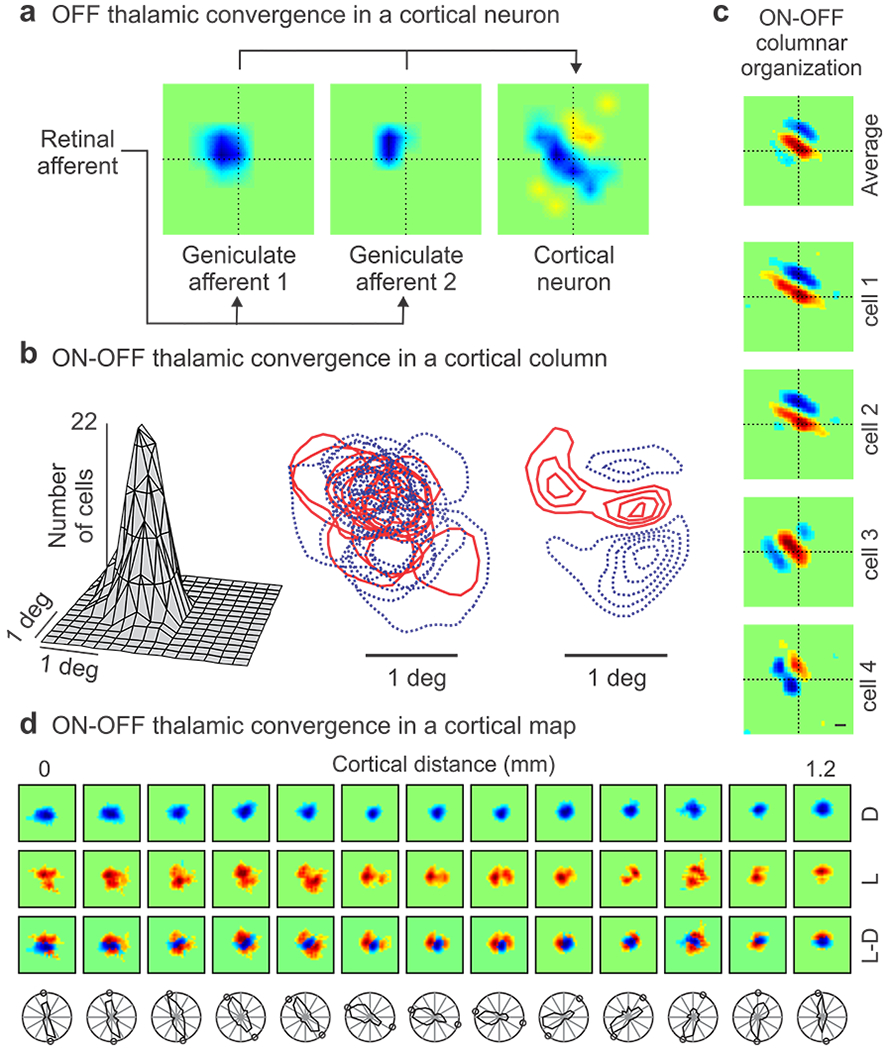
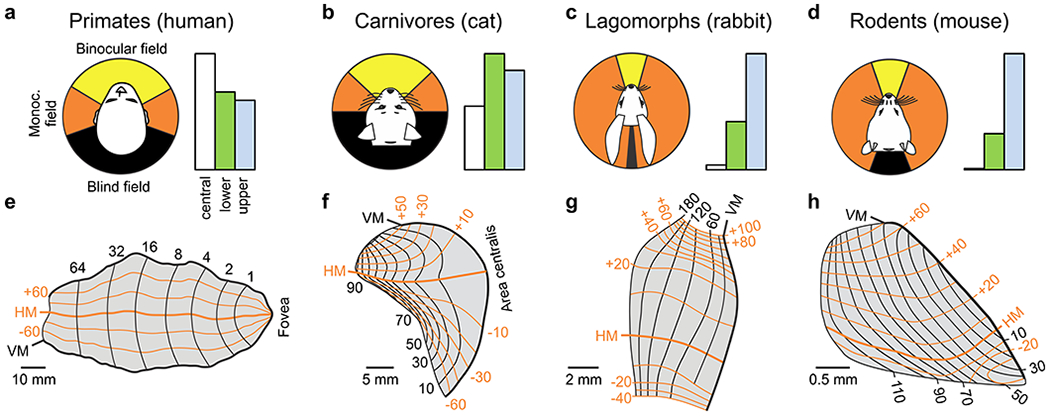
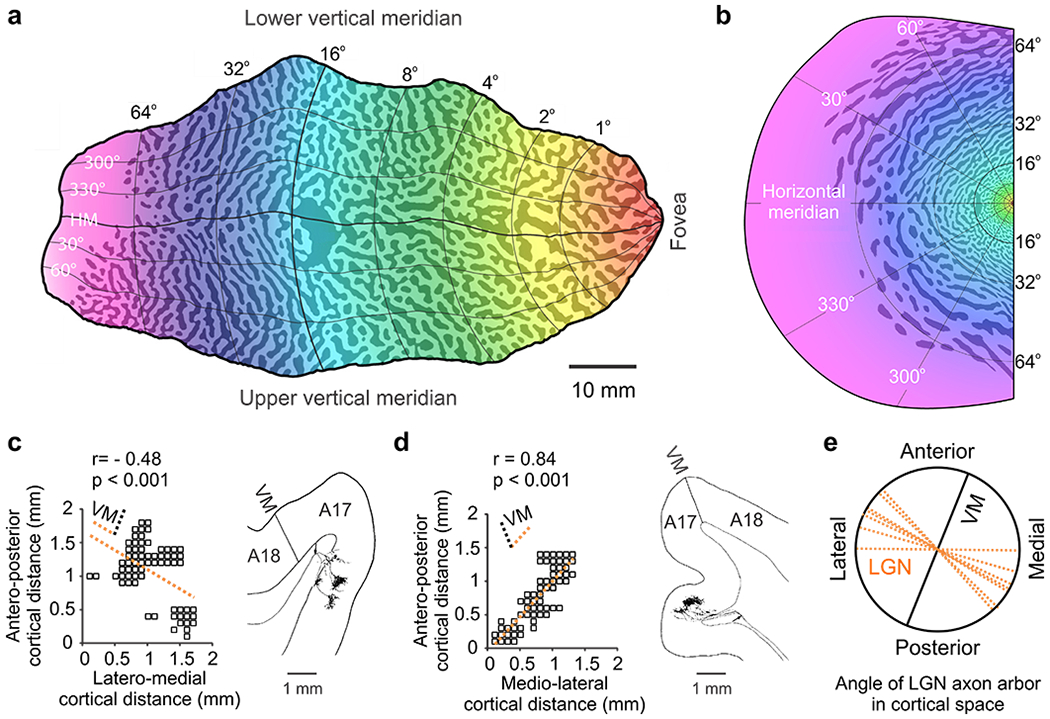
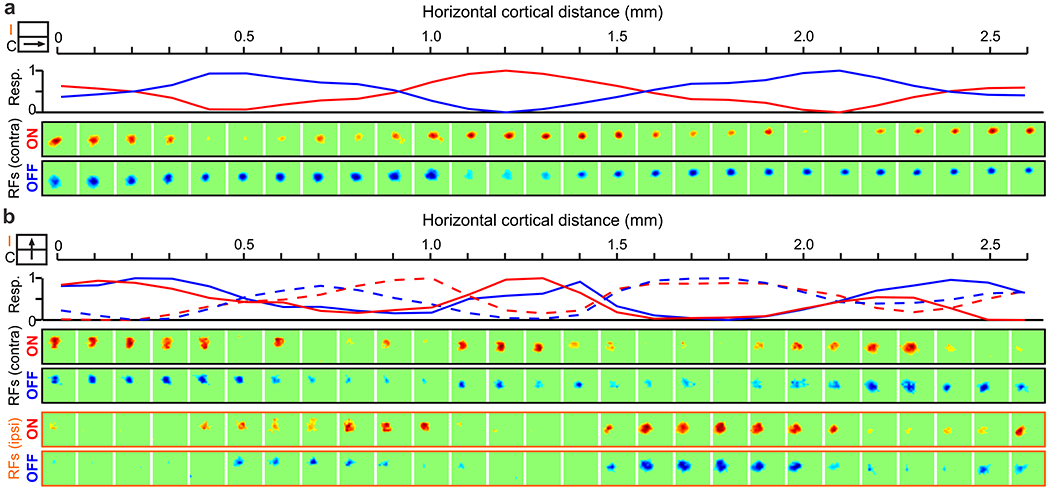
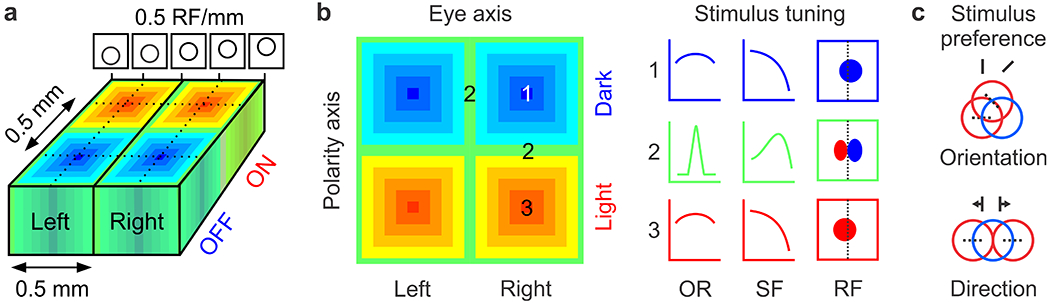
The thalamocortical pathway is the main route of communication between the eye and the cerebral cortex. During embryonic development, thalamocortical afferents travel to L4 and are sorted by receptive field position, eye of origin, and contrast polarity (i.e., preference for light or dark stimuli). In primates and carnivores, this sorting involves numerous afferents, most of which sample a limited region of the binocular field. Devoting abundant thalamocortical resources to process a limited visual field has a clear advantage: It allows many stimulus combinations to be sampled at each spatial location. Moreover, the sampling efficiency can be further enhanced by organizing the afferents in a cortical grid for eye input and contrast polarity. We argue that thalamocortical interactions within this eye-polarity grid can be used to represent multiple stimulus combinations found in nature and to build an accurate cortical map for multidimensional stimulus space.

Keywords: cortical map; receptive field; thalamocortical; thalamus; visual cortex; visual development.


Figures

Figure 1.
Figure 1.. Human visual pathway.
Top. Monocular and binocular visual field in humans (redrawn from (Traquair 1938)). Bottom. Visual pathway from the eye to primary visual cortex. Insets illustrate the human Lateral Geniculate Nucleus (left, reproduced from (Briggs & Usrey 2011)), retinal ganglion cells (right, top, reproduced from (Dacey & Petersen 1992)) and ocular dominance bands in primary visual cortex (right, bottom, reproduced from (Horton & Hedley-Whyte 1984)).
Figure 2.
Figure 2.. Overexpansion of area V1 as the number of LGN afferents increases during evolution.
a. Percentage of retinal ganglion cells projecting to thalamus and superior colliculus in the mouse (Ellis et al 2016, Martin 1986, Seabrook et al 2017), rabbit (Vaney et al 1981), cat (Illing & Wassle 1981, Wassle & Illing 1980) and macaque (Bunt et al 1975, Perry & Cowey 1984). b. Relation between the number of LGN and V1 cells in haplorhine primates (reproduced from (Stevens 2001). c. Relation between the number of LGN cells and V1 area in mammals commonly used to study vision (reproduced from (Mazade & Alonso 2017)). Both relations in b and c follow a similar power law with an exponent close to 3/2. Nc: number of cortical neurons. Nt: number of thalamic geniculate neurons. Ac: area of cortex (V1) in mm2.
Figure 3.
Figure 3.. Development of thalamocortical afferents.
a. Prenatal development of human frontal cortex. b. Prenatal development of geniculate afferents in the cat at embryonic day 50 (left), 60 (middle) and 20 days after birth (right). Cats are born at embryonic day 65 (E65). c-f. Morphology of single geniculate afferents in the cat at embryonic days 30 (c), 60 (d), postnatal day 7 (e) and the adult (f). Reproduced from (Mrzljak et al 1988) for a, (Ghosh & Shatz 1992) for b-e and (Humphrey et al 1985) for f.
Figure 4.
Figure 4.. Development of ON-OFF segregation in ferret LGN.
Top. Ferret LGN 2 days (P2), 10 days (P10) and 25 days (P25) after birth. Eye segregation is completed at P10 and ON-OFF segregation is completed at P25. A, C, C2: contralateral layers, A1, C1: ipsilateral layers. C3: layer not receiving retinal input, OT: optic tract, MIN: medial interlaminar nucleus, vLGN: ventral lateral geniculate nucleus, W: wing of the geniculate, on: on layers, off: off layers. Reproduced from (Speer et al 2010). Bottom. Cartoon illustrating the stages of retinal afferent segregation in LGN, first by eye and later by ON-OFF contrast polarity (based on (Speer et al 2010)).
Figure 5.
Figure 5.. Geniculocortical convergence in visual cortex.
a. Receptive fields from two OFF geniculate neurons (left and middle) that share input from the same retinal afferent and make monosynaptic connection with the same OFF-dominated cortical cell (right). b. Receptive field scatter from geniculate afferents converging within a cortical column of ~ 200 microns in diameter. From left to right, receptive-field spread-function, superimposed ON (red) and OFF (blue) receptive fields, population receptive field obtained by ON-OFF subtraction. c. ON and OFF receptive field subregions in single neurons recorded within a vertical track in cortical layer 4 and their average receptive field. d. Top. Change in retinotopy through the horizontal dimension of visual cortex for responses to dark (D), light (L) and light-dark (L-D). Bottom. Same for orientation preference. Circles show predicted orientation from L-D receptive fields. Reproduced from (Alonso et al 1996) for a, (Jin et al 2011b) for b, (Wang et al 2015) for c and (Kremkow et al 2016) for d.
Figure 6.
Figure 6.. Cortical map for retinotopy.
a-d. Visual fields and their cortical representation in humans (a), cats (b), rabbits (c) and mice (d). The left panel shows the binocular field (yellow), monocular field (orange) and the blind field (black). Values from (Mazade & Alonso 2017). The right panel shows the percentage of area V1 devoted to central vision (white, central 10 degrees), lower (green) and upper visual fields (blue). Percentages of blue bars are 26% (a), 36% (b), 69% (c), and 76% (d). Values obtained from retinotopic maps in e-h. e-h. Retinotopic maps of area V1 in the human, cat, rabbit and mouse. Redrawn from (Adams et al 2007) for a, (Tusa et al 1978) for b, (Hughes 1971) for c, and (Ji et al 2015) for d.
Figure 7.
Figure 7.. Cortical map for ocular dominance.
a. Ocular dominance map in human V1 (the color gradient represents changes in retinotopy). b. Ocular dominance map superimposed on the human visual field. Notice how the ocular dominance bands rotate around the center of vision and are perpendicular to the vertical meridian, which is represented in the V1/V2 border. c-d. Geniculate axonal arbors from cat visual cortex showing their spread in cortical space in horizontal (left) and coronal sections (right). Notice that the main axis of the arbor (dotted orange line) tends to be tilted to the left in the left hemisphere (c) and right in the right hemisphere (d), and perpendicular to the vertical meridian (VM). Notice also how the axon arbor splits in clusters along the longest axis, providing the anatomical basis for ocular dominance columns. e. The main axis of the axon arbors in cat area V1 shows a strong tendency to be perpendicular to the vertical meridian. Reproduced from (Adams et al 2007) for a-b and from (Humphrey et al 1985) for c-e.
Figure 8.
Figure 8.. Cortical map for light/dark polarity.
a. ON and OFF domains in a horizontal cortical track running along the length of an ocular dominance column (illustrated by cartoon in inset). From top to bottom, line plot showing normalized maximum ON (red) and OFF responses (blue), and receptive fields measured with light (ON) and dark stimuli (OFF). b. ON and OFF domains in a horizontal track running orthogonal to ocular dominance columns (inset). From top to bottom, normalized ON and OFF responses from contralateral (continuous lines) and ipsilateral eyes (dashed lines), and receptive fields mapped with dark and light stimuli from the contralateral eye (black frame) and ipsilateral eyes (orange frame). Reproduced from (Kremkow et al 2016).
Figure 9.
Figure 9.. The eye/polarity grid and the multi-dimensional map of stimulus space.
a. Cortical organization for retinotopy, eye input and ON-OFF contrast polarity. Top. Retinotopy illustrated as circular receptive fields (RF) changing position in the vertical axis at a slow rate of 0.5 RF/mm. Bottom. The orthogonal arrangement of geniculate afferents sorted by eye input and ON-OFF polarity forms ocular dominance columns and ON-OFF cortical domains. b. Left. Cortical responses within the eye/polarity grid can be OFF dominated (blue), ON dominated (red) or ON-OFF balanced (green). Right. Changes in ON-OFF balance should be associated with changes in orientation tuning (OR), spatial frequency tuning (SF) and spatial resolution (spatial frequency cutoff). The OR/SF tuning and spatial resolution should be lowest at the center of ON and OFF domains and increase in surrounding regions. c. Changes in ON-OFF retinotopy should be associated with changes in orientation (e.g. when ON receptive fields rotate around OFF receptive fields in the geniculocortical network) and direction (e.g. when ON receptive fields jump over OFF receptive fields). a,c Modified from (Kremkow et al 2016).

References

    1. Adams DL, Horton JC. 2003a. Capricious expression of cortical columns in the primate brain. Nature neuroscience 6: 113–4 - PubMed
    1. Adams DL, Horton JC. 2003b. A precise retinotopic map of primate striate cortex generated from the representation of angioscotomas. The Journal of neuroscience : the official journal of the Society for Neuroscience 23: 3771–89 - PMC - PubMed
    1. Adams DL, Sincich LC, Horton JC. 2007. Complete pattern of ocular dominance columns in human primary visual cortex. The Journal of neuroscience : the official journal of the Society for Neuroscience 27: 10391–403 - PMC - PubMed
    1. Albus K, Wolf W. 1984. Early post-natal development of neuronal function in the kitten’s visual cortex: a laminar analysis. The Journal of physiology 348: 153–85 - PMC - PubMed
    1. Allendoerfer KL, Shatz CJ. 1994. The subplate, a transient neocortical structure: its role in the development of connections between thalamus and cortex. Annual review of neuroscience 17: 185–218 - PubMed

Publication types

LinkOut - more resources