. 2018 May 31;173(6):1370-1384.e16.
doi: 10.1016/j.cell.2018.03.067. Epub 2018 May 31.

Human-Specific NOTCH2NL Genes Expand Cortical Neurogenesis through Delta/Notch Regulation

Affiliations

Human-Specific NOTCH2NL Genes Expand Cortical Neurogenesis through Delta/Notch Regulation

Ikuo K Suzuki et al. Cell. .

Abstract

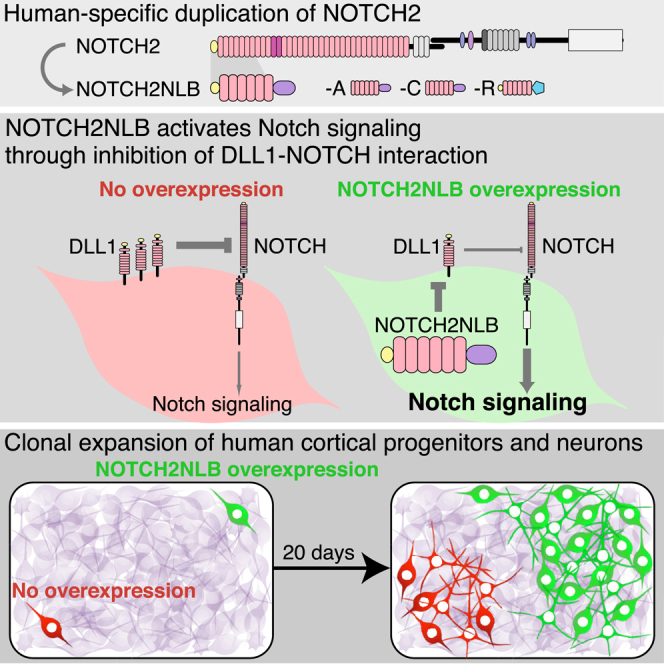
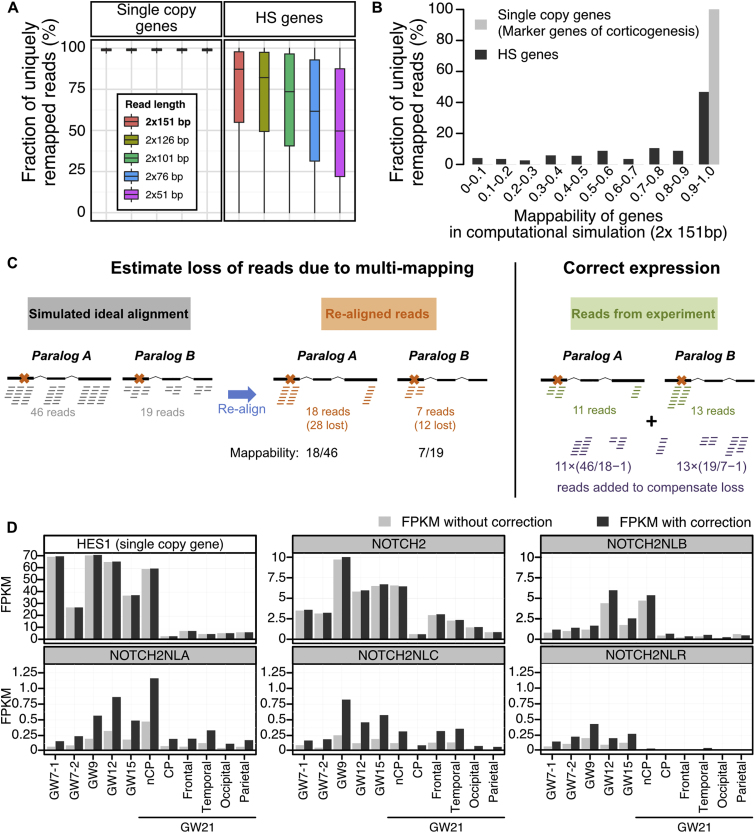
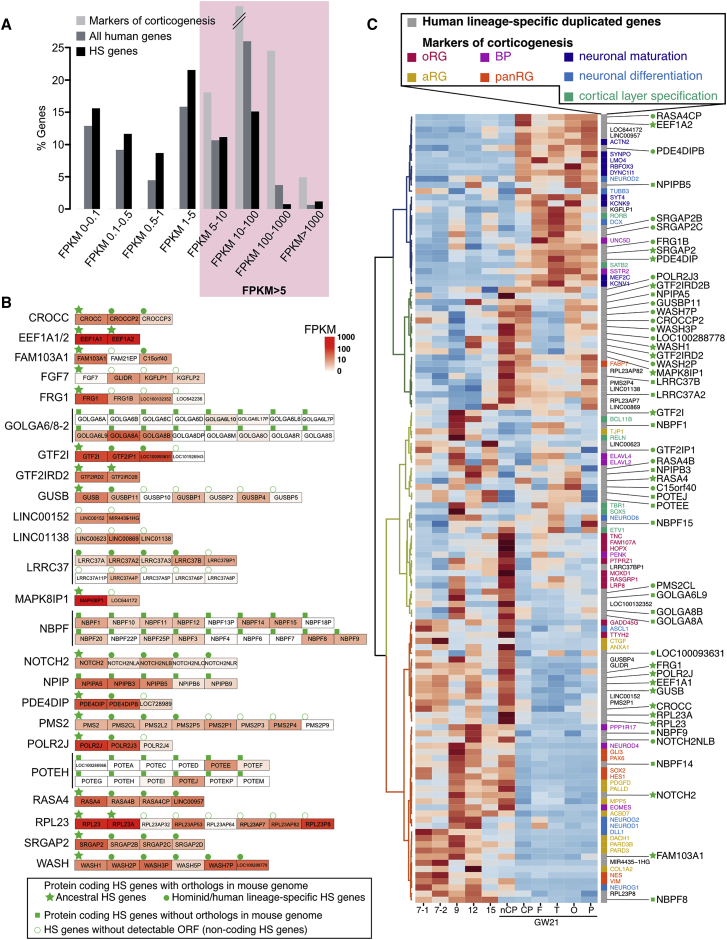
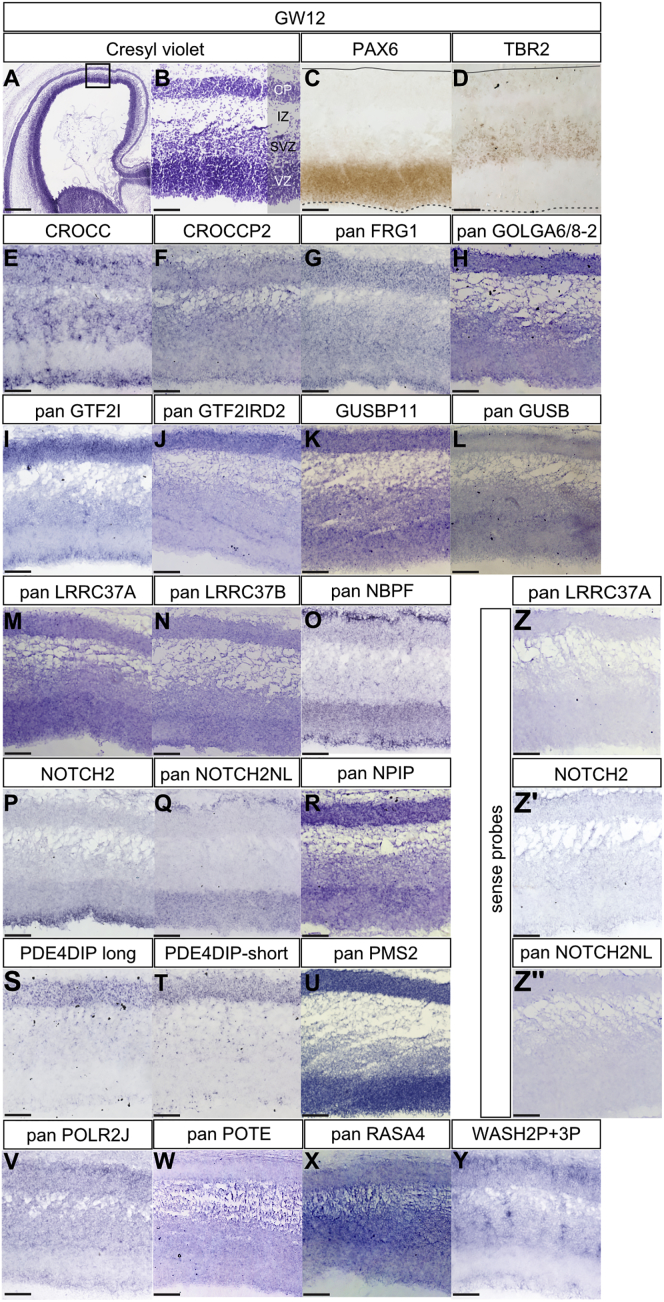
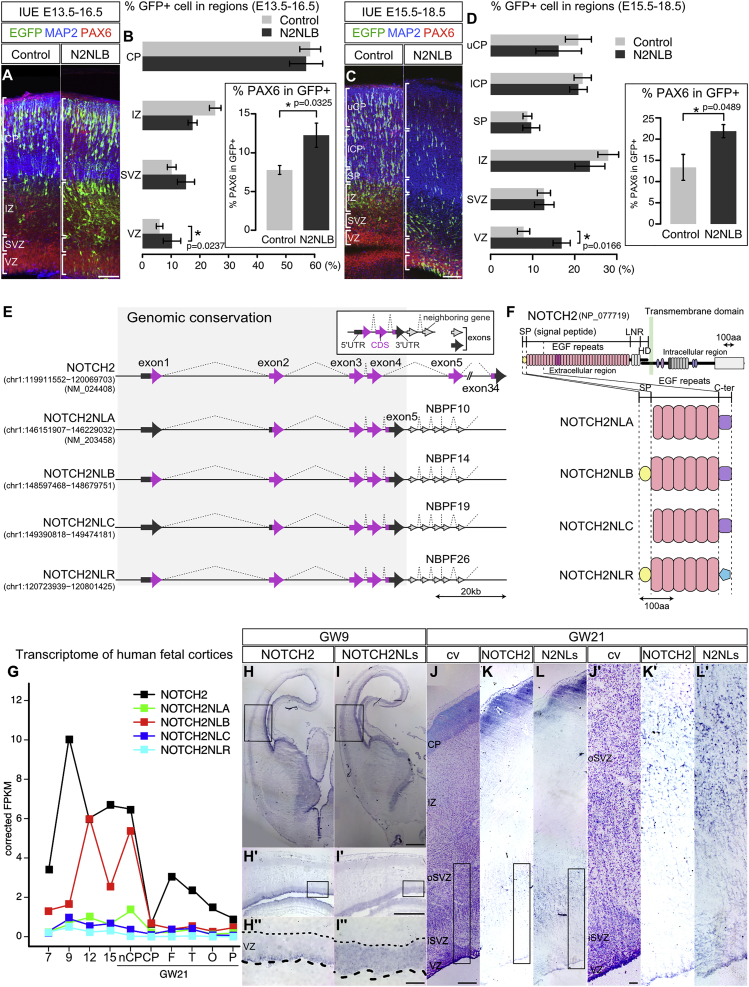
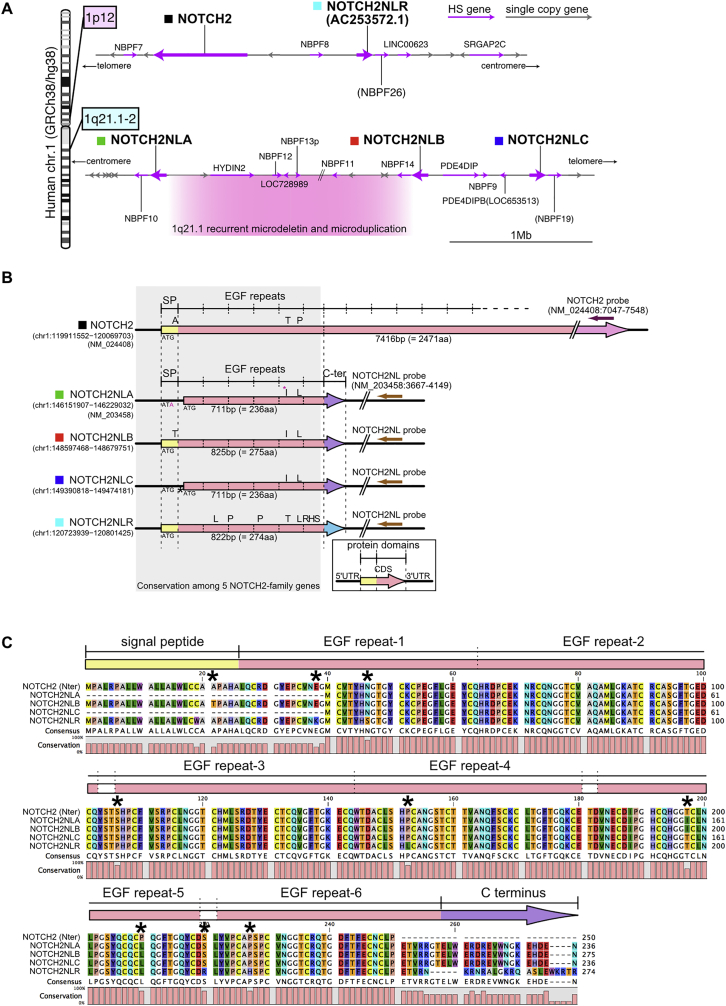
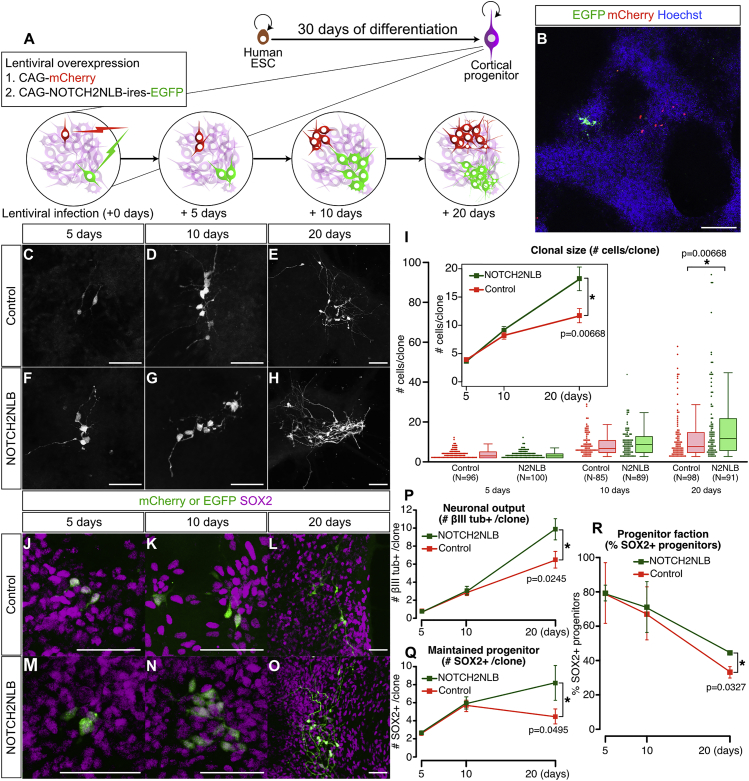
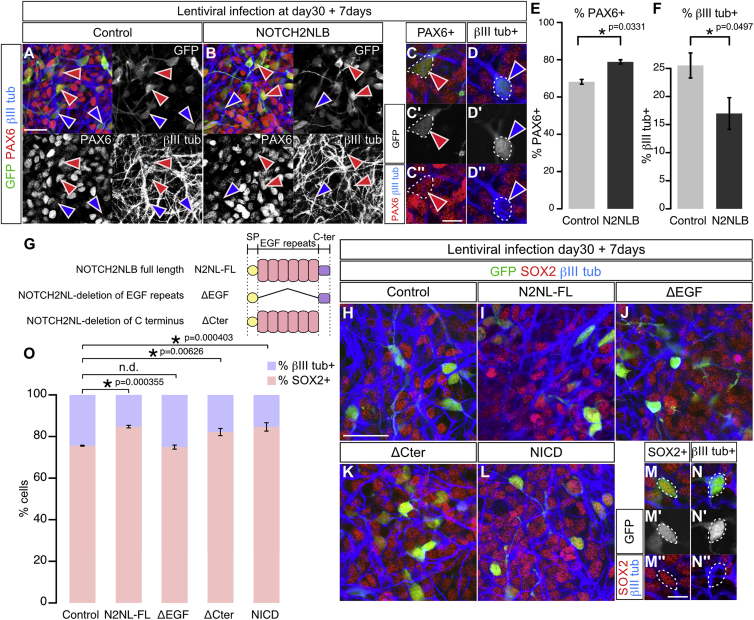
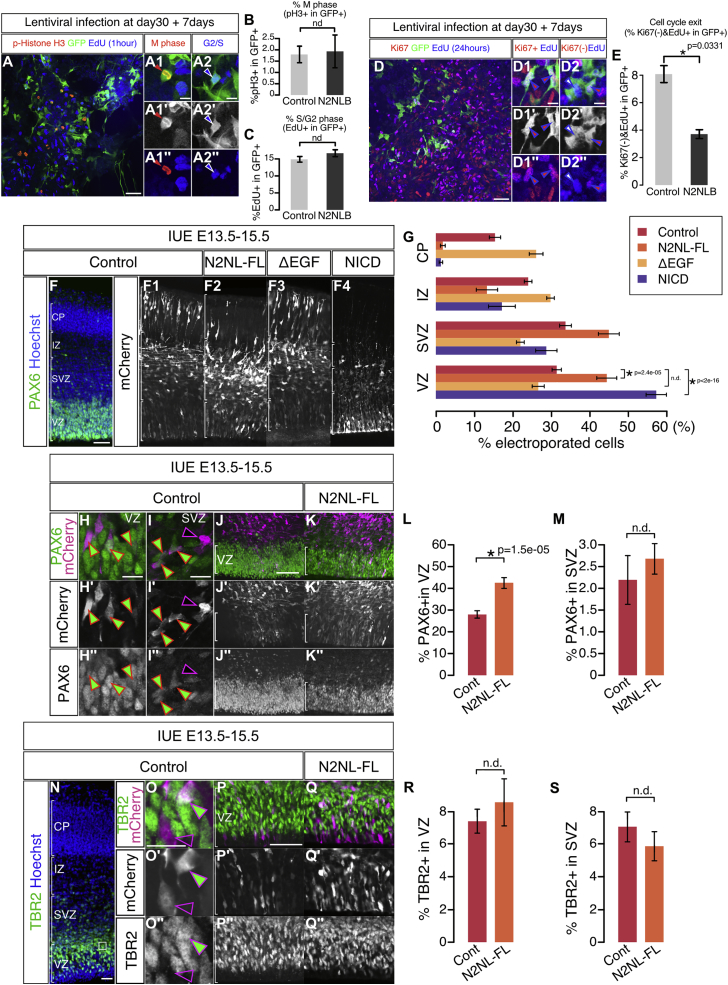
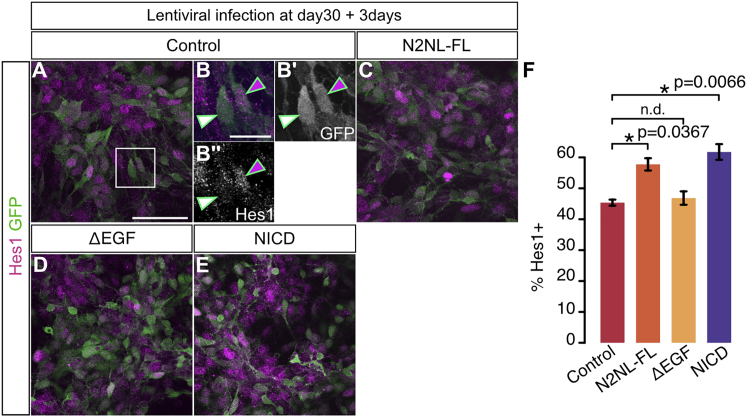
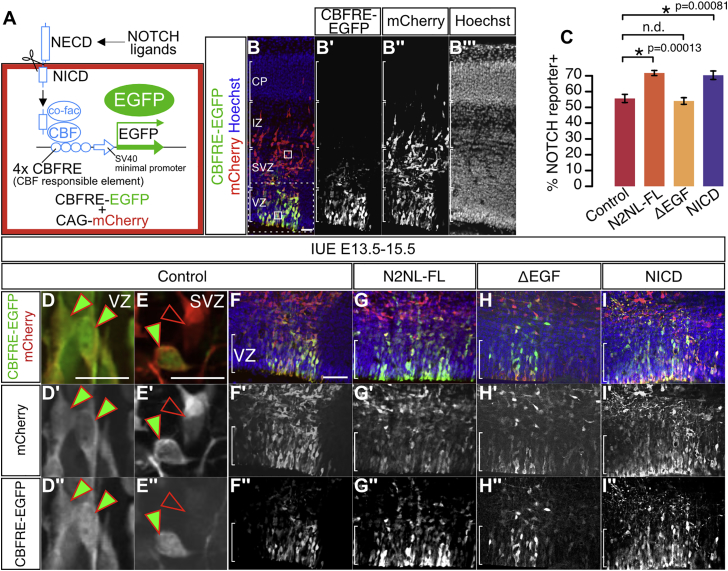
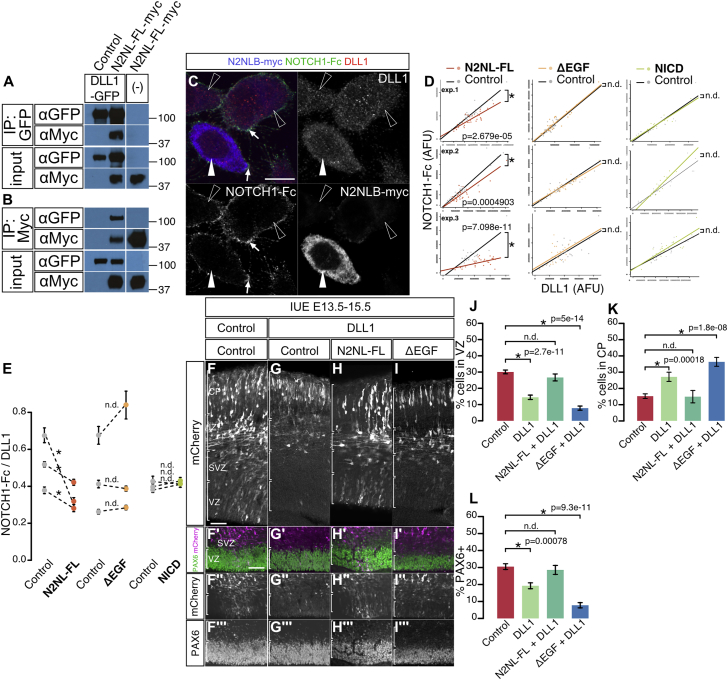
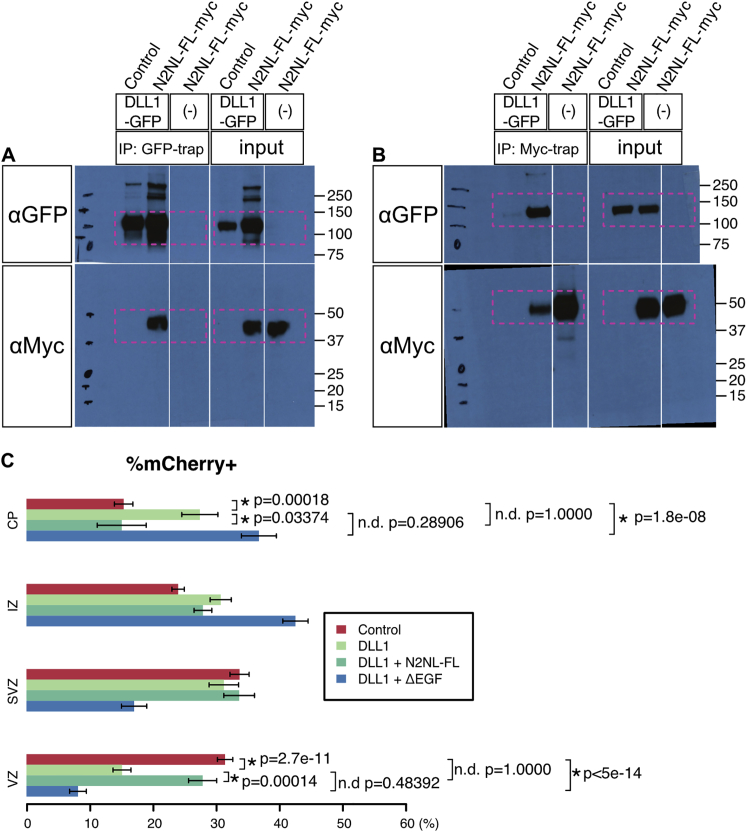
The cerebral cortex underwent rapid expansion and increased complexity during recent hominid evolution. Gene duplications constitute a major evolutionary force, but their impact on human brain development remains unclear. Using tailored RNA sequencing (RNA-seq), we profiled the spatial and temporal expression of hominid-specific duplicated (HS) genes in the human fetal cortex and identified a repertoire of 35 HS genes displaying robust and dynamic patterns during cortical neurogenesis. Among them NOTCH2NL, human-specific paralogs of the NOTCH2 receptor, stood out for their ability to promote cortical progenitor maintenance. NOTCH2NL promote the clonal expansion of human cortical progenitors, ultimately leading to higher neuronal output. At the molecular level, NOTCH2NL function by activating the Notch pathway through inhibition of cis Delta/Notch interactions. Our study uncovers a large repertoire of recently evolved genes active during human corticogenesis and reveals how human-specific NOTCH paralogs may have contributed to the expansion of the human cortex.

Keywords: Notch; brain development; cerebral cortex; human evolution; neurogenesis.


Figures

None
Graphical abstract
Figure S1
Figure S1
Transcriptome Analysis: Correcting for Loss of Multimapping Loss, Related to Figure 1 (A) The mappability of a gene is defined as the number of reads uniquely mapped on this gene divided by the number of reads originating from its transcripts. It is computed from simulated transcriptomes, as explained above and depicted in panel C. Most reads originating from single copy genes are uniquely mapped on the reference genome regardless of sequencing length, hence they have a mappability of one. HS genes show lower mappability values. As expected, their mappability is inversely related to read length. (B) When setting simulated read length to 2x 151bp, which is the length used for transcriptome sequencing in this study, only half of the HS genes show mappability values above 90%. (C) Computational correction of expression for human specific paralogs. Paralogs within each HS gene families are highly similar; potentially confusing the mapping of reads originating from individual paralogs. As a result, some reads are discarded because they map to multiple paralogs, leading to expression under-estimation. To estimate this loss quantitatively, an alignment of simulated reads (BAM file) is generated for each gene (gray alignment) at a defined coverage (see methods). This simulated alignment is ideal as it assumes a uniform coverage of the genes, and importantly the reads are manufactured and placed on reference genome, i.e., no read mapping procedure is involved, hence there is no mapping ambiguity. These simulated reads are then extracted and aligned with the same alignment procedure as used for in vivo experimental data (see methods; orange alignment, crosses on the gene structures denote unique sequence features allowing unambiguous mapping). Many reads are lost in the process due to multimapping, but we can estimate how many, since we initially generated them in known quantity (i.e., gray alignment). Finally, when aligning reads from in vivo experiments (green alignment), these estimates are used to inject in the alignments the near-exact number of additional reads to compensate for the loss of multimapping reads (purple alignment). (D) Example of correction: FPKM values computed without (light gray) and with the simulation-based correction (dark gray) for 5 paralogous genes of the NOTCH2 family and HES1 as an example of single copy gene.
Figure 1
Figure 1
Transcriptome Profiling of HS Genes during Human Corticogenesis (A) Distribution of expression levels of HS genes and all human genes in fetal cortex. Expression level of selected cortical marker genes is higher than FPKM5. (B) 24 families of HS genes identified; red intensities represent the peak expression during human corticogenesis. For HS gene families with mouse ortholog, the ancestor is tagged with a green star and HS paralogs with a green circle. HS genes without any detectable mouse orthologs are tagged with a green square. HS genes with no detectable ORF are tagged with a white circle. (C) Cluster analysis of HS and cortical marker gene expression. Samples are displayed as columns. At GW21, specific subdomains were isolated: non-cortical plate (non CP), cortical plate (CP), frontal (F), temporal (T), occipital (O), and parietal (P). Colors identify HS genes (gray) and marker genes for apical radial glia (aRG), outer radial glia (oRG), all radial glia (panRG) and basal progenitors (BP). HS genes without an ORF are displayed in gray/black, and protein-coding HS family genes are tagged as in (B). Heatmap colors were scaled for each individual row, scale of expression for each HS gene corresponds to (B). See also Figure S1 and Tables S1 and S2.
Figure 2
Figure 2
In Situ Analysis of HS Gene Expression in the Human Fetal Cortex (A and B) Cresyl violet staining of coronal sections of GW12 human fetal cortex delineating ventricular zone (VZ), subventricular zone (SVZ), intermediate zone (IZ), and cortical plate (CP). (C and D) Adjacent sections immunostained for PAX6 and TBR2. (E–Y) In situ hybridization of HS gene families in GW12 human fetal cortex. (Z) Sense probes. Scale bars, 500 μm (A) and 100 μm (B–Z). See also Table S3.
Figure 3
Figure 3
NOTCH2NL Identification, Structure, and Expression during Corticogenesis (A–D) In utero electroporation of NOTCH2NLB (N2NLB) or EGFP alone (control) in E13.5 (A and B) and E15.5 mouse cortex (C and D), analyzed 3 days later. The distribution of electroporated cells in distinct regions and the percentage of PAX6-expressing cells were quantified (B and D). Error bars depict mean ± SEM, p values = Student’s t test. (E) Structure of NOTCH2 gene and HS paralogs. Protein-coding and non-protein-coding exons are depicted in magenta and gray, respectively. (F) Predicted protein structure of NOTCH2NL genes. Signal peptide (SP), yellow; EGF repeats, pink; and C-terminal ends, purple and light blue. (G) RNA-seq profile of NOTCH2-family paralogs during human corticogenesis. (H–L) RNA in situ hybridization using probes specific for NOTCH2 and NOTCH2NL at GW9 (H and I) and GW21 (K and L). VZ, ventricular zone; oSVZ, outer subventricular zone; IZ, intermediate zone; SP, subplate; CP, cortical plate. Scale bars, 100 μm (A, C, I”, J, and J’), 500 μm (I”), and 1 mm (I). See also Figure S2.
Figure S2
Figure S2
Genomic Organization and Structure of NOTCH2NL Family Gene Members, Related to Figure 3 (A) Genomic organization of 1p12 and 1q21.1-2, where NOTCH2-family genes are located. Genes located in these regions are depicted as arrows (HS genes in magenta and other single copy genes in gray) according to the human reference genome (GRCh38/hg38). (B) Gene structure of NOTCH2-family members. Protein coding region is indicated by arrows and different colors indicate the protein domains. Amino acid substitutions among the members are indicated above the arrows. (C) Alignment of amino acid sequences of 5 NOTCH2-family gene products. Protein motifs indicated above the alignment is derived from the prediction for human NOTCH2 (Uniprot; Q04721). The variable amino acid residues, except for those in the C terminus, are indicated by asterisks.
Figure 4
Figure 4
NOTCH2NLB Overexpression Leads to Clonal Expansion of Human Cortical Progenitors (A and B) Schematic illustration (A) and representative case (B) of the clonal analysis. Human ESC were first differentiated into cortical cells for 30 days, followed by low-titer lentivirus (mCherry control or NOTCH2NLB-IRES-EGFP) infection. (C–H) Representative cases of control (C–E) or NOTCH2NLB (F–H) clones. (I) Quantification of clonal size: dotplots and boxplots indicate the number of cells per clone over time (N = number of clones analyzed). Mean ± SEM of clonal size is indicated in the inset. (J–O) Expression of cortical progenitor marker SOX2 in control mCherry and NOTCH2NLB clones. (P–R) Quantification of βIII tubulin-positive neurons and SOX2-positive progenitors. Mean ± SEM and p value by Student’s t test. Scale bars, 100 μm (B) and 50 μm (C–H and J–O).
Figure 5
Figure 5
NOTCH2NLB Increases Human Cortical Progenitor Maintenance through Its EGF Repeats (A–F) Immunostaining for GFP (green), PAX6 (red), and βIII tubulin (blue) in control ([A], GFP alone) and NOTCH2NLB-expressing human cortical cells (B–D) 7 days post-lentiviral infection at 30 days of differentiation and quantification of proportion of marker expression among GFP-positive cells (E and F). (G) Structures of NOTCH2NL full-length (FL) and deletion mutants. (H–O) Immunostaining for GFP (green), PAX6 (red), and βIII tubulin (blue) in control, NOTCH2NL FL and mutants, or NICD expressing cortical cells 7 days following lentiviral infection and quantification of proportion of marker expression among GFP-positive cells (O). Data are represented as mean ± SEM and p value: one-way ANOVA and Bonferroni correction. Scale bars, 50 μm (A and H) and 10 μm (C, D, M, and N). See also Figure S3.
Figure S3
Figure S3
NOTCH2NLB Promotes Cell-Cycle Re-entry and Maintenance pf Cortical Progenitors, Related to Figure 5 (A–C) The percentage of mitotic cells and the cells in G2/S phase are quantified using anti-phospho Histone H3 and EdU labeling Cell cycle exit in the human cortical progenitors derived from ESC; NOTCH2NLB introduced by lentiviral infection at day 30 of differentiation, EdU incorporated 24 hours before fixation at day 7 of overexpression. (F–S) In utero electroporation of NOTCH2NLB full length (N2NL-FL), NOTCH2NL-EGF repeats deletion (ΔEGF) and mouse NOTCH1 intracellular domain (NICD) in E13.5 mouse cortex, followed by analysis at E15.5. Bin analysis of fractions of mCherry+ electroporated cells in four regions, the CP, IZ, SVZ and VZ (F and G) PAX6 immunoreactivility was examined to quantify the proportion of apical and basal RG progenitors following NOTCH2NL overexpression (H-M). Proportions of PAX6-positive cells in the VZ (L) and SVZ (M) among all electroporated cells in whole cortical thickness are quantified. TBR2 immunoreactivility is examined to quantify the proportion of basal/intermediate progenitors in these four conditions (N-S). Proportion of TBR2-positive cells in the VZ (R) and SVZ (S) among all electroporated cells in whole cortical thickness are quantified. Data are represented as mean ± sem and p values by Student’s t test (B, C and E) one-way ANOVA and bonferroni post hoc test (H, I, P, Q, X and Y). Scale bars; 100μm (A, D, F, L, R and T) and 20μm (A1, A2, D1, D2, J, K and S).
Figure S4
Figure S4
NOTCH2NL Activates Notch Signaling in Human Cortical Progenitors In Vitro, Related to Figure 6 (A–E) Notch signaling activity was examined by HES1 immunoreactivity as a positive readout of NOTCH signaling in human cortical cells, 3 days following lentiviral infection with control vector (GFP only) or leading to overexpression of NOTCH2NL full length (N2NL-FL), NOTCH2NL-EGF repeats deletion (ΔEGF) or NICD. (F) Quantification of HES1-immunoreactive cells among GFP labeled cells in each condition. Data are represented as mean ± sem and p values by one-way ANOVA and bonferroni post hoc test. Scale bars; 100μm (A) and 20μm (B).
Figure 6
Figure 6
NOTCH2NLB Upregulates Notch Signaling In Vivo In utero electroporation in mouse cortex (E13.5, analysis at E15.5) of a NOTCH reporter construct (CBFRE-EGFP) together with ubiquitous CAG-mCherry alone (control) or with NOTCH2NL. (A) A NOTCH reporter containing CBF responsible element (CBFRE) drives expression of EGFP. (B) Cells in which Notch is activated can be identified as EGFP+/mCherry+, while those where Notch is inactive are only mCherry+. (C–I) In utero electroporation of NOTCH2NLB full length (N2NL-FL) and NICD increase NOTCH activation compared with control or NOTCH2NL mutant without EGF repeats (ΔEGF). Data are represented as mean ± SEM. p values: one-way ANOVA and Bonferroni post hoc test. Scale bars, 100 μm (A and F) and 20 μm (D and E). See also Figure S4.
Figure 7
Figure 7
Cell-Autonomous Suppression of DLL1 Function by NOTCH2NLB (A and B) Co-immunoprecipitation of NOTCH2NLB-myc (N2NL-FL-myc) and DLL1-GFP in HEK293T cells, using anti-GFP (A) and anti-Myc antibody (B). (C) CHO cell line expressing DLL1 was transfected with a NOTCH2NLB expression plasmid. DLL1 protein at the plasma membrane was detected by NOTCH1-Fc (green in [C] and white arrows) and total DLL1 protein using DLL1 antibody (red in [C]). Anti-Myc antibody was used to identify NOTCH2NL-expressing cells (blue in [C], white arrowhead) among non-expressing cells (open arrowheads). (D and E) The fluorescent intensities of NOTCH1-Fc (revealing DLL1 protein at the cell plasmic membrane) and of DLL1 antibody (revealing DLL1 protein in the whole cell) were measured in NOTCH2NLB-expressing cells and non-expressing cells (plots of three independent experiments). Compared to the non-expressing cells, NOTCH2NLB full-length-expressing cells show lower level of NOTCH-Fc signal, while NOTCH2NL-ΔEGF or NICD expressing cells display same levels as control cells (D). The ratio of signals for NOTCH1-Fc over DLL1 was quantified for each individual experiment (E). (F–L) NOTCH2NLB suppresses DLL1 function in vivo. Mouse cortex in utero electroporation (E13.5, analysis at E15.5) was performed with DLL1 alone or together with N2NL-FL or N2NL-ΔEGF. Bin analysis reveals that the proportion of electroporated cells is decreased in VZ (J) and increased in CP (K) following DLL1 overexpression, which is blocked by NOTCH2NL-FL but not by NOTCH2NL-ΔEGF (F–K). The same results were obtained when examining the proportion of PAX6 progenitors in electroporated cells (F–I and L). Data are presented as mean ± SEM and p values by Student’s t test (B and C) and one-way ANOVA and Bonferroni post-hoc test (H, I, and N). Scale bars, 10 μm (B) and 100 μm (E and K). See also Figure S5.
Figure S5
Figure S5
Functional Interaction of DLL1 and NOTCH2NL during Mouse Corticogenesis In Vivo, Related to Figure 7 (A and B) Original pictures of the result of co-immunoprecipitation of overexpressed NOTCH2NLB-full length-myc (N2NLFL-myc) and DLL1-GFP. The regions in the magenta rectangles are cropped for Figures 7A and 7B. (C) Bin analysis of the regional distribution of electroporated cells in the mouse cortex 2 days after in utero electroporation at E13.5. The fraction of electroporated cells in the VZ and CP are highlighted in Figures 7J and 7K. Four conditions, Control mCherry alone, DLL1, DLL1 + NOTCH2NLB full length (DLL1+N2NL-FL), DLL1 + NOTCH2NL EGF repeats deletion (DLL1+ΔEGF), were tested. Ventricular zone (VZ), the subventricular zone (SVZ), the intermediate zone (IZ), and the cortical plate (CP). Data are represented as mean ± sem and p values by one-way ANOVA and bonferroni post hoc test.

Comment in

References

    1. Amadio J.P., Walsh C.A. Brain evolution and uniqueness in the human genome. Cell. 2006;126:1033–1035. - PubMed
    1. Anders S., Pyl P.T., Huber W. HTSeq--a Python framework to work with high-throughput sequencing data. Bioinformatics. 2015;31:166–169. - PMC - PubMed
    1. Ataman B., Boulting G.L., Harmin D.A., Yang M.G., Baker-Salisbury M., Yap E.L., Malik A.N., Mei K., Rubin A.A., Spiegel I. Evolution of Osteocrin as an activity-regulated factor in the primate brain. Nature. 2016;539:242–247. - PMC - PubMed
    1. Borrell V., Reillo I. Emerging roles of neural stem cells in cerebral cortex development and evolution. Dev. Neurobiol. 2012;72:955–971. - PubMed
    1. Boyd J.L., Skove S.L., Rouanet J.P., Pilaz L.J., Bepler T., Gordân R., Wray G.A., Silver D.L. Human-chimpanzee differences in a FZD8 enhancer alter cell-cycle dynamics in the developing neocortex. Curr. Biol. 2015;25:772–779. - PMC - PubMed

Publication types