. 2018 May 31;173(6):1439-1453.e19.
doi: 10.1016/j.cell.2018.05.013. Epub 2018 May 31.

Genetic Inactivation of CD33 in Hematopoietic Stem Cells to Enable CAR T Cell Immunotherapy for Acute Myeloid Leukemia

Affiliations

Genetic Inactivation of CD33 in Hematopoietic Stem Cells to Enable CAR T Cell Immunotherapy for Acute Myeloid Leukemia

Miriam Y Kim et al. Cell. .

Abstract

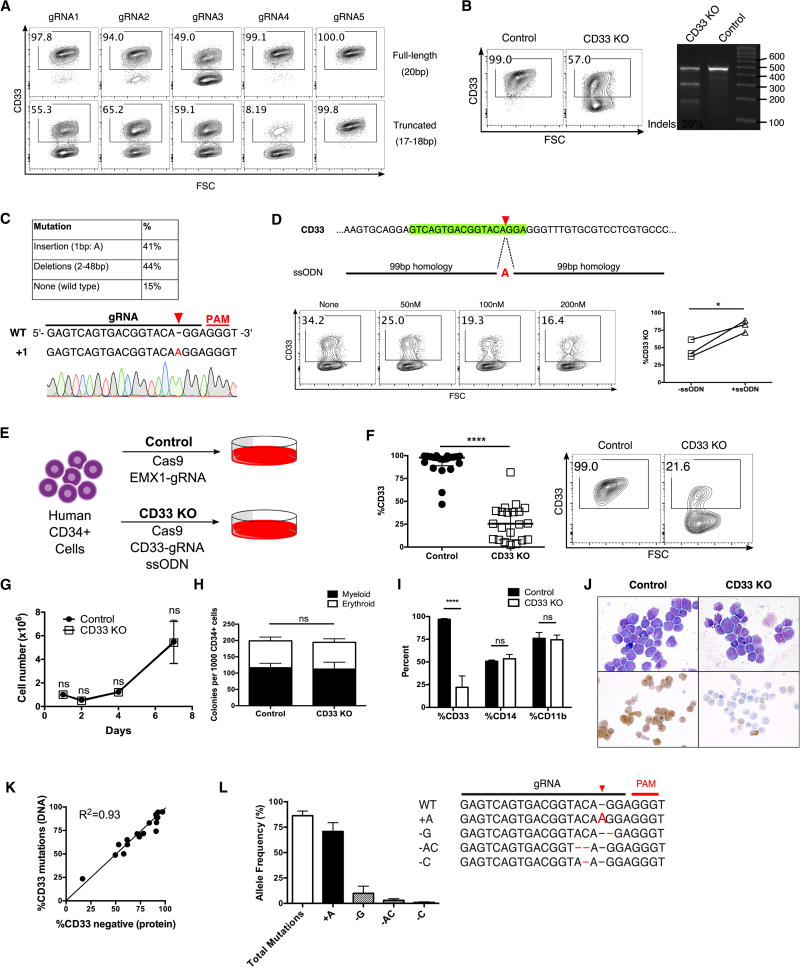
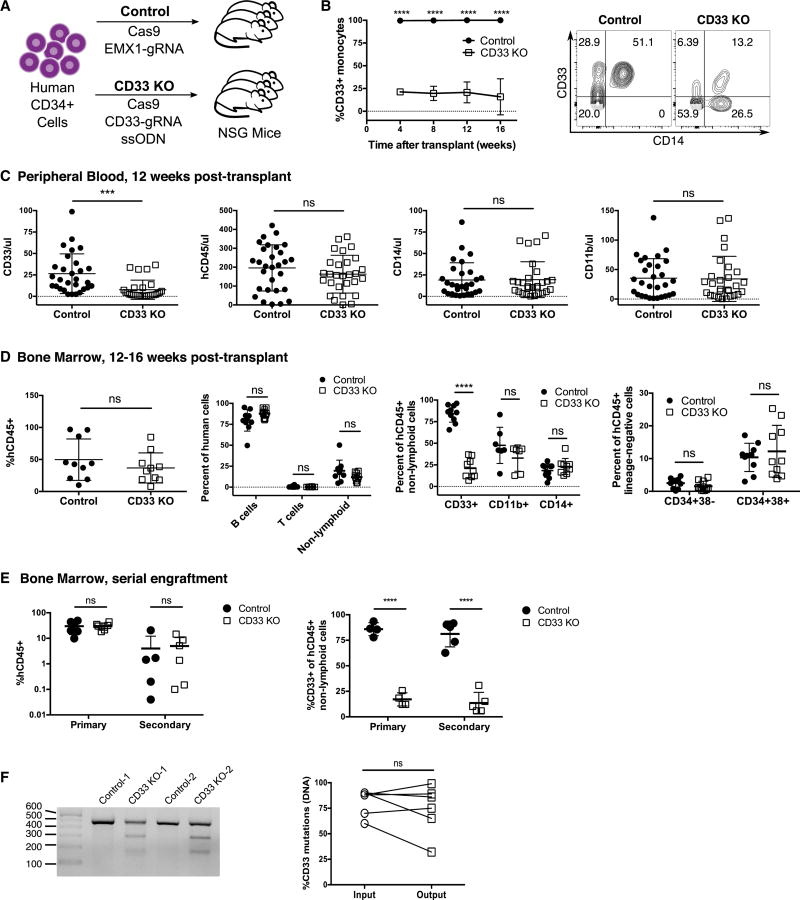
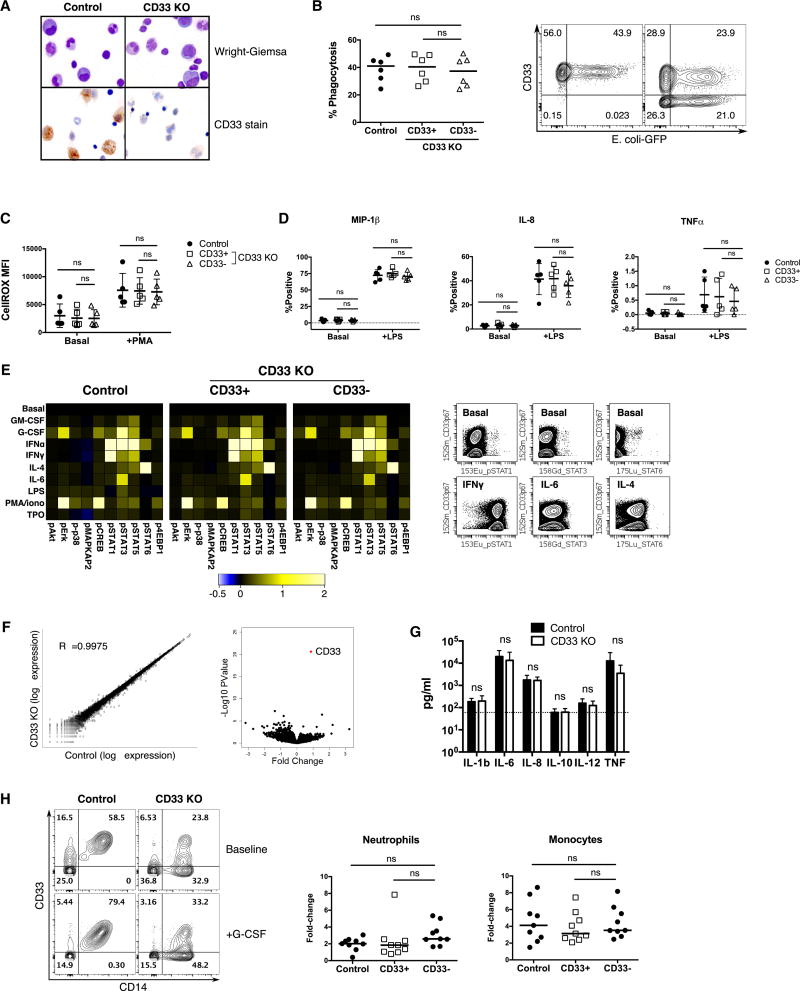
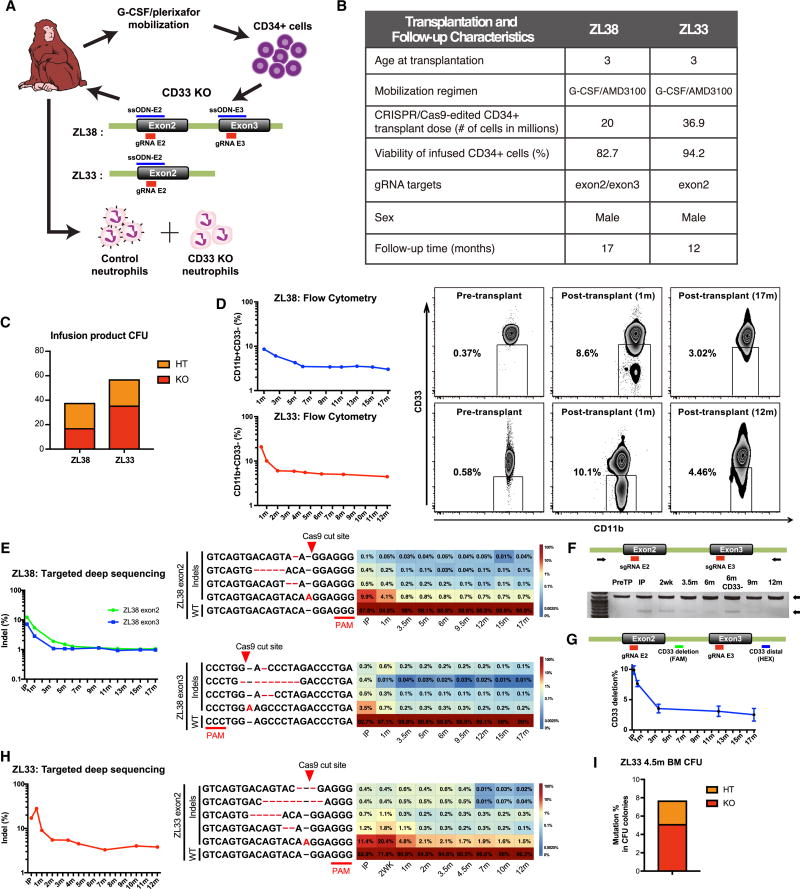
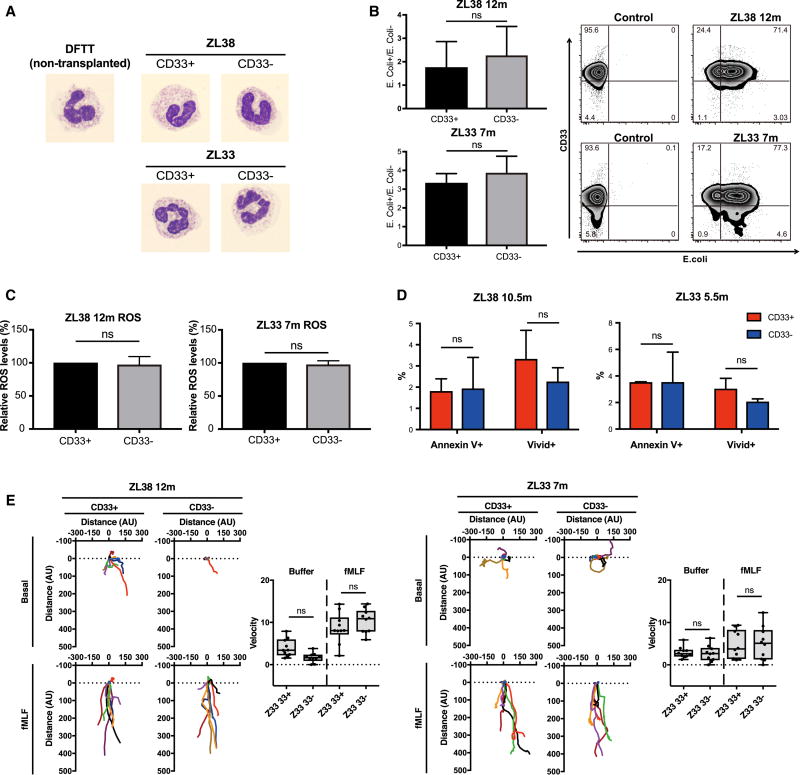
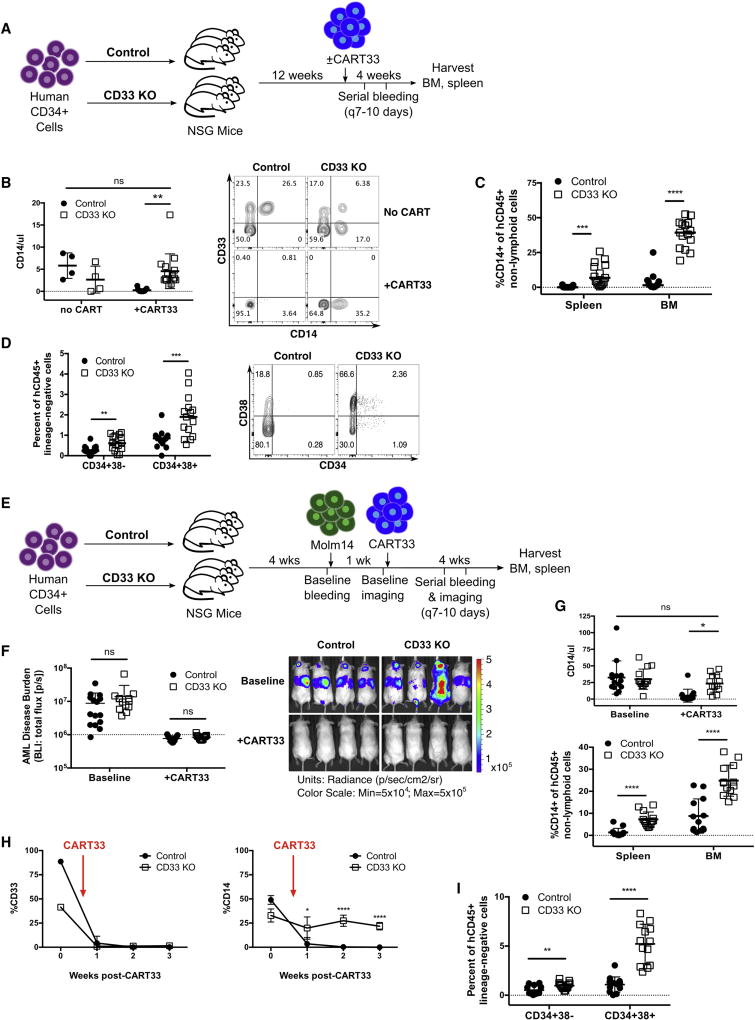
The absence of cancer-restricted surface markers is a major impediment to antigen-specific immunotherapy using chimeric antigen receptor (CAR) T cells. For example, targeting the canonical myeloid marker CD33 in acute myeloid leukemia (AML) results in toxicity from destruction of normal myeloid cells. We hypothesized that a leukemia-specific antigen could be created by deleting CD33 from normal hematopoietic stem and progenitor cells (HSPCs), thereby generating a hematopoietic system resistant to CD33-targeted therapy and enabling specific targeting of AML with CAR T cells. We generated CD33-deficient human HSPCs and demonstrated normal engraftment and differentiation in immunodeficient mice. Autologous CD33 KO HSPC transplantation in rhesus macaques demonstrated long-term multilineage engraftment of gene-edited cells with normal myeloid function. CD33-deficient cells were impervious to CD33-targeting CAR T cells, allowing for efficient elimination of leukemia without myelotoxicity. These studies illuminate a novel approach to antigen-specific immunotherapy by genetically engineering the host to avoid on-target, off-tumor toxicity.

Keywords: CD33; CRISPR/Cas9 gene editing; acute myeloid leukemia; chimeric antigen receptor T cells; hematopoiesis; immunotherapy; non-human primate hematopoiesis.


Figures

Fig. 1
Fig. 1. Generation of CD33 KO human HSPC in vitro
(A) Full-length (20bp) and truncated (17–18bp guide RNAs (gRNAs) targeting CD33 were tested in for editing efficiency in a human AML cell line, Molm14, after electroporation with Cas9. (B) Human CD34+ cells were electroporated with Cas9 protein and truncated CD33-targeting gRNA4 (panel A), and surface CD33 protein expression was assessed by flow cytometry (left) and DNA mutations were quantified by SURVEYOR assay (right) following 7 days of in vitro myeloid differentiation culture. (C) Sanger sequencing of individual alleles reveals a high proportion of mutations containing a single A insertion (top); representative chromatogram is shown (bottom). (D) A single-stranded oligodeoxynucleotide (ssODN) was designed to contain 99bp homology arms around the gRNA cut site and the A insertion mutation (top). CD34+ cells were electroporated with Cas9 protein/gRNA and different concentrations of the ssODN, after which CD33 expression was assessed by flow cytometry (bottom left) following 7 days of culture. Addition of the ssODN increases the frequency of CD33 mutations in three different donors in three independent experiments (bottom right). (E) Experimental schema: Human CD34+ cells were electroporated with either Cas9 complexed with EMX1-gRNA (Control), or Cas9/CD33-gRNA4 and the ssODN (CD33 KO) and cultured for 7 days. (F) Cultured CD33 KO CD34+ cells have decreased levels of surface CD33 expression by flow cytometry compared to controls (n=21, 18 different donors, 14 independent experiments). Representative flow cytometry plot is shown on right. (G) Control and CD33 KO CD34+ cells maintained in StemSpan SFEM with SCF 100ng/ml, Flt3L 100ng/ml, TPO 50ng/ml, IL-6 50ng/ul show similar growth kinetics. (n=3, 3 donors, 2 independent experiments) (H) CD34+ cells were plated in Methocult H4435 one day after electroporation and scored for colony formation after 14 days. (I) Methocult colonies were resuspended in liquid media and flow cytometry was performed for the myeloid markers CD33, CD14 and CD11b. (n=3, 3 donors, 2 independent experiments) (J) In vitro differentiated control and CD33 KO HSPC show normal myeloid morphology by Wright-Giemsa staining with decreased CD33 expression by immunocytochemistry in the CD33 KO cells only. (K) Comparison of levels of CD33 protein loss by flow cytometry and CD33 gene mutations by TIDE analysis show a high level of correlation (n=18). %CD33 negative (protein) was calculated as follows: {1 − (%CD33+ in KO)/(%CD33+ in control)}*100. (L) Targeted amplicon sequencing of the gRNA site from CD33 KO cell DNA confirms high levels of total mutations, with the majority consisting of A insertions.
Fig. 2
Fig. 2. CD33 KO human HSPC show sustained loss of CD33 in vivo without impairment of growth and differentiation
(A) NSG mice were injected with 1–5×10⁵ control or CD33 KO HSPC and human CD45+ hematopoiesis was analyzed over time. (B) Longitudinal monitoring of human CD14+ monocytes show a decreased fraction of CD33+ monocytes in CD33 KO HSPC-engrafted mice compared to controls. Representative flow plot is shown on right. ns: not significant (p>0.05); ****p<0.0001 (unpaired t-test) (C) CD33 KO HSPC-engrafted mice have significantly decreased numbers of CD33+ cells in the peripheral blood at 12 weeks post-transplant, while total numbers of cells expressing CD45, CD14 and CD11b are similar to controls (n=57 mice, 4 independent experiments, 5 donors). ns: not significant (p>0.05); ***p<0.001 (unpaired t-test) (D) Bone marrow harvested from mice after 12–16 weeks of HSPC engraftment show equivalent levels of human CD45+ cell engraftment, with differentiation into both lymphoid (B cells: CD19+, T cells: CD3+) and myeloid lineages, while myeloid cells have markedly decreased levels of CD33. Human hematopoietic stem (CD34+38−) and progenitor (CD34+38+) cell levels are comparable between control and CD33 KO HSPC engrafted mice. ****p<0.001; ns: not significant (p>0.05) (unpaired t-test) (n=20 mice, 3 independent experiments, 3 donors). (E) Marrow was harvested from mice engrafted with control or CD33 KO HSPC after 16 weeks (primary), and human CD45+ cells were purified and injected into secondary recipients (secondary) (each donor transplanted into a single recipient) and monitored for an additional 12 weeks. Both groups of mice show sustained human hematopoiesis after long-term engraftment (left), and the CD33 KO HSPC-engrafted group has persistent loss of CD33 expression (right). (n=12 mice, 3 independent experiments, 4 donors). ****p<0.001; ns: not significant (p>0.05) (unpaired t-test) (F) PCR performed on marrow from secondary recipients confirms continued presence of mutations in the CD33 gene by SURVEYOR assay (left). Mutation levels as quantified by TIDE are similar between the initial infusion product (input) and the bone marrow 28 weeks after transplantation (output) (right). ns: not significant (p>0.05) (paired t-test). All data are represented as means ± SD.
Fig. 3
Fig. 3. CD33 is not essential for human myeloid cell function
(A) Bone marrow cells from NSG mice engrafted with control or CD33 KO human CD34+ cells exhibit normal human myeloid cell morphology, with decreased CD33 expression confirmed by immunocytochemistry. (B–F) Control and CD33 KO CD34+ cells were differentiated in vitro with SCF, TPO, Flt3L, IL-3, IL-6 and GM-CSF for 7–14 days prior to functional assays. CD33+/− cells within the CD33 KO group were gated separately by flow cytometry for analysis, as compared to ungated control cells which are all CD33+. (B) In vitro differentiated CD33 KO myeloid cells retain phagocytosis ability as measured by internalization of pHrodo green E. coli bioparticles (n=6/group, one-way ANOVA). (C) Levels of reactive oxygen species (ROS) production after phorbol myristate acetate (PMA) stimulation are similar among the three groups of cells. ROS production was measured by fluorescence of CellROX Green reagent (n=5/group, one-way ANOVA). (D) Cytokine production as measured by intracellular staining is not significantly different in CD33− cells as compared to internal CD33+ or unedited controls, whether under basal conditions or after lipopolysaccharide (LPS) stimulation (n=5/group, one-way ANOVA). (E) Cells were treated with the indicated stimuli (GM-CSF, G-CSF, IFNα, IFNγ, IL-4, IL-6, LPS, PMA/ionomycin, or TPO) for 15 min followed by mass cytometry analysis using antibodies to 20 surface markers and 10 phosphoproteins for a comprehensive analysis of signaling pathways (n=3/group). Control (ungated) and CD33+/− gated cells within the CD33 KO cell group display identical signaling profiles within the myeloid progenitor population as defined by SPADE analysis (see fig. S2 for SPADE diagram). Representative plots of CD33 KO cells show that CD33− and residual CD33+ cell populations respond to the indicated stimuli to the same degree (gated on live CD64+HLA-DR+ events). (F) Gene expression profile of in vitro differentiated control and CD33 KO CD34+ cells (with 70–85% CD33 KO) were analyzed by RNA-seq (n=5/group). Log-scale scatter plot of mean gene expression values of control and CD33 KO samples show high correlation between the two groups (left), while volcano plot shows CD33 as the most significant differentially expressed gene (right). (G) LPS injection induces similar levels of human inflammatory cytokine secretion in the serum of mice engrafted with control or CD33 KO HSPC (control: n=10, CD33 KO: n=12). ns: not significant (p>0.05) (unpaired t-test) (H) NSG mice engrafted with control or CD33 KO HSPC were injected with G-CSF and numbers of peripheral blood human myeloid cells were evaluated before and after treatment (n=9/group, 2 donors, 2 independent experiments). Representative flow cytometry plot shows increase in both %CD14+CD33+ and %CD14+CD33− cells in the CD33 KO group after G-CSF injection (left), gating on single live human CD45+ events. Increased numbers of neutrophils (CD66b+) and monocytes (CD14+) were detected in the peripheral blood of both cohorts after G-CSF, and within the CD33 KO HSPC-engrafted mice no difference in CD33+ or CD33− cell populations was detected (right) (one-way ANOVA). ns: not significant (p>0.05).
Fig. 4
Fig. 4. CD33 KO HSPC show long-term multi-lineage engraftment in rhesus macaques
(A) Schema of the rhesus macaque (RM) autologous CD33 KO transplantation model. RM were mobilized with G-CSF and plerixafor followed by leukapheresis, and CD34+ cells were selected and electroporated with Cas9 protein, CD33-targeting gRNA(s), and ssODN homologous to the targeted exons. For the first RM, ZL38, two gRNAs targeting the CD33 exon 2 and 3 coding sequence were used, with ssODNs designed with a single A insertion for each gRNA (ssODN-E2, ssODN-E3). For the second RM, ZL33, a single gRNA targeting the CD33 exon 2 with ssODN-E2 was used. Grey boxes indicate exons; Green lines indicate introns. Following gene editing, autologous CD34+ cells were re-infused back into the RM and presence of control (CD33+CD11b+) and CD33 KO (CD33−CD11b+) neutrophils was serially monitored in the peripheral blood by flow cytometry. (B) Transplantation characteristics of ZL38 and ZL33. (C) Cells from the infusion product were plated in MethoCult and individual colonies were harvested after 14 days. Each CFU colony was analyzed by PCR and sequencing of the CD33 gRNA targeted region. Percentage of CFU with heterozygous (HT) and homozygous (KO) mutations were scored. (D) Loss of CD33 expression on CD11b+ cells was longitudinally monitored on neutrophils from ZL38 and ZL33 by flow cytometry. Representative flow cytometry plot of pre-transplant, early (1 month) and late time point (ZL38; 17 months, ZL33; 12 months) post-transplantation are shown. (E) Left: Targeted deep sequencing of CD33 exon2 and 3 was performed in the infusion product and neutrophils of ZL38. Indel frequency of each region was plotted over time starting from the infusion product (IP), demonstrating the percentage of reads containing indels within 18bp gRNA window. Right: Individual indel types were identified by targeted deep sequencing analysis in ZL38 for exon2 and exon3 targets. The most abundant indel types in at least one of the depicted samples are plotted over time in all samples. PAM sequence and expected Cas9 cut site are shown. Insertions or deletions are shown in red font. Heatmap showing the read count contribution of indels over time during hematopoietic reconstitution in ZL38. Each row in the heatmap corresponds to an individual indel type and each column to a sample. Color gradient depicts the fractional contribution of individual indel to each sample. IP: infusion product. WT: wild type. (F) PCR was performed in pre-transplant and post-transplant neutrophils of ZL38 at indicated time points. Intact locus 1175 bp PCR product and a shorter 614 bp PCR product resulting from a deletion between the CD33 exon2 and exon3 target sites. (G) Deletion rate between the two gRNA cut sites was quantified by digital droplet PCR (ddPCR) with probes targeting the CD33 deletion and distal regions. Relative expression of each probe was calculated and plotted over time as CD33 deletion %. Error bars represent the standard deviation of the replicates. (H) Left: Targeted deep sequencing of CD33 exon2 was performed on the infusion product and neutrophils of ZL33. Indel frequency of CD33 exon2 was plotted over time. Right: Individual indel types identified by targeted deep sequencing analysis is depicted as in (E). (I) Bone marrow was collected 4.5 months post-transplantation from ZL33. CD34+ cells were selected and plated in MethoCult. After 14 days, individual CFU were analyzed by PCR and sequencing of gRNA targeting region (CD33 exon 2). Percentage of heterozygous (HT) and homozygous (KO) mutations were scored.
Fig. 5
Fig. 5. Loss of CD33 does not perturb rhesus macaque neutrophil functions
(A) Representative images of neutrophils from a non-transplanted control (DFTT) and sorted CD11b+CD33+ and CD11b+CD33− neutrophils from ZL38 and ZL33 stained with Giemsa and visualized by light microscopy at 1000× magnification. (B) Bacterial phagocytosis of internalized pHrodo Green E. coli bioparticles by CD11b+CD33+ or CD11b+CD33− cells from ZL38 and ZL33 at 7 or 12 months post-transplantation respectively. Bar graph (left) shows the mean ± SD, n=3. ns: not significant and the panel (right) shows representative flow cytometric plots. (C) Cellular reactive oxygen species (ROS) levels were detected by flow cytometry (CellROX™ Green Flow Cytometry Assay Kit) within CD11b+CD33+ or CD11b+CD33− gated cells at 7 or 12 months from ZL33 or ZL38, respectively. The relative ROS level was defined as the measured ROS level within the CD11b+CD33− cells relative to the level within the CD11b+CD33+ cells, which was set to 100%. (D) Percentage of annexin V+ or ViVid+ cells within the CD11b+CD33+ or CD11b+CD33− gates in blood cells collected at 10.5 months for ZL38 and 5.5 months for ZL33. Mean ± SD, n=3. ns: not significant (p>0.05). (E) Neutrophil chemotaxis of sorted CD11b+CD33+ or CD11b+CD33− cells measured using an EZ-TAXIScan on cells collected at 7 or 12 months post-transplantation from ZL33 or ZL38, respectively. Basal and fMLF conditions represent random migration and directed migration of neutrophils respectively. Ten randomly chosen cells were electronically traced using the acquired images and the paths of the cells plotted. Individual tracks are represented by different colors and were recorded over 1 hour. Scattergrams summarize the average velocities of the individual cells. ns: not significant. All data are represented as means ± SD.
Fig. 6
Fig. 6. Human myeloid cells lacking expression of CD33 are resistant to CD33-targeted therapy
(A) Experimental schema. NSG mice engrafted with control or CD33 KO HSPC were treated with autologous anti-CD33 CAR T cells (CART33), followed by serial retro-orbital bleeding. Mice were euthanized and bone marrow (BM) and spleen were analyzed 4 weeks after CART33 infusion. A subset of mice in each group did not receive CART33. (Control-no CART33: n=4, CD33 KO-no CART33: n=4, Control+CART33: n=15, CD33 KO+CART33: n=15, 2 independent experiments, 2 donors). (B) Numbers of CD14+ monocytes in the peripheral blood of CD33 KO HSPC-engrafted mice after CART33 treatment are similar to control HSPC mice without CART33 treatment (one-way ANOVA) (left). Representative flow cytometry plot (right) shows complete eradication of CD33+ cells in both groups after CART33 treatment, which leads to loss of CD14+ monocytes in the control HSPC-engrafted mice, while CD14+CD33− cells are still detected in CD33 KO HSPC-engrafted mice. Gated on live singlet human CD45+CD19−CD3− cells. (C) CD14+ cells are present in significantly higher numbers in the spleen and bone marrow of CD33 KO HSPC-engrafted mice after CART33 treatment compared to controls (unpaired t-test). (D) Bone marrow human stem cells (CD34+38−) and progenitors (CD34+38+) are significantly higher after CART33 treatment in CD33 KO HSPC mice compared to controls (unpaired t-test). Representative flow cytometry plot showed on right, gated on live singlet human CD45+ lineage-negative cells. (E) Experimental schema. Control or CD33 KO HSPC-engrafted mice were injected with Molm14-GFP/luciferase prior to treatment with CART33 (n=26 mice, 2 independent experiments, 3 donors). (F) Mice show the expected reduction in AML burden as measured by bioluminescent imaging (BLI) after CART33 treatment (unpaired t-test). (G) Co-engraftment of AML does not impair the survival of CD33− negative myeloid cells in vivo after CART33 treatment in the peripheral blood (top; one-way ANOVA), spleen and bone marrow (bottom; unpaired t-test). (H) Peripheral blood CD33 levels decline after CART33 treatment in both cohorts of mice, resulting in undetectable levels of CD14+ cells in the control mice, while CD14+ cells persist in CD33 KO HSPC-engrafted mice (shown is one representative cohort of mice, single donor, n=4/group). (I) Bone marrow human stem and progenitor cells continue to survive CART33-mediated attack even in the setting of coexisting AML (unpaired t-test). All data are represented as means ± SD. ns: not significant (p>0.05); **p<0.01; ***p<0.001; ****p<0.0001.

References

    1. Appelbaum FR, Bernstein ID. Gemtuzumab ozogamicin for acute myeloid leukemia. Blood. 2017;130:2373. - PubMed
    1. Behbehani GK, Samusik N, Bjornson ZB, Fantl WJ, Medeiros BC, Nolan GP. Mass cytometric functional profiling of acute myeloid leukemia defines cell cycle and immunophenotypic properties that correlate with known responses to therapy. Cancer Discovery 2015 - PMC - PubMed
    1. Biasco L, Pellin D, Scala S, Dionisio F, Basso-Ricci L, Leonardelli L, Scaramuzza S, Baricordi C, Ferrua F, Cicalese MP, et al. In Vivo Tracking of Human Hematopoiesis Reveals Patterns of Clonal Dynamics during Early and Steady-State Reconstitution Phases. Cell Stem Cell. 2016;19:107–119. - PMC - PubMed
    1. Brinkman-Van der Linden EC, Angata T, Reynolds SA, Powell LD, Hedrick SM, Varki A. CD33/Siglec-3 binding specificity, expression pattern, and consequences of gene deletion in mice. Molecular and cellular biology. 2003;23:4199–4206. - PMC - PubMed
    1. Cao H, Crocker PR. Evolution of CD33-related siglecs: regulating host immune functions and escaping pathogen exploitation? Immunology. 2011;132:18–26. - PMC - PubMed

Publication types

MeSH terms

Substances