

Centrosomal ALIX regulates mitotic spindle orientation by modulating astral microtubule dynamics
- PMID: 29858227
- PMCID: PMC6028035
- DOI: 10.15252/embj.201797741
Centrosomal ALIX regulates mitotic spindle orientation by modulating astral microtubule dynamics
Abstract
The orientation of the mitotic spindle (MS) is tightly regulated, but the molecular mechanisms are incompletely understood. Here we report a novel role for the multifunctional adaptor protein ALG-2-interacting protein X (ALIX) in regulating MS orientation in addition to its well-established role in cytokinesis. We show that ALIX is recruited to the pericentriolar material (PCM) of the centrosomes and promotes correct orientation of the MS in asymmetrically dividing Drosophila stem cells and epithelial cells, and symmetrically dividing Drosophila and human epithelial cells. ALIX-deprived cells display defective formation of astral microtubules (MTs), which results in abnormal MS orientation. Specifically, ALIX is recruited to the PCM via Drosophila Spindle defective 2 (DSpd-2)/Cep192, where ALIX promotes accumulation of γ-tubulin and thus facilitates efficient nucleation of astral MTs. In addition, ALIX promotes MT stability by recruiting microtubule-associated protein 1S (MAP1S), which stabilizes newly formed MTs. Altogether, our results demonstrate a novel evolutionarily conserved role of ALIX in providing robustness to the orientation of the MS by promoting astral MT formation during asymmetric and symmetric cell division.
Keywords: ALIX; MAP1S; microtubule; mitotic spindle orientation; γ‐tubulin.
© 2018 The Authors.
Figures

Brains dissected from Drosophila larvae were immunostained with anti‐ALIX (red), Asl (white) and α‐tubulin (green), and Hoechst (blue). Representative confocal micrographs of NBs in different mitotic phases (prometaphase to early telophase) are presented. In the upper panel, the location of the centrosomes is indicated with arrows and the centrosome with more accumulated ALIX is marked (*). Scale bars, 5 μm.
Brains of w 1118 larvae were stained with anti‐ALIX (white), anti‐Cnn (white) or anti‐Asl (white), and Hoechst (blue). The average ratios of centrosomal intensities (strongest/weakest) (± SE) of ALIX, Cnn, and Asl calculated from 77, 76, and 56 metaphase NBs, respectively, are indicated below the micrographs (from at least three experiments). Scale bars, 5 μm.
Ovaries dissected from adult flies were immunostained with anti‐ALIX (red), Asl (white) and α‐tubulin (green), and Hoechst (blue). Representative confocal micrographs of FECs in metaphase are presented. Scale bars, 5 μm.
HeLa cells were immunostained with anti‐ALIX (red), anti‐glutamylated tubulin (green), and Hoechst (blue). A widefield micrograph of a representative metaphase cell is shown in the left panel (scale bar, 5 μm), and the insets show close‐ups of the centrosomes. The white arrow indicates the direction of the line scan analysis performed in (E).
Line scan analysis of the fluorescent distribution of ALIX and glutamylated tubulin at the centrosomes. The average intensity (± SE) of 26 centrosomes from three independent experiments is shown graphically.
- A
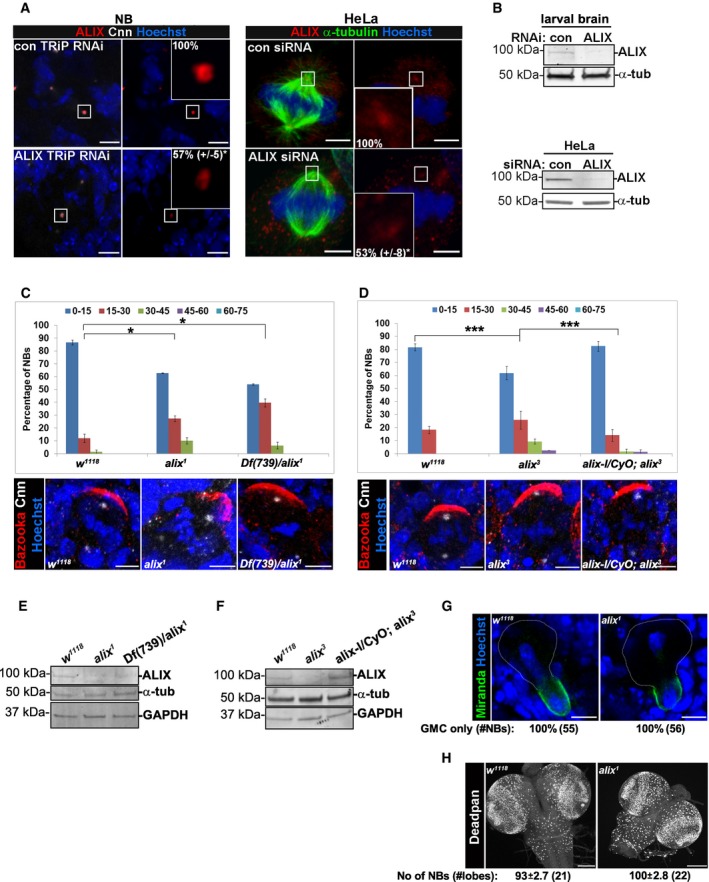
Brains of control TRiP RNAi and alix TRiP RNAi larvae were immunostained with anti‐ALIX (red), anti‐Cnn (white), and Hoechst (blue) (left panel). HeLa cells transfected with control or ALIX siRNA were stained with anti‐ALIX (red), anti‐α‐tubulin (green), and Hoechst (blue) (right panel). Scale bars, 5 μm. The average fluorescence intensity of centrosomal ALIX was determined and found to be decreased in ALIX‐depleted NBs (to 56.8 ± 5.1%, *P < 0.05, Student's t‐test) and HeLa cells (53.2 ± 8.3%, *P < 0.05, Student's t‐test) relative to their respective controls (set to 100%). The centrosomal average intensity of 35 control TRiP RNAi NBs, 28 alix TRiP RNAi NBs, 20 control siRNA HeLa cells, and 14 ALIX siRNA HeLa cells from three experiments (± SE) is presented.
- B
Brain lysates prepared from control or ALIX TRiP RNAi larvae (upper panel) or control and ALIX siRNA HeLa cells (lower panel) were subjected to Western blotting analysis to determine the expression levels of ALIX and α‐tubulin.
- C, D
Brains of w 1118, alix 1, and Df(739)/alix 1 larvae (C) or w 1118, alix 3, and alix‐l/CyO; alix 3 larvae (D) were immunostained with anti‐Bazooka (red), anti‐Cnn (white), and Hoechst (blue). Typical confocal images are shown. Scale bars, 5 μm. The average relative spindle angle (± SE) of (C) w 1118 = 48, alix 1 = 43, Df(739)/alix 1 = 50 NBs (three separate experiments) or (D), w 1118 = 95, alix 3 = 69, alix‐l/CyO; alix 3 = 52 (three separate experiments) were determined. Compared to w 1118 NBs, both alix 1 NBs and Df(739)/alix 1 NBs showed a greater variation of the relative spindle angle (*P < 0.05, ANOVA). No significant difference was observed between alix 1 NBs and Df(739)/alix 1 NBs (C). Likewise, alix 3 NBs displayed more variable relative spindle angles compared to either w 1118 NBs or alix‐l/CyO; alix 3 NBs (***P < 0.001, ANOVA) (D). However, there was not a significant different variation of the relative spindle angles between w 1118 NBs and alix‐l/CyO; alix 3 NBs.
- E, F
Western blotting analysis showed expression of ALIX in w 1118 larval brains, lack of detectable ALIX in the brains from alix 3 , alix 1, and Df(739)/alix 1 larvae and restored expression of ALIX in brains of alix‐l/CyO; alix 3 larvae. The immunodetectable levels of α‐tubulin and GAPDH (loading control) were also assessed.
- G
Brains of w 1118 and alix 1 larvae were stained with anti‐Miranda (green) and Hoechst (blue). The percentages of NBs in telophase with complete segregation into the future GMC are calculated (± SE) from 55 w 1118 NBs and 56 alix 1 NBs (three separate experiments). The future NB is outlined. Scale bars, 5 μm.
- H
Brains of w 1118 and alix 1 larvae were stained with anti‐Deadpan (white). The average number of NBs per brain lobe (± SE) was scored from 21 wild type and 22 alix 1 larval brains (three independent experiments). Scale bars, 10 μm.
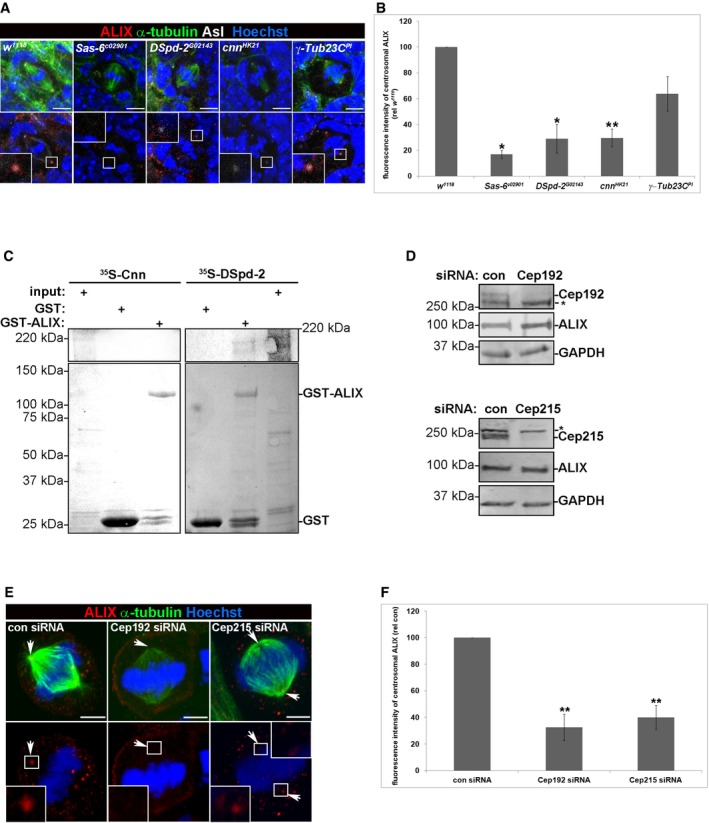
Confocal images of ALIX (red), Asl (white), α‐tubulin (green), and Hoechst (blue) in wild‐type (w 1118), Sas‐6 c02901, DSpd G02143, cnn HK21, and γ‐Tub23C PI NBs (scale bars, 5 μm). The insets show higher magnification of the boxed centrosomes.
The centrosomal fluorescence intensity of ALIX was measured, and the graph shows the average intensity (relative to w 1118 intensity) of three separate experiments (± SE), where in total 78 w 1118, 73 Sas‐6 c02901, 45 DSpd G02143, 61 cnn HK21, and 26 γ‐Tub23C PI NBs were analyzed. Statistically significant differences are indicated (*P < 0.05 and **P < 0.01, Student's t‐test).
GST or GST‐ALIX were incubated with in vitro translated 35S‐labeled Cnn or DSpd‐2 proteins. Binding was detected by autoradiography (upper panel), and levels of GST and GST‐ALIX were visualized by Ponceau S‐staining (lower panel).
HeLa cells were transfected with control, Cep192, or Cep215 siRNA. Efficient depletion of Cep192 and Cep215 was confirmed by Western blotting analysis, which also showed unchanged expression levels of ALIX. Unspecific bands, below Cep192 and above Cep215, are indicated with *. GAPDH, loading control.
Control, Cep192, or Cep215 siRNA‐transfected HeLa cells were immunostained with anti‐ALIX (red), anti‐α‐tubulin (green), and Hoechst (blue). Confocal micrographs are presented, and the insets show the indicated centrosomes (arrows) at higher magnification (scale bars, 5 μm).
The centrosomal ALIX fluorescence intensity was measured, and the graph shows the average intensity (relative to control siRNA cells) of three independent experiments (± SE), where in total 41 control siRNA, 40 Cep192 siRNA, and 39 Cep215 siRNA‐transfected cells were analyzed, **P < 0.01, Student's t‐test.

Brains were dissected from w 1118, alix 1, alix‐l/CyO; alix 1, and mud 4 larvae and stained with anti‐Bazooka (red), anti‐Cnn (white), and Hoechst (blue). Representative confocal images are shown. Scale bars, 5 μm. The graph summarizes the average variation of the relative spindle angles in w 1118 (n = 74), alix 1 (n = 96), alix‐l/CyO; alix 1 (n = 78), and mud 4 (n = 32) NBs (four separate experiments) (± SE). Compared to w 1118 or alix‐l/CyO; alix 1 NBs both alix 1 and mud 4 NBs showed greater variation in MS orientation (***P < 0.001, ANOVA).
Schematic illustration of the calculation of the relative spindle angle in NBs between the polarity axis (blue line), perpendicular to the line aligning the apical Bazooka crescent (red dotted line) and the MS axis (blue dotted line) going through the two centrosomes. The basal crescent is here indicated in green.
Brain lysates of w 1118, alix 1, and alix‐l/CyO; alix 1 larvae were immunoblotted for ALIX, α‐tubulin, and GAPDH (loading control).
Time‐lapse imaging of Asl‐YFP, α‐tubulin‐GFP in control (left panel), and alix 3 mutant (right panel) SOPs of the pupal notum. SOPs were identified by the apical meshwork of MTs (not shown). Time is indicated in min:sec. Mitotic cells are indicated with arrows. Scale bar represents 5 μm.
Quantification of the rotation angle (± SE) in control (n = 26) and alix 3 (n = 45) mutant SOPs (at least three separate experiments). **P < 0.01 (Student's t‐test) compared to control. In the boxplot the dot is the mean, the line is the median and the box represents the values included between 25 and 75 percentile.
Schematic view of the calculation of the rotation angle. The angle α1 represents the angle made between the midline (horizontal line) and the axis of the two centrosomes immediately prior to nuclear envelope breakdown (when the two centrosomes compress the nucleus). The angle α2 represents the angle between the midline and the axis of spindle at anaphase onset. The rotation angle is equal to the difference α1–α2.
Western blotting analysis of lysates from control Asl‐YFP, α‐tubulin‐GFP and Asl‐YFP, α‐tubulin‐GFP; alix 3 pupae showed absence of ALIX in the alix 3 homozygous mutant and unchanged expression of α‐tubulin and GAPDH (loading control) compared to control lysates.

Testes from wild‐type (w 1118) and alix 1 males were immunostained with anti‐FasIII (red), anti‐γ‐tubulin (red), anti‐phospho HistoneSer10 (PH3) (green), and Hoechst (blue). The MS axis spanning the centrosomes (indicated with arrows) was mislocalized in 23.4 ± 5.5% of the alix 1 mGSCs compared to 1.6 ± 1.6% of w 1118 mGSCs (± SE) (*P < 0.05, Student's t‐test). Scale bars, 5 μm.
Western blot showing ALIX expression in w 1118 testes but not in alix 1 testes, and equal expression of GAPDH (loading control) in both genotypes.
Quantification of the mitotic spindle rotation velocity (°/min) (± SE) of control (n = 26) and alix 3 mutant (n = 45) SOPs from centrosome separation until telophase as determined from the same live imaging movies as in Fig 3E. **P < 0.01 (Student's t‐test) compared to control. In the boxplot the dot is the mean, the line is the median and the box represents the values included between 25 and 75 percentile.
Western blotting analysis determining the expression levels of ALIX and α‐tubulin in Caco‐2 cells transfected with control siRNA, ALIX siRNA#2, or ALIX siRNA#3.
Caco‐2 cells described in (D) were grown in organoids, fixed, and stained with rhodamine‐phalloidin (red), anti‐α‐tubulin (green), and Hoechst (blue). Scale bars, 5 μm. The relative angle between the spindle axis and the polarity axis (perpendicular to the apical membrane indicated with an asterisk) was determined. The average distribution of relative angles (± SE) from at least three separate experiments (43 control, 41 ALIX siRNA#2, and 38 ALIX siRNA#3 cells) is shown. Both ALIX siRNA#2 and siRNA#3 cells displayed greater variation of the relative spindle angles than control siRNA cells (*P < 0.05, ANOVA with Dunnett's adjustment for multiple testing).
HeLa cells transfected with control, ALIX, Hrs, or CHMP4B siRNA were immunostained with anti‐α‐tubulin (green), anti‐γ‐tubulin (red), and Hoechst (blue). Z‐stacks (of 0.32 μm per plane) through metaphase cells were acquired and the number of confocal planes between the two centrosomes was determined, reflecting the MS tilt. Scale bars, 5 μm. The graph illustrates the average percentage of cells displaying centrosomes with the indicated number of z‐planes apart (± SE). Approximately 50% of controls displayed the two centrosomes 0‐3 z‐planes apart (as shown), whereas in ALIX‐deprived cells, the distance in z‐plane between the two centrosomes was generally longer (shown is a cell displaying centrosomes separated by 7 z‐planes) (**P < 0.01, ANOVA with Dunnett's adjustment for multiple testing). Centrosomes in focus are indicated with arrows. In total, 50 control cells, 43 ALIX‐, 48 Hrs‐, and 47 CHMP4B‐depleted cells were scored (four separate experiments).
Western blotting analysis determining the expression levels of ALIX, Hrs, CHMP4B, and GAPDH in HeLa cells transfected with control, ALIX, Hrs, or CHMP4B siRNA.
Lysates of HeLa Kyoto‐GFP‐tubulin‐mCherry‐Histone2B cells transfected with control siRNA or ALIX siRNA were immunoblotted for ALIX and GAPDH (loading control).
Live cell imaging of HeLa Kyoto‐GFP‐tubulin‐mCherry‐Histone2B cells depleted of ALIX or not was performed to assess cell cycle progression. Typical still images of control cell (upper panel) and ALIX‐depleted cells (lower panel). Time is indicated in min. The table below summarizes the duration of different cell cycle phases (± SE). Compared to control cells, ALIX‐depleted cells spend longer time in prometaphase (21.6 ± 1.4 versus 16.8 ± 0.9 min, **P < 0.01, Student's t‐test), metaphase (73.6 ± 14.8 versus 39 ± 4.2 min, **P < 0.01, Student's t‐test), and cytokinesis (it takes on average 60.4 ± 10.7 min before the intercellular bridge abscises in ALIX siRNA cells and only 41 ± 2.4 min in control cells, *P < 0.05, Student's t‐test).
The table shows that ALIX‐depleted cells are slightly more frequently arrested in metaphase (10.9%) compared to control cells (6.7%, *P < 0.05, Student's t‐test). As much as 65.2% of ALIX siRNA cells died during metaphase in contrast to only 2.3% of control siRNA cells (***P < 0.001, Student's t‐test).

Ovaries of adult female flies (w 1118, alix 1 and alix‐l/CyO; alix 1) were stained with rhodamine‐phalloidin (red), anti‐α‐tubulin (green), anti‐Cnn (white), and Hoechst (blue). Typical confocal micrographs of metaphase FECs are presented, and the apical membrane facing the egg chamber germ cells is indicated with *. Scale bar, 5 μm. The MS orientation was measured, and the graph shows the average percentage of FECs (w 1118, n = 45, alix 1, n = 45, alix‐l/CyO; alix 1, n = 39, from three independent experiments) with the indicated relative spindle angle (± SE). Statistically significant difference is indicated as ***P < 0.001 (ANOVA).
Schematic figure illustrating calculation of the relative spindle angle in FECs, between the polarity axis (blue line) perpendicular to the line aligning the apical membrane (red dotted line) and the MS axis (blue dotted line) spanning between the two centrosomes.
Lysates of ovaries from w 1118, alix 1 and alix‐l/CyO; alix 1 flies were immunoblotted for ALIX, α‐tubulin, and GAPDH (loading control).
The MS orientation was determined in metaphase cells in organoids of Caco‐2 cells transfected with control (n = 75), ALIX (n = 88), or NuMA (n = 79) siRNA (from three independent experiments). The graph shows the average percentage of Caco‐2 cells with the indicated relative spindle angle (± SE). Greater spindle angle variation was observed in ALIX‐ and NuMA‐depleted cells compared to control cells (***P < 0.001, ANOVA). Representative confocal images are shown where the cells are stained with rhodamine‐phalloidin (red), α‐tubulin (green), and Hoechst (blue). The apical membrane facing the lumen of the organoid is marked (*). Scale bar, 5 μm.
Lysates of control, ALIX, or NuMA‐depleted Caco‐2 cells were immunoblotted for NuMA, ALIX, α‐tubulin, and GAPDH (loading control).

- A–E
Brains of FRT82B con or FRT82B, alix 1 larvae in which clones were generated by the MARCM strategy were dissected and immunostained with: (A) anti‐aPKC (red), (B) anti‐Bazooka (red), (C) anti‐Brat (red), (D) anti‐PON (red), or (E) anti‐Miranda (red) as well as Hoechst (blue). Recombinant NBs are GFP‐positive (green) and shown in the lower panels (A–D) or highlighted (E). The GFP‐negative control cells are presented in the upper panel (A–D). Representative confocal images are presented (scale bars, 5 μm). The graphs shown represent the fluorescence intensities (mean ± SE) of: 15 FRT82B con and 18 FRT82B, alix 1 NBs (for aPKC), 13 FRT82B con and 22 FRT82B, alix 1 NBs (for Bazooka), 12 FRT82B con and 7 FRT82B, alix 1 NBs (for Brat), 9 FRT82B con and 23 FRT82B, alix 1 NBs (for PON), 19 FRT82B con and 33 FRT82B, alix 1 NBs (for Miranda) from three experiments. Significant differences are indicated (**P < 0.01, Student's t‐test).

- A
The MARCM strategy was used to generate alix mutant NBs clones (FRT82B, alix 1) or genetic equivalent control clones (FRT82B con) in the larval brain. Dissected brains were immunostained with anti‐α‐tubulin (red) and Hoechst (blue). Recombinant NBs are positively marked with GFP (green) and outlined. The presence or lack of astral MTs is indicated with arrows or asterisks, respectively. Scale bars, 5 μm. The average intensity of astral, total, and astral/total MT (± SE) in GFP‐positive relative to GFP‐negative control cells (set to 100%, indicated as dotted line in the graph) was calculated from three separate experiments (including 13 GFP‐negative FRT82B con NBs, 11 GFP‐positive FRT82B con NBs, 10 GFP‐negative FRT82B, alix 1 NBs, and 8 GFP‐positive FRT82B, alix 1 NBs) (*P < 0.05 and **P < 0.01, Student's t‐test).
- B
HeLa cells depleted of ALIX or not were immunostained with anti‐α‐tubulin (red), anti‐Pericentrin (green), and Hoechst (blue). Representative confocal images are presented. Scale bars, 5 μm. The graph shows MT intensities as percentage of control cells (± SE) obtained from 99 control and 90 ALIX siRNA‐transfected cells (data obtained from six separate experiments). Significant differences are noted as *P < 0.05 and ***P < 0.001 (Student's t‐test).
- C, D
Regrowth of MTs after cold‐induced depolymerization was performed using brains of w 1118 and alix 1 larvae, stained with anti‐α‐tubulin (red), anti‐Bazooka (green), and Hoechst (blue) (C) or HeLa cells depleted of ALIX or not stained with anti‐α‐tubulin (white) and anti‐Pericentrin (green) (D). Typical confocal images showing MT regrowth at given time points are shown (scale bars, 5 μm). The graphs show the time‐dependent MT intensities relative to the respective 0″‐samples (± SE) calculated from three independent experiments. In (C), 46, 64, 65, and 48 w 1118 NBs and 73, 37, 44, and 49 alix 1 NBs from 0, 30, 60, and 300″ were analyzed, respectively (*P < 0.05). In (D), 47, 40, and 42 control cells and 48, 47, and 47 ALIX‐depleted cells were calculated 0, 30″, and 420″ after regrowth, respectively (*P < 0.05, Student's t‐test).
- E
Brains as described in (A) were immunostained with anti‐γ‐tubulin (red) and Cnn (white, left panel) or anti‐Dgrip91 (red) and α‐tubulin (white, right panel), as well as Hoechst (blue). Recombinant NBs are positively marked with GFP (green). The confocal images show typical accumulation of centrosomal γ‐tubulin or Dgrip91, and the insets zoom in at the indicated centrosomes. Scale bars, 5 μm. The intensities of γ‐tubulin, Dgrip91, and Cnn in control NBs (GFP‐negative, set to 100%) and GFP‐positive, recombinant NBs are presented in the table (± SE), also indicating the number of NBs quantified (n) from three separate experiments (*P < 0.05, Student's t‐test).
- F
GST‐ALIX (lane 3), but not GST (lane 2) pulled out Dgrip91 and γ‐tubulin from larval brain lysates.
- G
GST or GST‐ALIX were incubated with in vitro translated 35S‐methionine‐labeled γ‐tubulin or Dgrip91. The upper panel shows the autoradiography indicating interaction between GST‐ALIX and radiolabeled γ‐tubulin or Dgrip91. The lower panel shows the Ponceau S‐stained membrane visualizing the levels of GST and GST‐ALIX. The experiment was performed at least three times and a representative result is presented.
- H
HeLa cells depleted of ALIX or not grown on coverslips were stained with anti‐γ‐tubulin (white), anti‐Pericentrin (red), and Hoechst (blue) before being examined by confocal fluorescence microscopy. The confocal images and insets show the centrosomal accumulation of γ‐tubulin and Pericentrin. Scale bars, 5 μm. The graph presents the average centrosomal intensities of γ‐tubulin and Pericentrin relative to control cells (set to 100%) calculated from three independent experiments (10 cells per condition/experiment) (± SE). Significant difference is noted as **P < 0.01 (Student's t‐test).
- I
Lysates of control or ALIX‐depleted HeLa cells were immunoblotted for ALIX, γ‐tubulin, α‐tubulin, and GAPDH (loading control).

A clonal analysis was applied to determine the distribution of α‐tubulin (red) in wild type and FRT82B, alix 1 SOPs labeled with Cut (green). The alix 1 SOPs were identified by the loss of nls‐GFP (blue). Arrows indicate astral MTs. Scale bars represent 10 μm. The astral and total MT intensities were calculated from nls‐GFP‐negative alix‐deficient SOPs relative to nls‐GFP‐positive control cells (set to 100%). The graph summarizes the average of 12 control cells and 7 alix 1 mutant SOPs (± SE). Compared to control SOPs the formation of astral MTs is reduced to 36.5 ± 10.9% in alix‐deprived SOPs (***P < 0.001, Student's t‐test). In control SOPs, the astral MTs constituted 17.2 ± 1.7% of the total MTs and this ratio was decreased to 7.5 ± 1.5% in alix‐deficient SOPs (***P < 0.001, Student's t‐test).
Ovaries from w 1118 and alix 1‐flies were stained with anti‐α‐tubulin (red), anti‐Asl (white), and Hoechst (blue). Typical confocal micrographs of w 1118 and alix 1 metaphase FECs are shown (scale bars, 5 μm). Compared to w 1118 FECs, the alix 1 FECs exhibited less astral MTs (± SE) (25.1 ± 2.7% of wild‐type, *P < 0.05 Student's t‐test) and total MTs (± SE) (49.3 ± 4.8% of wild‐type, **P < 0.01 Student's t‐test). Correspondingly, in w 1118 FECs the astral MTs represented 16.2 ± 2% of total MTs but only 9.2 ± 0.8% (± SE) in alix 1 FECs (***P < 0.001, Student's t‐test). In total, 37 w 1118 FECs and 39 alix 1 FECs from three separate experiments were analyzed.
MT regrowth assay was performed, and the dissected brains of w 1118 and alix 1‐mutant larvae were stained with anti‐α‐tubulin (red), anti‐Cnn (white), and Hoechst (blue). Typical images of interphase NBs allowed regrowing MT for 0, 30, 60, and 300 s are shown (scale bars, 5 μm). The total MT intensities were determined (of 126, 113, 87, and 62 w 1118 NBs and 118, 127, 106, and 76 alix 1 NBs at 0, 30, 60, and 300″ regrowth, respectively) and shown in the graph as the average of three separate experiments (± SE). *P < 0.05 (Student's t‐test).
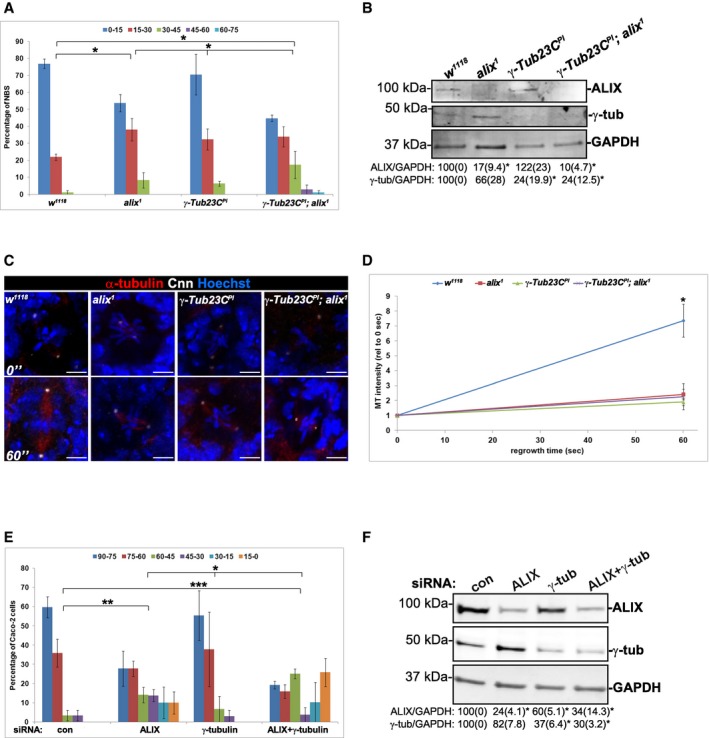
The MS orientation was determined in metaphase NBs from brains dissected from wild‐type (w 1118), alix 1, γ‐Tub23C PI or γ‐Tub23C PI ; alix 1 larvae. Compared to w 1118 , significantly greater variation in the relative spindle angles was observed in alix 1 NBs and γ‐Tub23C PI ; alix 1 NBs (*P < 0.05, ANOVA). The γ‐Tub23C PI ; alix 1 NBs displayed significantly greater variation of their spindle orientations than either alix 1 or γ‐Tub23C PI NBs (*P < 0.05, ANOVA). The graph shows the average percentage of NBs with the indicated relative spindle angles (± SE) from a total of 57 w 1118 NBs, 55 alix 1 NBs, 76 γ‐Tub23C PI NBs, and 62 γ‐Tub23C PI ; alix 1 NBs (three independent experiments).
Lysates of the respective genotypes were immunoblotted for ALIX, γ‐tubulin, and GAPDH (loading control). The average expression of ALIX or γ‐tubulin (relative to GAPDH) from three independent experiments is given below (± SE), and significant differences are indicated as *P < 0.05, Student's t‐test.
Dissected brains of w 1118, alix 1, γ‐Tub23C PI, and γ‐Tub23C PI ; alix 1 larvae were subjected to MT regrowth assay and stained with anti‐α‐tubulin (red), anti‐Cnn (white), and Hoechst (blue). Representative images of NBs after 0 and 60 s regrowth are presented. Scale bars, 5 μm.
The MT intensities after 0 and 60 s regrowth were determined, here presented as the average of three separate experiments (± SE) where in total 27 w 1118‐0″, 28 w 1118‐60″, 26 alix 1‐0″, 19 alix 1‐60″, 28 γ‐Tub23C PI‐0″, 26 γ‐Tub23C PI‐60″, 28 γ‐Tub23C PI ; alix 1‐0″, and 23 γ‐Tub23C PI ; alix 1‐60″ NBs were analyzed. Compared to w 1118‐NBs, significantly less MT polymerized in alix 1, γ‐Tub23C PI, or γ‐Tub23C PI ; alix 1 NBs (*P < 0.05, Student's t‐test).
The relative spindle angle between the polarity axis perpendicular to the apical phalloidin‐stained F‐actin surface and the MS was determined in metaphase Caco‐2 cyst cells transfected with control, ALIX, or/and γ‐tubulin siRNA (29, 29, 18, and 32 metaphase cells, respectively, were analyzed from three separate experiments). Compared to control cells, depletion of either ALIX or both ALIX and γ‐tubulin induced a significantly increased randomization of the relative spindle angles (**P < 0.01 and ***P < 0.001, ANOVA). Caco‐2 cells depleted of ALIX+γ‐tubulin showed a greater variation in the spindle angles compared to depletion of ALIX or γ‐tubulin (*P < 0.05, ANOVA). ALIX‐depleted cells showed greater spindle angle variation than γ‐tubulin‐depleted cells (*P < 0.05, ANOVA).
Efficient knockdown of ALIX and γ‐tubulin relative to GAPDH (loading control) was verified by Western blotting analysis, and the average expression of ALIX or γ‐tubulin relative to GAPDH (± SE) is given below (*P < 0.05, Student's t‐test).

- A, B
The relative spindle angle between the polarity axis [perpendicular to the apical surfaces stained with phalloidin (A) or Bazooka (B)] and spindle axis (defined by γ‐tubulin‐stained centrosomes) was determined in wild‐type (w 1118) and alix 1 FECs (A) or NBs (B) incubated at room temperature (RT) or ice for 40 min. The graphs show the percentage of FECs or NBs displaying relative spindle angle 90–75° versus 75–0° or 0–15° versus 15–90°, respectively. The graphs represent the results from three separate experiments analyzing 33 w 1118 FECs‐RT (black bars), 44 w 1118 FECs‐ice (light gray bars), 38 alix 1 FECs‐RT (dark gray bars), 46 alix 1 FECs‐ice (white bars) (A) or 32 w 1118‐NBs‐RT (dark blue bars), 64 w 1118 NBs‐ice (light blue bars), 56 alix 1 NBs‐RT (dark gray bars), and 63 alix 1 NBs‐ice (light gray bars) (B) (± SE), respectively. **P < 0.01, Student's t‐test.
- C
Brains from w 1118 and alix 1 larvae were stained with anti‐acetylated tubulin (green), anti‐Cnn (white), anti‐α‐tubulin (red), and Hoechst (blue). Scale bars, 5 μm. The fluorescence intensities of acetylated MT, total MT, and acetylated MT relative to total MT of 66 w 1118 NBs and 65 alix 1 NBs obtained from three independent experiments are shown graphically (± SE), *P < 0.05, and **P < 0.01 (Student's t‐test).
- D
Control or ALIX‐depleted HeLa cells grown on coverslips were immunostained with anti‐acetylated tubulin (green), anti‐α‐tubulin (red), anti‐Pericentrin (white), and Hoechst (blue). Scale bars, 5 μm. The fluorescence intensities of acetylated MT, total MT, and acetylated MT/total MT of 30 control and 28 ALIX‐depleted HeLa cells are shown in the graph (± SE) (three separate experiments). **P < 0.01, Student's t‐test.
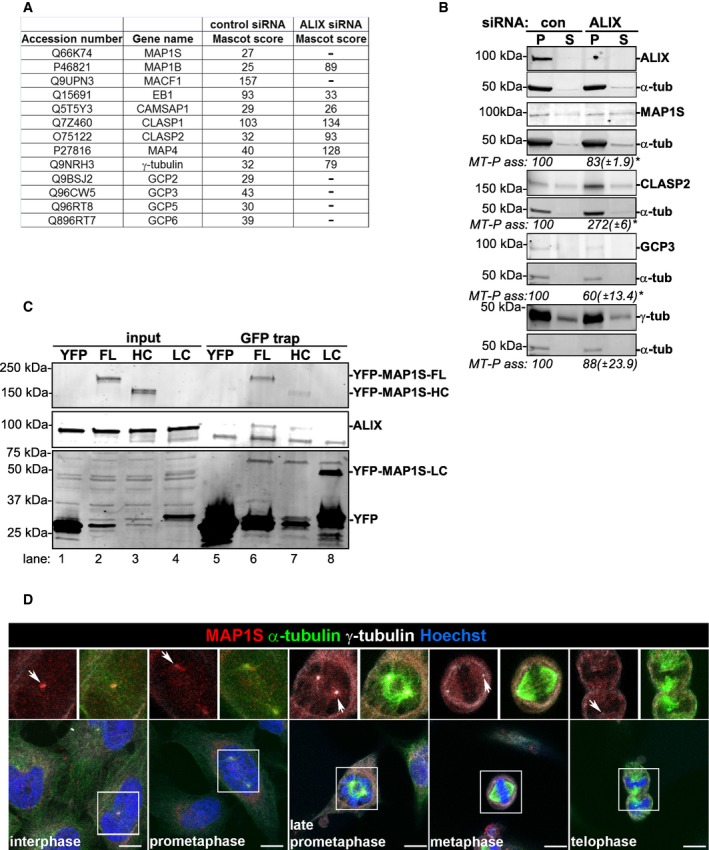
The table shows the Swissprot accession number, gene name, and the Mascot score of MAPs, GCPs, and γ‐tubulin identified in MT‐pellet fractions of control and ALIX siRNA‐transfected cells by mass spectrometry analysis (one experiment). These are also highlighted in the full dataset presented in Dataset EV1.
HeLa cells transfected with control or ALIX siRNA were fractionated into MT‐pellet (P) and corresponding supernatant (S) containing non‐polymerized tubulin. The protein levels of ALIX, MAP1S, α‐tubulin, CLASP2, GCP3, and γ‐tubulin in these fractions were determined by Western blot analysis. The levels of MT‐P‐associated MAP1S, CLASP2, GCP3, or γ‐tubulin (relative to α‐tubulin) were determined using the Odyssey software. The protein level ((MAP/GCP/γ‐tubulin)/α‐tubulin intensities) was normalized to the control samples (set to 100%), and the average of three separate experiments (± SE) is shown below the respective panels. *P < 0.05, Student's t‐test.
Lysates of HeLa cells transiently transfected with pEYFP‐C1, pEYFP‐MAP1S‐full length (FL), heavy chain (HC), or light chain (LC) were applied in GFP‐trap analysis before SDS–PAGE. The membrane was probed with anti‐ALIX and anti‐GFP.
Confocal micrographs of HeLa cells stained with anti‐MAP1S (red), anti‐γ‐tubulin (white), anti‐α‐tubulin (green), and Hoechst (blue) in different cell cycle phases are shown. Scale bars, 5 μm. MAP1S is clearly located at the centrosomes during interphase and starts to translocate onto the generated MS at prometaphase (centrosomes are indicated with arrows). Some MAP1S is still detected at the centrosomes from prometaphase to telophase, but not as clearly as during interphase.

- A
HeLa cells transfected with control or ALIX siRNA were fixed, permeabilized, and stained with anti‐MAP1S (red), anti‐γ‐tubulin (white), and Hoechst (blue). Interphase cells are shown, and the insets show close‐ups of the centrosomes. Scale bars, 5 μm.
- B
The fluorescence intensity of centrosomal MAP1S was determined, and the graph shows the average of three independent experiments (± SE), in which in total 52 control and 36 ALIX siRNA cells were analyzed. Significant difference is indicated as *P < 0.05 (Student's t‐test).
- C
HeLa cells were transfected with control, ALIX, MAP1S, or ALIX + MAP1S siRNA, and the expression of ALIX, MAP1S, and GAPDH (loading control) was determined by Western blotting analysis. Representative results are presented.
- D, E
Cells treated as in (C) were immunostained with anti‐α‐tubulin (white), Hoechst (blue) (D), and anti‐acetylated tubulin (green) (E). Scale bars, 5 μm. The intensities of astral MTs relative to total MTs were determined from confocal microscopy images, and the graph in (D) shows the average of four separate experiments (10 cells per condition/experiment) (± SE). *P < 0.05 and **P < 0.01, Student's t‐test. The relative intensity of acetylated MT relative to total MT was determined in (E). The average of four separate experiments (10 cells per condition/experiment) is graphically presented (± SE). Significant differences are indicated as *P < 0.05 (Student's t‐test).
- F
The regrowth of MTs (i.e., total tubulin intensity) was assessed in cells incubated at 37°C for 0, 60, and 150 s after ice‐induced depolymerization (for 30 min). The graph represents the average of three independent experiments (calculating 10 cells per time point for each condition/experiment) (± SE). Significant differences are noted as *P < 0.05, Student's t‐test.
- G
HeLa cells transfected with control or ALIX siRNA grown on coverslips were transiently transfected with pEYFP‐C1 (green), pEYFP‐MAP1S (green), pEGFP‐C1 (green), or pEGFP‐CLASP2α (green) and immunostained with anti‐α‐tubulin (white), anti‐Pericentrin (red), and Hoechst (blue). Scale bars, 5 μm.
- H
The lengths and numbers of astral MTs of HeLa cells treated as in (G) were measured (LSM software, version 3.2). The graphs show the average numbers (± SE) based on calculating 30 control siRNA + YFP cells, 23 control siRNA + YFP‐MAP1S cells, 30 ALIX siRNA + YFP cells, 30 ALIX siRNA + YFP‐MAP1S cells, 28 control siRNA + GFP cells, 30 control siRNA + GFP‐CLASP2α cells, 30 ALIX siRNA + GFP cells, and 29 ALIX siRNA + GFP‐CLASP2α cells from three separate experiments (*P < 0.05, Student's t‐test), respectively.

References
-
- Akhmanova A, Steinmetz MO (2015) Control of microtubule organization and dynamics: two ends in the limelight. Nat Rev Mol Cell Biol 16: 711–726 - PubMed
-
- Basto R, Lau J, Vinogradova T, Gardiol A, Woods CG, Khodjakov A, Raff JW (2006) Flies without centrioles. Cell 125: 1375–1386 - PubMed
-
- Bergstralh DT, Dawney NS, St Johnston D (2017) Spindle orientation: a question of complex positioning. Development 144: 1137–1145 - PubMed
-
- Bissig C, Gruenberg J (2014) ALIX and the multivesicular endosome: ALIX in Wonderland. Trends Cell Biol 24: 19–25 - PubMed
Publication types
MeSH terms
Substances
LinkOut - more resources
Full Text Sources
Other Literature Sources
Molecular Biology Databases
Miscellaneous
